

Exploring the role of mitophagy-related genes in breast cancer: subtype classification and prognosis prediction
- PMID: 39512680
- PMCID: PMC11539391
- DOI: 10.7150/ijms.100785
Exploring the role of mitophagy-related genes in breast cancer: subtype classification and prognosis prediction
Abstract
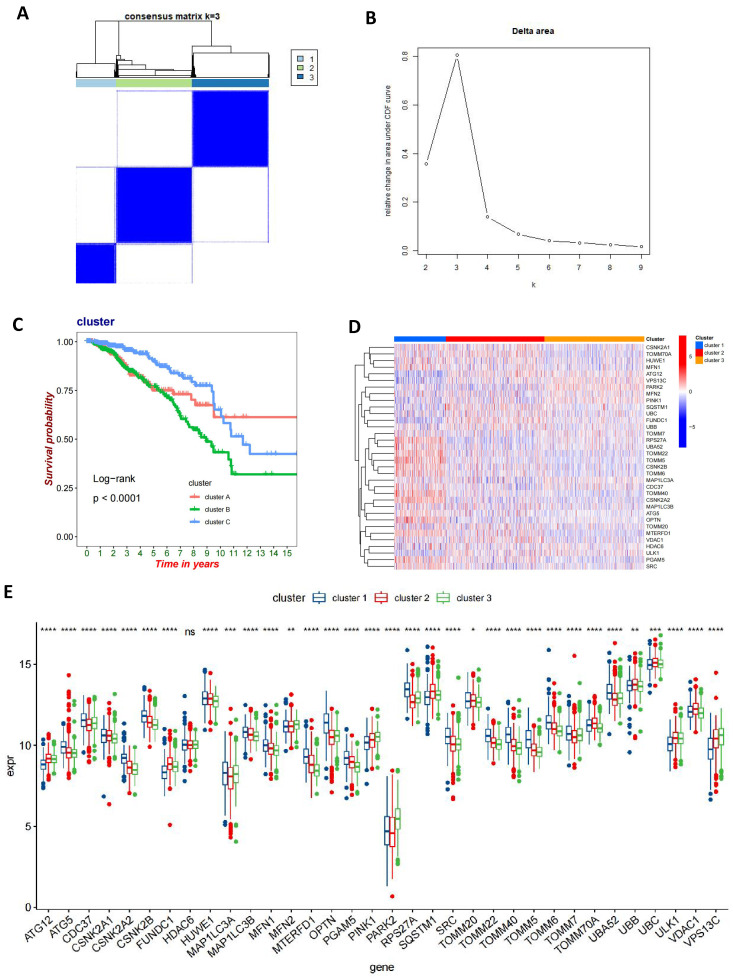
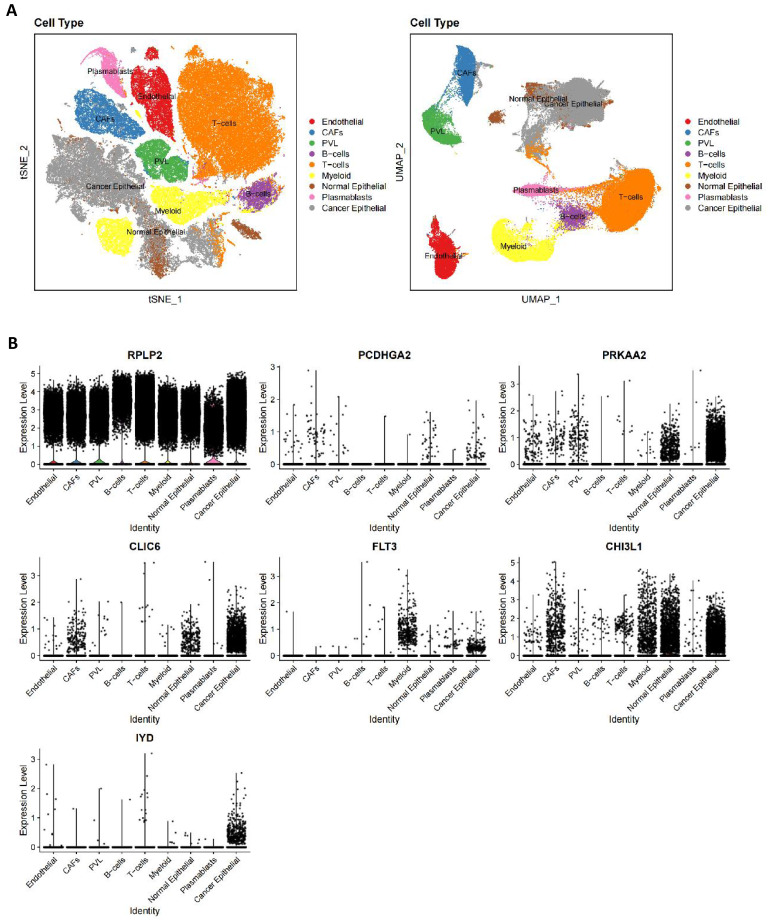
Background: Breast cancer (BC) is the most common cancer among women globally and poses the leading health threat to women worldwide, with persistently high incidence rates. Mitophagy is a selective autophagy process that specifically targets mitochondria within the cell, maintaining cellular energy balance and metabolic health by identifying and degrading damaged mitochondria. Although there is an understanding of the relationship between mitophagy and cancer, the specific mechanisms remain unclear due to the complexity and diversity of mitophagy, suggesting that it could be an effective and more targeted therapeutic approach for BC. Methods: In this study, we meticulously examined the BC expression and clinical pathology data from The Cancer Genome Atlas (TCGA) to assess the expression profiles, copy number variations (CNV), and to investigate the correlation, function, and prognostic impact of 34 mitophagy-related genes (MRGs). Differentially expressed genes (DEGs) were identified based on group classification. Lasso and Cox regression were used to determine prognostic genes for constructing a nomogram. Single-cell analysis mapped the distribution of these genes in BC cells. Additionally, the association between gene-derived risk scores and factors such as immune infiltration, tumor mutational burden (TMB), cancer stem cell (CSC) index, and drug responses was studied. In vitro experiments were conducted to confirm the analyses. Results: We included 34 MRGs and subsequently generated a risk score for 7 genes, including RPLP2, PCDHGA2, PRKAA2, CLIC6, FLT3, CHI3L1, and IYD. It was found that the low-risk group had better overall survival (OS) in BC, higher immune scores, but lower tumor mutational burden (TMB) and cancer stem cell (CSC) index, as well as lower IC50 values for commonly used drugs. To enhance clinical applicability, age and staging were incorporated into the risk score, and a more comprehensive nomogram was constructed to predict OS. This nomogram was validated and showed good predictive performance, with area under the curve (AUC) values for 1-year, 3-year, and 5-year OS of 0.895, 0.765, and 0.728, respectively. Conclusion: Our findings underscore the profound impact of prognostic genes on the immune response and prognostic outcomes in BC, indicating that they can provide new avenues for personalized BC treatment and potentially improve clinical outcomes.
Keywords: breast cancer; gene signature; immune; mitophagy; prognosis.
© The author(s).
Conflict of interest statement
Competing Interests: The authors have declared that no competing interest exists.
Figures


Similar articles
-
Identifying subtypes and developing prognostic models based on N6-methyladenosine and immune microenvironment related genes in breast cancer.Sci Rep. 2024 Jul 18;14(1):16586. doi: 10.1038/s41598-024-67477-w. Sci Rep. 2024. PMID: 39020010 Free PMC article.
-
Mitochondrial-related genes as prognostic and metastatic markers in breast cancer: insights from comprehensive analysis and clinical models.Front Immunol. 2024 Sep 24;15:1461489. doi: 10.3389/fimmu.2024.1461489. eCollection 2024. Front Immunol. 2024. PMID: 39380996 Free PMC article.
-
Identifying the prognostic significance of mitophagy-associated genes in multiple myeloma: a novel risk model construction.Clin Exp Med. 2024 Oct 29;24(1):249. doi: 10.1007/s10238-024-01499-6. Clin Exp Med. 2024. PMID: 39470826 Free PMC article.
-
PANoptosis-related molecular clustering and prognostic signature associated with the immune landscape and therapy response in breast cancer.Medicine (Baltimore). 2024 Sep 13;103(37):e39511. doi: 10.1097/MD.0000000000039511. Medicine (Baltimore). 2024. PMID: 39287311 Free PMC article.
-
Exploring the role of estrogen and progestins in breast cancer: A genomic approach to diagnosis.Adv Protein Chem Struct Biol. 2024;142:25-43. doi: 10.1016/bs.apcsb.2023.12.023. Epub 2024 Jun 11. Adv Protein Chem Struct Biol. 2024. PMID: 39059987 Review.
References
-
- DeSantis CE, Bray F, Ferlay J, Lortet-Tieulent J, Anderson BO, Jemal A. International Variation in Female Breast Cancer Incidence and Mortality Rates. Cancer Epidemiol Biomarkers Prev. 2015 Oct;24(10):1495–506. - PubMed
-
- Perou CM, Sørlie T, Eisen MB, van de Rijn M, Jeffrey SS, Rees CA. et al. Molecular portraits of human breast tumours. Nature. 2000 Aug 17;406(6797):747–52. - PubMed
-
- Fan L, Strasser-Weippl K, Li JJ, St Louis J, Finkelstein DM, Yu KD. et al. Breast cancer in China. Lancet Oncol. 2014 Jun;15(7):e279–289. - PubMed
MeSH terms
Substances
LinkOut - more resources
Full Text Sources
Medical
Miscellaneous
