. 2024 Oct 23;15(45):18796-18817.
doi: 10.1039/d4sc04544k. Online ahead of print.

Extended conformations of bifurcating electron transfer flavoprotein constitute up to half the population, possibly mediating conformational change

Affiliations

Extended conformations of bifurcating electron transfer flavoprotein constitute up to half the population, possibly mediating conformational change

Sharique A Khan et al. Chem Sci. .

Abstract

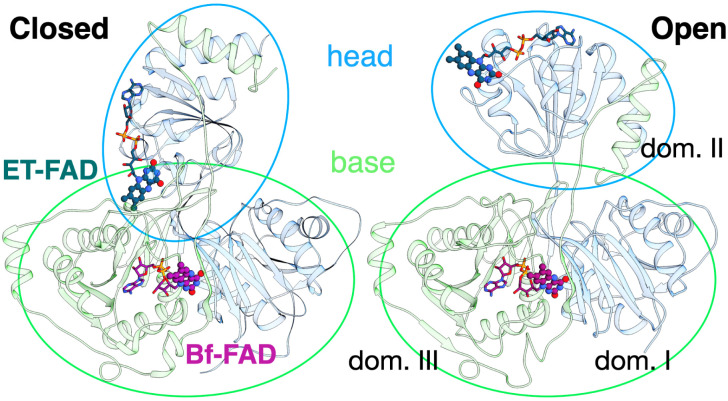
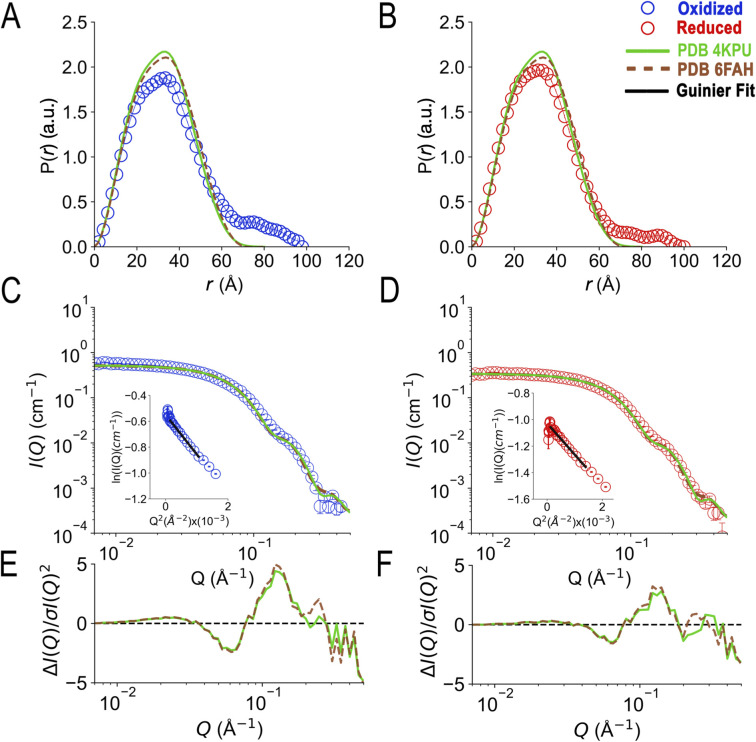
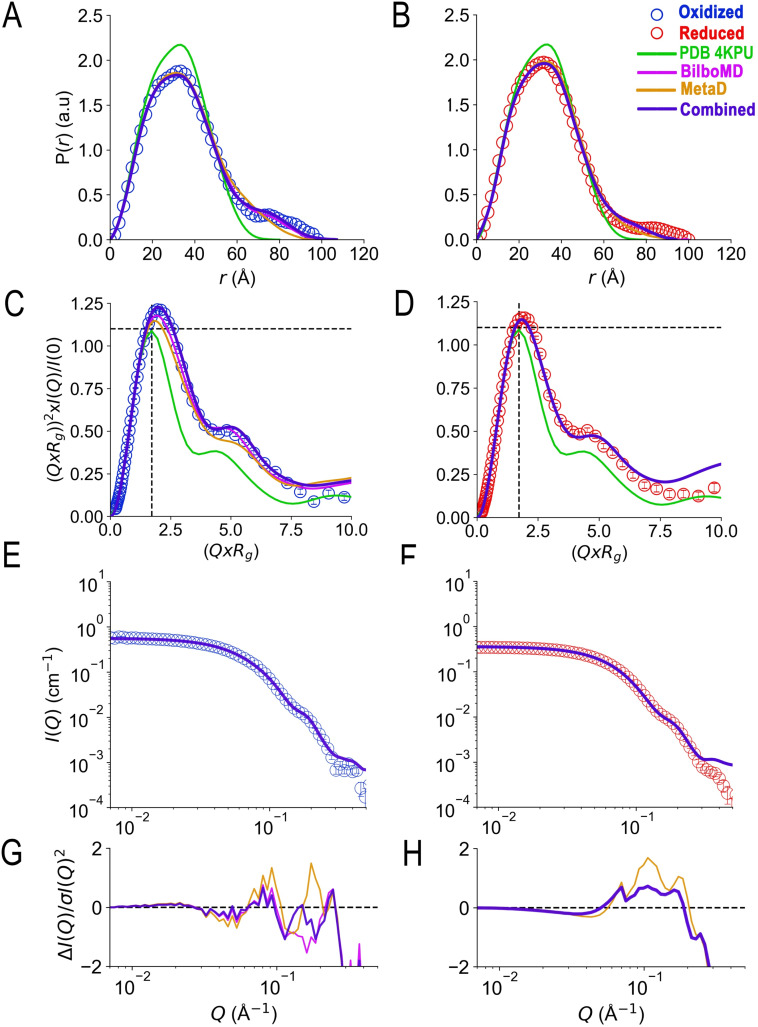
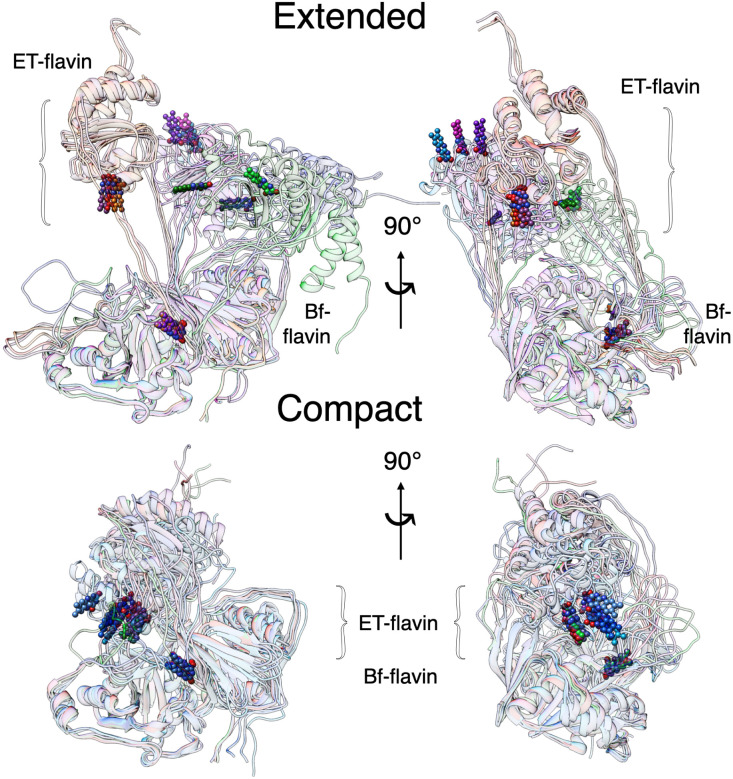
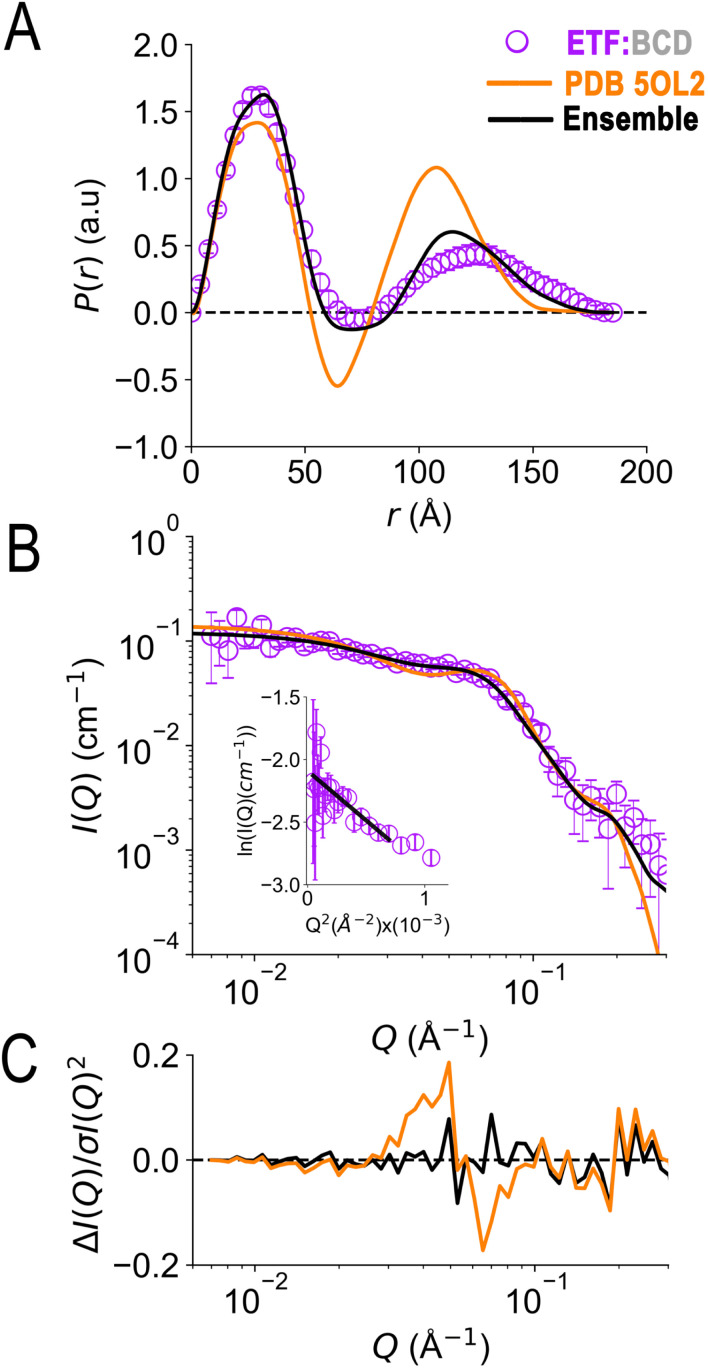
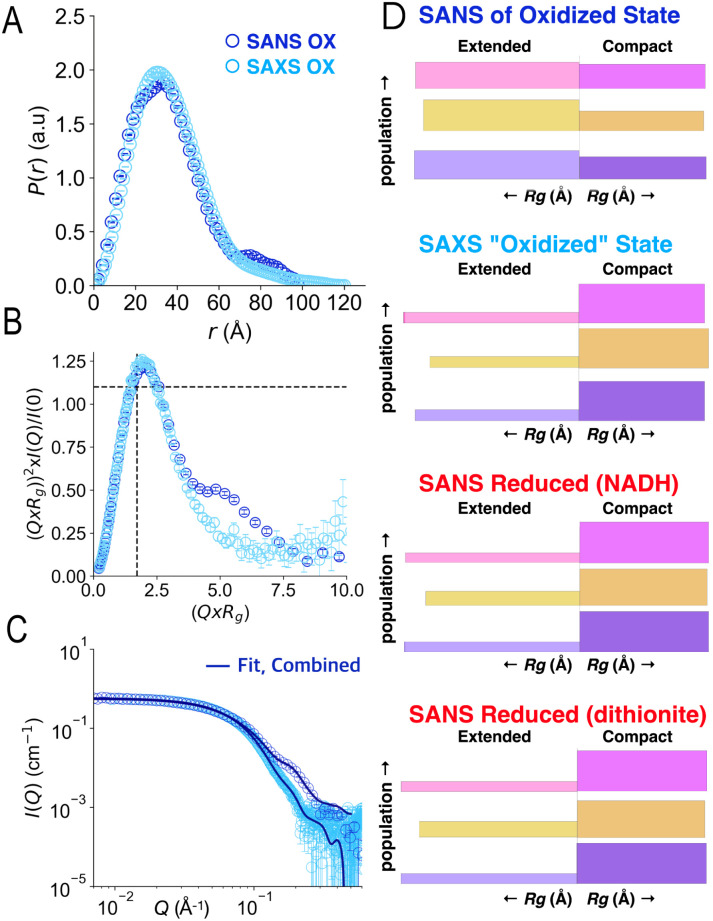
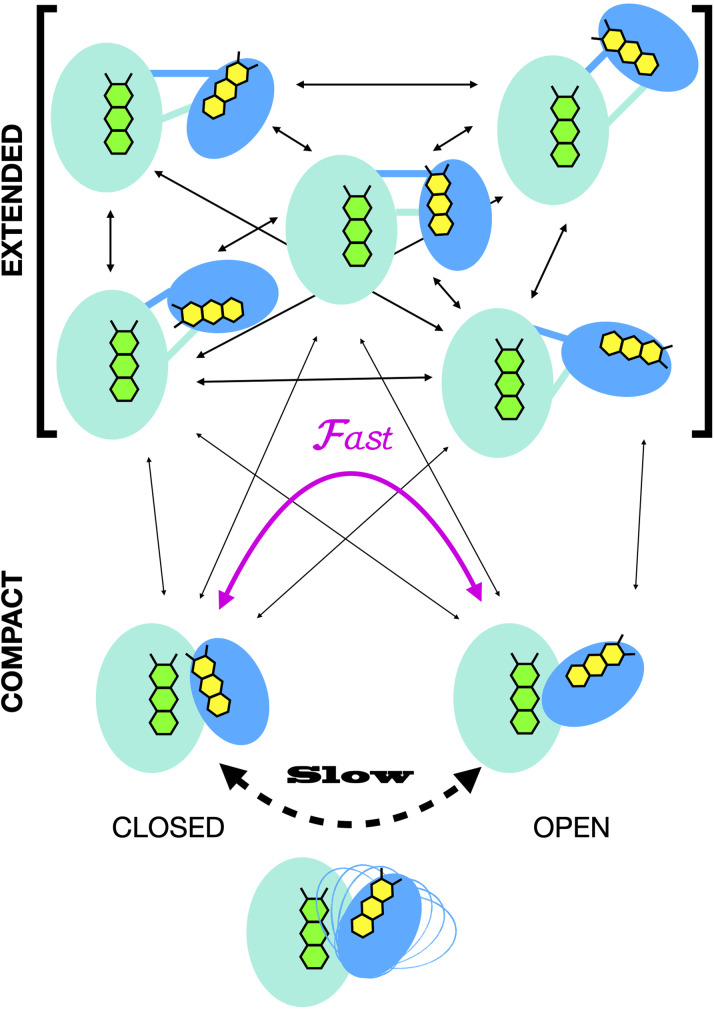
Electron transfer bifurcation enables biological systems to drive unfavourable (endergonic) electron transfer by coupling it to favourable (exergonic) transfer of a second electron. In electron transfer flavoproteins (ETFs), a domain-scale conformational change is believed to sever the favourable pathway after a single electron has used it, thereby preventing the energy dissipation that would accompany exergonic transfer of the second electron. To understand the conformation change that participates in turnover, we have deployed small-angle neutron scattering (SANS) and computational techniques to characterize the bifurcating ETF from Acidaminococcus fermentans (AfeETF). SANS data reveal an overall radius of gyration (R g) of 30.1 ± 0.2 Å and a maximum dimension (D max) of 100 Å for oxidized AfeETF. These measurements are 4 Å and 30 Å larger, respectively, than those of any published bifurcating ETF structure. Thus, we find that none of the reported ETF structures can explain the observed scattering, nor can any individual conformation generated by either of our molecular dynamics protocols. To optimize ensembles best able to explain the SANS data, we adapted a genetic algorithm. Successful ensembles contained a compact conformation comparable to one of the crystallographically documented conformations, accompanied by a much more extended one, and these two conformations sufficed to account for the data. The extended conformations identified all have R gs at least 4 Å larger than those of any currently published ETF structures. However, they are strongly populated, constituting 20% of the population of reduced ETF and over 50% of the population of oxidized AfeETF. Thus, the published (compact) structures provide a seriously incomplete picture of the conformation of AfeETF in solution. Moreover, because the composition of the conformational ensemble changes upon reduction of AfeETF's flavins, interconversion of the conformations may contribute to turnover. We propose that the extended conformations can provide energetically accessible paths for rapid interconversion of the open and closed compact conformations that are believed essential at alternating points in turnover.


Conflict of interest statement

There are no conflicts to declare.

Figures

Fig. 1
Fig. 1. Comparison of the two conformations captured in crystal structures. Ribbon diagrams of AfeETF showing proximity of the two flavins in the closed conformation (left) vs. exposure of the ET-flavin in the open conformation (right). Based on their roles in turnover, the two conformations are also called ‘B-like’ because the closed state appears to approximate a conformation that would optimize bifurcation by enabling rapid electron transfer between ETF's two flavins, and ‘D’ because the open conformation positions the ET flavin to donate an electron to the dehydrogenase or quinone reductase partner. Structures are based on 4KPU (left) and 6FAH (right) and displayed from the same perspective with respect to the base (the lower portion, as shown). FADs are shown in ball and stick with ET-FAD in teal and BF-FAD in purple using the CPK convention for non-C atoms. The flavin headgroups are rendered with thicker bonds for visibility and labelled in the left-hand structure. Subunits are coloured in pale blue (chain A) and green (chain B), and domains I, II and III are labelled in the right-hand structure. The head and base are also indicated by coloured ovals, showing how the head's orientation relative to the base differs in the two cases.
Fig. 2
Fig. 2. SANS demonstrates population of extended conformations in solution, depending on oxidation state. Panels A and B: pairwise distance distribution functions (P(r) profiles), wherein the prevalence (or probability) of scattering sites being separated by a particular distance is plotted vs. the distance separating the two scattering sites, r. Panels C and D: SANS profiles, with corresponding error-normalized residuals (panels E and F). The insets in panels C and D are Guinier fits. Results are compared for the oxidized (OX) state (panels A, C, and E), and the reduced (RED) state (panels B, D, and F). The data (circles) are compared with theoretical SANS and P(r) profiles calculated from the closed conformation (green, AfeETF's crystal structure, 4KPU, augmented to include the terminal His6 tag) and the open conformation (brown dashed line, based on AfeETF's sequence augmented with terminal His6 modelled on 6FAH). All data analyses were performed with Pepsi-SANS as described in the Experimental section. The open and closed conformations are compared in Fig. 1 and S4. Error bars are shown as solid vertical lines. In the P(r) profiles (panels A and B) they are standard deviations based on multiple fits to the data using a series of Monte Carlo simulations, while for the SANS profiles (panels C and D), they are derived from counting statistics errors (N1/2/N), where N is the number of detector counts.
Fig. 3
Fig. 3. Optical spectra documenting oxidation states of SANS samples. Blue lines describe OX AfeETF, red lines describe RED AfeETF. Spectra recorded before and after SANS data collection are in solid and dashed presentations, respectively. ‘Before’ data were collected some 2–4 hours before data collection occurred and ‘after’ data were collected at least 16–24 hours afterwards, due to safety protocols in place. Considering the long intervals over which the samples were at 10 °C in air, the changes observed are relatively modest. Moreover because the data were collected early in that interval, most of the changes occurred afterwards, so the data indicate that the sample remained reduced throughout the SANS data collection and a relatively small population of flavin (<10%) underwent conversion to 8-formyl flavin based on increased amplitude in the OX spectrum near 430 nm. Inset: Bar graph showing extinction coefficients at 374, 390, 454 and 700 nm that capture spectral features associated with flavin anionic semiquinone (ε374, ε390), OX state (ε454) and RED flavin with bound NAD+ (flavin hydroquinone: NAD+ charge-transfer, ε700). All values were scaled to ε454 of the OX samples, set to 100.
Fig. 4
Fig. 4. Map of fit to data onto conformational and function-related distances sampled by the Bilbo-MD and metadynamics ensembles. Each point is a structure representing a cluster that emerged from Bilbo-MD (panels A and C) or metadynamics (panels B and D), and is placed according to the minimum distance between any heavy atoms in the two FAD's isoalloxazine (‘flavin’) rings (RFAD, a distance related to speed of electron transfer between the flavins) and the radius of gyration (Rg, characterizing the degree of extension). In the top row, the points are coloured according to fit to OX data (A and B) vs. RED data below (C and D). χ2 values for the fits to the OX (blue to green to yellow) and RED (red to orange to yellow) data were then binned according to the upper limits shown in the legends, in order of low to high χ2. For reference, the values obtained from the exemplar crystal and cryo-EM structures 4KPU (closed), 7KOE (intermediate) and 6FAH (open) are displayed as well, using different symbols.
Fig. 5
Fig. 5. Agreement achieved with SANS data using a genetic algorithm and conformers from Bilbo-MD and metadynamics. Panels A and B compare the agreement with experimental P(r) profiles obtained by various fitting strategies wherein the prevalence (or probability) of scattering sites being separated by a particular distance is plotted vs. the distance separating the two scattering sites, r. Fits to OX P(r) are in panel A and those to RED (NADH) ETF's P(r) are in panel B, with the P(r) data shown as open circles in blue for OX and red for RED. Predictions of the best GA model for each state are the blue solid lines, and the models are those provided in Table 2 with χ2 = 1.3 (OX) and 5.9 (RED). For comparison, the predictions obtained when the GA drew only on subsets of the conformations are also shown: solid magenta lines depict the optimized ensembles employing two Bilbo-MD-derived conformations (χ2 = 2.7 for OX, 5.9 for RED) and gold lines depict those based on two metadynamics-derived conformations (χ2 = 8.3 for OX, and 13.4 for RED). The theoretical P(r) from the AfeETF crystal structure 4KPU is also shown as a green line. Panels C and D are the corresponding normalized Kratky plots. Panels E and F are the corresponding SANS profiles, with their normalized residuals in panels G and H, which also share the horizontal axes of E and F. Error bars are shown as solid vertical lines. For P(r) profiles (panels A and B) they are standard deviations based on multiple fits to the data using a series of Monte Carlo simulations. For normalized Kratky plots (panels C and D) they are standard errors propagated from SANS profiles. Errors for the SANS profiles (panels E and F) are derived from counting statistics errors (N1/2/N), where N is the number of detector counts.
Fig. 6
Fig. 6. Ensemble optimization identifies diverse extended conformations along with more similar compact conformations. Individual conformations were overlaid based on residues 33–199 of the EtfB chain within the base domain (lower domain as shown). Conformations obtained from fits to OX data are in blue hues, those obtained from fits to RED data sets are in red hues and conformations selected by the GA for ETF in complex with dBCD are in greens. The flavin head groups are depicted with heavy balls-and-sticks whereas the ribbon cartoons of the protein backbones are 70% transparent. Thus, the positions of the ET-flavin reveal the orientations of the head domain and the distances between flavins, which vary considerably, especially among extended conformations. The Bf-flavins appear more stationary because they are in the base domain, which was the basis of the overlay.
Fig. 7
Fig. 7. SANS of ETF in the presence of partner protein dBCD, and inadequacies of fits using either compact or extended ETF alone. Scattering from AfeETF is shown as magenta circles, stemming from ETF complexed with deuterated dBCD partner (the dBCD produces no net scattering and therefore does not contribute). Panel A: P(r) profiles, wherein the prevalence (or probability) of scattering sites being separated by a particular distance is plotted vs. the distance separating the two scattering sites, r. Panel B: SANS scattering profiles with Guinier plot as an inset. Panel C: residuals after fitting. The data are compared with the theoretical scattering predicted based the ETF2·BCD2 crystal structure in which the two ETFs are compact (orange lines, 5OL2), as well as predictions obtained from the optimal ensemble based on the combined pool of conformers and described in Table 2 (black lines). These two cases yield χ2 values of 2.7 and 0.8 respectively. Error bars are shown as solid vertical lines. For the P(r) profile (panel A) they are standard deviations based on multiple fits to the data using a series of Monte Carlo simulations, while for the SANS profile (panel B), they are derived from counting statistics errors (N1/2/N), where N is the number of detector counts.
Fig. 8
Fig. 8. Comparison of SAXS and SANS of OX ETF. Panel A: P(r) profiles, wherein the prevalence (or probability) of scattering sites being separated by a particular distance is plotted vs. the distance separating the two scattering sites, r. Panel B: normalized Kratky plots. Panel C: scattering profiles. Panel D: graphical comparison of the SAXS analysis results (second from top) with those of SANS of the OX state (above) and the two RED states (below). In panel D, results of Bilbo-MD are in magenta/pink, those obtained from metadynamics are in amber/gold and those that were chosen from combined analyses are in violet, as in Fig. 5. In each case the lengths of the horizontal bars depict each conformer's Rg while the thickness (height) of the bar denotes the population of that conformation in the two-conformer ensemble. Thus, compact conformers are more populated in RED states (thicker bars), and the SAXS analysis produces a similar result, whereas fits to OX data yield higher populations of the extended conformations. Error bars are shown as solid vertical lines. For P(r) profiles (panel A) they are standard deviations based on multiple fits to the data using a series of Monte Carlo simulations. For normalized Kratky plots (panel B) they are standard errors propagated from SANS profiles. Errors for the SANS profiles (panel C) are derived from counting statistics errors (N1/2/N), where N is the number of detector counts.
Fig. 9
Fig. 9. Cartoon of how an ensemble of extended conformations could mediate interconversion of the closed and open conformations. We suggest that an ensemble of extended conformations could serve as a friction-free ‘reservoir’ that facilitates interconversion of closed and open ETF by disengaging interactions between base and head domain, thereby affording the head increased freedom to explore diverse orientations before re-engaging interactions with the base. The head is depicted in blue and the base in sea green; the ET-flavin is coloured in yellow and the Bf-flavin is in green.

Similar articles

References

    1. Mitchell P. Possible molecular mechanisms of the protonmotive function of cytochrome systems. J. Theor. Biol. 1976;62:327–367. doi: 10.1016/0022-5193(76)90124-7. - DOI - PubMed
    1. Mitchell P. Protonmotive redox mechanism of the cytochrome b-c1 complex in the respiratory chain: protonmotive ubiquinone cycle. FEBS Lett. 1975;56:1–6. doi: 10.1016/0014-5793(75)80098-6. - DOI - PubMed
    1. Mitchell P. The protonmotive Q cycle: a general formulation. FEBS Lett. 1975;59:137–139. doi: 10.1016/0014-5793(75)80359-0. - DOI - PubMed
    1. Herrmann G. Jayamani E. Mai G. Buckel W. Energy conservation via electron-transferring flavoprotein in anaerobic bacteria. J. Bacteriol. 2008;190:784–791. doi: 10.1128/JB.01422-07. - DOI - PMC - PubMed
    1. Chowdhury N. P. Kahnt J. Buckel W. Reduction of ferredoxin or oxygen by flavin-based electron bifurcation in Megasphaera elsdenii. FEBS J. 2015;282:3149–3160. doi: 10.1111/febs.13308. - DOI - PubMed

LinkOut - more resources