. 2024 Sep 14;17(5):345-367.
doi: 10.1007/s12195-024-00817-y. eCollection 2024 Oct.

Multicompartmentalized Microvascularized Tumor-on-a-Chip to Study Tumor-Stroma Interactions and Drug Resistance in Ovarian Cancer

Affiliations

Multicompartmentalized Microvascularized Tumor-on-a-Chip to Study Tumor-Stroma Interactions and Drug Resistance in Ovarian Cancer

Simona Plesselova et al. Cell Mol Bioeng. .

Abstract

Introduction: The majority of ovarian cancer (OC) patients receiving standard of care chemotherapy develop chemoresistance within 5 years. The tumor microenvironment (TME) is a dynamic and influential player in disease progression and therapeutic response. However, there is a lack of models that allow us to elucidate the compartmentalized nature of TME in a controllable, yet physiologically relevant manner and its critical role in modulating drug resistance.

Methods: We developed a 3D microvascularized multiniche tumor-on-a-chip formed by five chambers (central cancer chamber, flanked by two lateral stromal chambers and two external circulation chambers) to recapitulate OC-TME compartmentalization and study its influence on drug resistance. Stromal chambers included endothelial cells alone or cocultured with normal fibroblasts or cancer-associated fibroblasts (CAF).

Results: The tumor-on-a-chip recapitulated spatial TME compartmentalization including vessel-like structure, stromal-mediated extracellular matrix (ECM) remodeling, generation of oxygen gradients, and delayed drug diffusion/penetration from the circulation chamber towards the cancer chamber. The cancer chamber mimicked metastasis-like migration and increased drug resistance to carboplatin/paclitaxel treatment in the presence of CAF when compared to normal fibroblasts. CAF-mediated drug resistance was rescued by ECM targeted therapy. Critically, these results demonstrate that cellular crosstalk recreation and spatial organization through compartmentalization are essential to determining the effect of the compartmentalized OC-TME on drug resistance.

Conclusions: Our results present a functionally characterized microvascularized multiniche tumor-on-a-chip able to recapitulate TME compartmentalization influencing drug resistance. This technology holds the potential to guide the design of more effective and targeted therapeutic strategies to overcome chemoresistance in OC.

Supplementary information: The online version contains supplementary material available at 10.1007/s12195-024-00817-y.

Keywords: Cancer-associated fibroblasts; Compartmentalization; Drug resistance; Ovarian cancer; Tumor microenvironment; Tumor-on-a-chip.


Conflict of interest statement

Conflict of interestDr. Pilar de la Puente and Kristin Calar have a patent for the 3D culture method described in this manuscript, US Patent Application #2022/0228124. Pilar de la Puente is the co-founder of Cellatrix LLC; however, there has been no contribution of the aforementioned entity to the current study. Simona Plesselova, Hailey Axemaker, Emma Sahly, Amrita Bhagia, Jessica Faragher, and Darci Fink state no conflicts of interest.

Figures
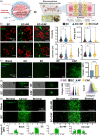
Fig. 1
Fig. 1
Multiniche microvascularized tumor-on-a-chip recapitulates the compartmentalized OC-TME. a Schematic representation of the tumor microenvironment (left) and tumor-on-a-chip device and close-up view of the different chambers and cell types seeded inside (right) and real image of microfluidic device filled with dyes next to a nickel representing the size of the platform (bottom). b Representative images of the stromal chamber with vessel-like structures formation of endothelial cells (EC) stained with BV605-anti-CD31 (red) in monoculture or coculture with normal fibroblasts (NF) or cancer-associated fibroblasts (CAF) stained with FITC-anti-CD90 (green) and the quantification of the circularity, area, inner diameter, and elongation of the vessels. Median value is marked in red. Scale Bar = 100 µm. *p < 0.05, **p < 0.01, Mann-Whitney nonparametric test compared to EC. c Representative images of the stromal chamber by immunofluorescent staining with AF488-anti-collagen I in blank gel or mono-culture cells grown in the microfluidic device for 7 days and quantification of the mean fluorescent intensity (MFI) of AF488. Scale Bar = 100 µm. Mean ± SD, ****p < 0.0001, t-test. d Imaging flow cytometry analysis of cells isolated from microfluidic device and analyzed for collagen I, including representative images, representative histogram of each condition and violin plot for quantification of MFI of AF488 inside individual cells. Median value is marked in red. ****p < 0.0001, Mann-Whitney nonparametric test. Scale Bar = 10 µm. e Representative images of OC cells grown in presence of blank scaffold, EC, EC + NF or EC + CAF in the stromal chambers for 7 days and stained with hypoxic Image-iTTM reagent (green) and quantification of MFI of the device divided in 9 sections from left to right. Scale Bar = 1 mm. Mean ± SD, *p < 0.05, **p < 0.01, ***p < 0.001, ****p < 0.0001, Two-Way ANOVA compared to Blank. Figure a created with Biorender.com
Fig. 2
Fig. 2
Hypoxic stroma induces epithelial-mesenchymal transition in OC cells. a KURAMOCHI cells (OC), EC, NF and CAF were grown in monoculture in hypoxic 3D scaffolds for 7 days and the expression of cellular fibronectin in each cell type was detected with imaging flow cytometry with CF488-anti-fibronectin antibody. Representative images are shown on the left and violin plots of the quantification of MFI of CF488 inside individual cells on the right. Median value is marked in red. Scale bar = 10 µm, ****p < 0.0001, Mann-Whitney nonparametric test. Moreover, the OC cells were grown in monoculture or cocultured with EC, NF or CAF in the hypoxic 3D scaffold for 7 days and then stained with b CF488-anti-fibronectin or c APC-anti-N-cadherin antibodies and OC were analyzed by flow cytometry. Representative histograms are shown on the left and the quantification of MFI of each antibody on the right. Mean ± SD, **p < 0.01, ****p < 0.0001, Two-Way ANOVA compared to OC
Fig. 3
Fig. 3
Tumor-on-a-chip allows for cluster formation and metastasis-like migration while recapitulating tumor-stroma interactions. a KURAMOCHI cells (DiD, purple) were grown in cancer chamber with blank scaffold, EC (BV605-anti-CD31, red), EC + NF (FITC-anti-CD90, green) or EC + CAF (FITC-anti-CD90, green) in stromal chambers and images were taken on days 3, 7 and 14. Scale bar = 1 mm. Close-up magnification images show the interactions between cancer and stromal chambers (yellow rectangles) and yellow arrows show the cluster formation on day 14. Scale Bar = 0.5 mm. b Quantification of number of clusters on the left, Mean ± SD, Two-Way ANOVA compared to blank, and cluster area for KURAMOCHI cultures (low-metastatic potential) on the right, Mann-Whitney nonparametric test, *p < 0.05, **p < 0.01, ***p < 0.001, ****p < 0.0001 c SKOV-3 cells (DiD, purple) were grown in cancer chamber with blank scaffold, EC (BV605-anti-CD31, red), EC + NF (FITC-anti-CD90, green) or EC + CAF (FITC-anti-CD90, green) in stromal chambers and images were taken on days 3, 7 and 14. Scale bar = 1 mm. Close-up magnification images show the interactions between cancer and stromal chambers (yellow rectangles). Scale bar = 0.5 mm. White discontinued lines denote distance of migration towards stromal chamber. d Quantification of distance of migration and number of migrated cells (MFI of DiD) for SKOV-3 cultures (high metastatic potential). *p < 0.05,***p < 0.001, ****p < 0.0001, Two-Way ANOVA
Fig. 4
Fig. 4
Microfluidic device mimics drug penetration gradients in OC-TME. a Schematic representation of method used for doxorubicin penetration assay, where doxorubicin (100 µM) was injected in both circulation channels and images were taken in time-lapse fluorescent microscope up to 24 h. b Representative images at 5 min, 30 min, 2, 4, 7 and 24 h of doxorubicin penetration. Scale Bar = 1 mm. c Quantification of the fluid velocity (μm/s) inside the microfluidic device over the time (h) (left) and MFI of doxorubicin penetration inside the cancer and stromal chambers at each time point (right). d Schematic representation of method used for doxorubicin uptake, cancer cells were cultured surrounded by different stromal cells (EC, NF, or CAF) or blank scaffold as a control for 5 days and then doxorubicin (100 µM) was injected in both circulation channels and images were taken at 24 h. e Representative images of doxorubicin uptake by cells at 24 h. Scale Bar = 1 mm. Figure a and d created with Biorender.com
Fig. 5
Fig. 5
Multiniche microvascular tumor-on-a-chip recapitulates CAF-induced drug resistance in OC-TME. a Schematic representation of the methods used in this experiment where OC cell lines were cultured in presence of different stromal components (blank 3D scaffold, EC, EC + NF and EC + CAF) in stromal chamber for 3 days to allow compartmentalization and then treated with paclitaxel and carboplatin (PC) for 4 days. DMSO-treated chips were used as a control. Nuclear ID live (green)/dead (red) reagent was used to determine cell viability. b Representative images of merged green(live)/red(dead) and red channel (dead cells) for KURAMOCHI in cancer chamber. Scale Bar = 500 µm. c Quantification of percentage of cell death normalized by the total number of cells per condition. Mean ± SD, *p < 0.05, ***p < 0.001, ****p < 0.0001, Two-Way ANOVA. d Representative images of merged green(live)/red(dead) and red channel (dead cells) for SKOV3 in cancer chamber. Scale Bar = 500 µm. e Quantification of percentage of cell death normalized by the total number of cells in each condition. Mean ± SD, *p < 0.05, t test to corresponding DMSO control. Figure a created with Biorender.com
Fig. 6
Fig. 6
CAF-mediated collagen secretion is inhibited by an anti-TGF-β targeting agent. KURAMOCHI, EC, NF and CAF were grown in monoculture in the microfluidic device for 7 days in the presence or absence of halofuginone (HALO) as a targeting agent for TGF-β a Representative images of the stromal chamber by immunofluorescent staining with AF488-anti-collagen I (left) and quantification of the mean fluorescent intensity (MFI) of AF488 (right). Scale Bar = 100 µm. Mean ± SD, *p < 0.05, **p < 0.01, ****p < 0.0001, Two-Way ANOVA. b Representative images of imaging flow cytometry of the cells stained with AF488-anti-collagen I (left) and violin plots with quantification of the mean fluorescent intensity (MFI) of AF488 (right) in the individual cells. Scale Bar = 10 µm. Median value is marked in red. ****p < 0.0001, Mann-Whitney test compared to DMSO. c Representative images of collagen fibers in SHG microscopy. Scale bar = 20 µm. d Hue, Saturation and Brihgtness (HSB) color orientation maps generated with OrientationJ plugin in ImageJ software to visualize the orientation of the collagen fibers. Scale bar = 20 µm. e Representative orientation histograms in degrees generated with OrientationJ plugin in ImageJ software. f Quantification of the secretion of the free active TGF-β1 (pg/ml) by ELISA, *p < 0.05,***p < 0.001, ****p < 0.0001, Two-Way ANOVA
Fig. 7
Fig. 7
CAF-mediated drug resistance can be rescued by an anti- TGF-β targeting agent. a Schematic representation of methods used in this approach where the chips were pre-treated with halofuginone (HALO) as a targeting agent for TGF-β then treated with paclitaxel and carboplatin (PC) for 4 days. b Representative close-up images of KURAMOCHI grown in central chamber with blank scaffold, endothelial cells (EC), EC in co-culture with NF or CAF in stromal chamber treated with PC or PC with halofuginone (PC + H) (as pre-treatment). Live/Dead Nuclear ID dye was used to detect live cells (green) and dead cells (red). Scale Bar = 500 µm. c Quantification of percentage of cell death normalized by the total number of cells in each condition. Mean ± SD, *p < 0.05, t test to corresponding PC condition. Figure a created with Biorender.com

Update of

References

    1. Lisio, M. A., L. Fu, A. Goyeneche, Z. H. Gao, and C. Telleria. High-grade serous ovarian cancer: basic sciences, clinical and therapeutic standpoints. Int. J. Mol. Sci. 2019. 10.3390/ijms20040952. - PMC - PubMed
    1. Morand, S., M. Devanaboyina, H. Staats, L. Stanbery, and J. Nemunaitis. Ovarian cancer immunotherapy and personalized medicine. Int. J. Mol. Sci. 2021. 10.3390/ijms22126532. - PMC - PubMed
    1. Ortiz, M., E. Wabel, K. Mitchell, and S. Horibata. Mechanisms of chemotherapy resistance in ovarian cancer. Cancer Drug. Resist. 5(2):304–316, 2022. 10.20517/cdr.2021.147. - PMC - PubMed
    1. Gertych, A., A. E. Walts, K. Cheng, M. Liu, J. John, J. Lester, et al. Dynamic changes in the extracellular matrix in primary, metastatic, and recurrent ovarian cancers. Cells. 2022. 10.3390/cells11233769. - PMC - PubMed
    1. Mendoza-Martinez, A. K., D. Loessner, A. Mata, and H. S. Azevedo. Modeling the tumor microenvironment of ovarian cancer: the application of self-assembling biomaterials. Cancers (Basel). 2021. 10.3390/cancers13225745. - PMC - PubMed

LinkOut - more resources