. 2024 Oct 14;15(19):6355-6363.
doi: 10.7150/jca.101403. eCollection 2024.

NAT10 Mediates XPO1 mRNA N4-acetylation and Promotes Drug Resistance of Myeloma Cells

Affiliations

NAT10 Mediates XPO1 mRNA N4-acetylation and Promotes Drug Resistance of Myeloma Cells

Yinyin Xu et al. J Cancer. .

Abstract

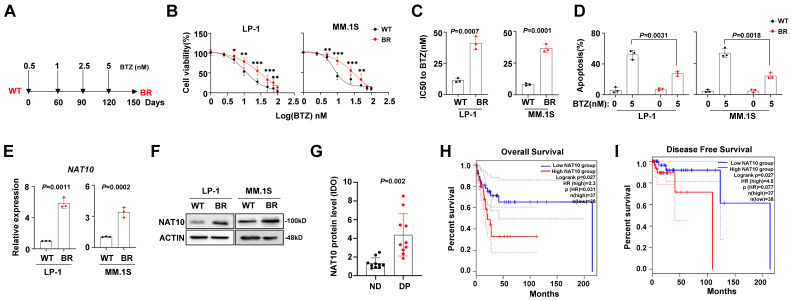
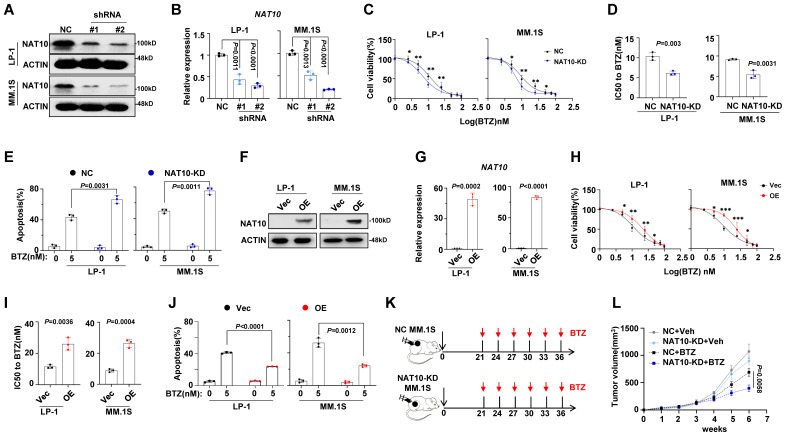
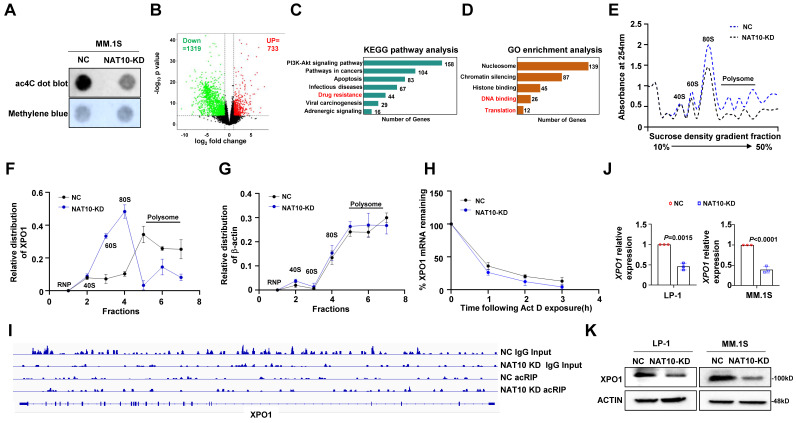
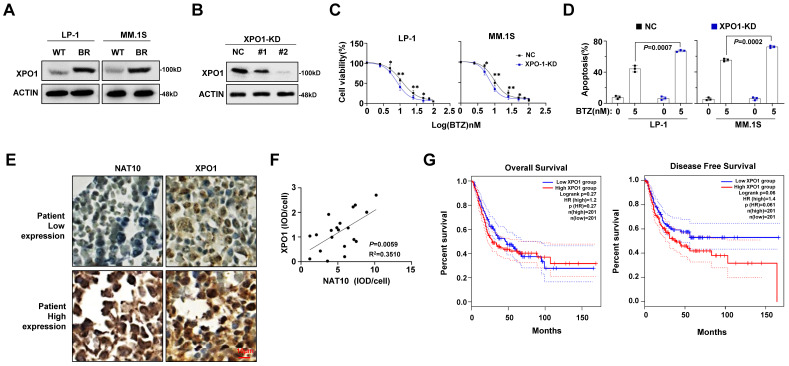
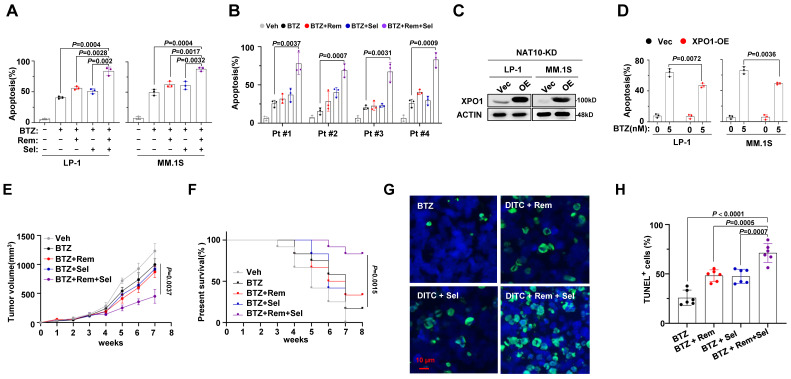
The eventually developed chemoresistance to proteasome inhibitors (PIs) is a major hurdle in curing patients with multiple myeloma (MM) and a key cause of poor prognosis, however the underlying molecular mechanisms of chemoresistance is still poorly understood. Herein, we provide evidences that N-acetyltransferase 10 (NAT10), a catalytic enzyme involving in the acetylation modification of RNA, is overexpressed in the BTZ-resistant (BR) MM cell lines and predicts poor outcomes in the clinic. Further manipulating of NAT10 gene expression in MM cells shows that enforced NAT10 expression decreases sensitivity to PI, however knockdown of NAT10 enhances anti-tumor efficacy of PIs in MM cells in vitro and in vivo. Acetylated RNA immunoprecipitation sequencing (acRIP-seq) combined with RIP-qPCR analysis identifies exportin 1 (XPO1) as an important downstream target of NAT10, with promotes N4-acetylcytidine (ac4C) modification of XPO1 mRNA. Importantly, expressions of XPO1 and NAT10 are meaningfully correlated in bone biopsies from the relapsed/refractory (R/R) MM patients, which were also highly associated with poor outcome. Translationally, dual pharmacological inhibition of NAT10 and XPO1 sensitizes MM cells to BTZ treatment in both cell lines and in a xenograft mouse model of MM. Thus, our study elucidates previously unrecognized role of ac4C modification of XPO1 mRNA in the chemoresistance of MM and provides a potential option for clinical management of R/R MM patients in the clinic.

Keywords: Chemoresistance; Multiple myeloma; NAT10; XPO1; ac4C modification.


Conflict of interest statement

Competing Interests: The authors have declared that no competing interest exists.

Figures

Figure 1
Figure 1
NAT10 expression is correlated with BTZ resistance in MM cells. (A) Diagram of induction of BTZ resistance in human MM cell lines. Cells were exposed to increasing concentrations of BTZ (from 0.5 nM to 5 nM) for three months. (B) Alteration of IC50 to BTZ treatment in the wild type (WT) and BTZ-resistant (BR) LP-1 and MM.1S cells. (C) Comparison of the IC50 values of WT and BR cells (n = 3 biologically independent experiments; mean ± SEM). (D) Flow cytometry analysis of apoptosis of WT and BR cells after BTZ treatment. (n =6 biologically independent experiments; mean ± SEM.) (E) NAT10 mRNA (F) and protein expression in WT and BR LP-1 and MM.1S cells. (G) IDO+ area measurement of immunohistochemical staining for NAT10 protein in the MM tissue slides from newly diagnosed (ND) patients and patients with disease progression (DP). (H, I) Correlation of NAT10 mRNA expression with Overall Survival (OS) and Disease-Free Survival in MM patients after receiving BTZ-based treatment regimens. p values were determined by Pearson Coefficient and Log-ranks test. Two-sided p values were determined by Student's t test. Data indicate the mean ± SEM.
Figure 2
Figure 2
Manipulation of NAT10 expression alters sensitivity to DTIC treatment in vitro and in vivo. (A) Representative western blotting (n = 3 biologically independent experiments) shows the knockdown effects in LP-1 and MM.1S cells infected with lentivirus carrying three shRNAs targeting two different coding sequencing of NAT10 gene (shRNA#1, #2) compared to the non-target control (NC). (B) Histogram showing NAT10 relative expression of shNAT10 and NC LP-1 and MM.1S cells. (C) Alteration of IC50 to BTZ treatment in the NT Control (NC) and NAT10 knockdown (shNAT10) cells and (D) comparison of the IC50 values of NC and shNAT10 cells (n = 3 biologically independent experiments). Two-sided p-values were determined by Student's t test; mean ± SEM. (E) Frequency of apoptosis cells after BTZ treatment. (F) Representative western blot (n=3 biologically independent experiments) shows the ectopic expression of NAT10 in LP-1 and MM.1S cells infected with lentivirus carrying the NAT10- overexpression plasmids (NAT10- OE) compared to the vector control (Vec). (G) Histogram showing NAT10 relative expression of NAT10- OE and Vec LP-1 and MM.1S cells. (H) Alteration of IC50 to BTZ treatment in the Vec and NAT10- OE cells and (I) comparison of the IC50 values of Vec and NAT10- OE cells (n = 3 biologically independent experiments). (J) Frequency of apoptosis cells after BTZ treatment. (K) Experimental setup used to assess the effects of NAT10 on MM tumor growth and BTZ sensitivity in vivo in NOD/SCID mice. Mice were subcutaneous (s.c.) injected with 1 × 10⁶ NC or NAT10- KD LP-1 cells followed by i.v. injections of BTZ (1 mg/kg) or PBS every three days (n=6). Tumor growth was measured and calculated as 1/2(L × W2) mm, where the L presenting the length and W representing width of tumor. (L) Relative tumor growth curves of tumors. Two-sided p-values were determined by two-way ANOVA test; mean ± SEM.
Figure 3
Figure 3
NAT10 acetylates XPO1 mRNA to enhance translation efficiency. (A) Representative anti-ac4C dot blot performed on total RNA of NAT10-KD and NC cells. (B) Volcano map of differentially expressed ac4C gene peaks upon NAT10 knockdown. (C) KEGG pathway enrichment analysis of acRIP-seq. KEGG, Kyoto Encyclopedia of Genes and Genomes. (D) GO enrichment analysis of acRIP-seq. GO, Gene Ontology. (E) Polysome profile assay shows an overall decreased tendency of translation efficiency in NAT10-KD MM cells. (F, G) qPCR showing the changed relative distribution of NAT10 mRNA in different polysome gradient fractions between control and NAT10-KD cells. β-actin without ac4C modification is used as control mRNA. (H) BRIC RT-qPCR assay measuring the half-life of DKK1 mRNA in NAT10- KD and NC MM cells (n= 3). (I) Gene tracks showing representative acRIP-Seq profiles at XPO1 gene loci in NAT10-KD and NC LP-1 cells. (J) XPO1 mRNA expression and (K) protein level in NAT10-KD and NC MM cells. n = 3, p value determined by Student's t test.
Figure 4
Figure 4
XPO1 expression correlated with MM malignancy. (A) Protein level of XPO1 after induction of BTZ resistance in LP-1 and MM.1S cells. (B) Representative Western blotting shows the knockdown effects in LP-1 cells infected with lentivirus carrying two shRNAs targeting different coding sequencing of XPO1 gene (shRNA#1, #2) compared to the non-target control (NC). (C) Alteration of IC50 to BTZ treatment in the NC and XPO1 knockdown (KD) cells. (D) Flow cytometry analysis of cell apoptosis induced by 5nM BTZ for 24 h. (E) Representative immunohistochemical staining for NAT10 and XPO1 protein in MM issue slides from same patient show the correlation of expression. Scale bar: 10µm. (F) Correlation of NAT10 with XPO1 expression in clinical samples of MM patients (n=20). (G) Correlation of XPO1 expression with disease-free survival and OS in MM patients after receiving BTZ -based treatment regimens. All p-values were determined by Pearson Coefficient and Log-ranks test. Data represent mean± SEM.
Figure 5
Figure 5
Effect of combinational treatment with Remodelin and Selinexor in sensitizing MM cells to bortezomib in vitro and in vivo. (A) Flow cytometry analysis for apoptosis of MM cell lines or (B) CD138+ plasma cells from MM patients treated with BTZ (5nM) in presence of Remodelin (300nM) and Selinexor (300nM) for 48 h. p value determined by Student's t test for n= 3 independent experiments. (C) Western blotting shows the ectopically expression of XPO1 in NAT10-KD LP-1 and MM.1S cells. (D) Frequency of apoptosis cells after BTZ treatment. (E) 1×10⁶ BR LP-1 cells were used to establish xenograft MM model in NOD/SCID mice, growth of tumors in mice receiving DMSO (Veh), BTZ (1 mg/kg), BTZ plus Remodelin (10 mg/kg) or Selinexor (10 mg/kg), and combination treatment of Remodelin and Selinexor plus BTZ were measured every week (n= 6/group). Differences between groups were analyzed using one-way ANOVA. (F) Kaplan-Meier curves showing survival of mice. (G) Confocal image of representative immunofluorescence staining for tumor tissue TUNEL (Alexa Fluor 488, green) and nuclei (DAPI, blue) at 4 weeks. (H) Quantification of TUNEL-positive cells. Two-sided p-values were determined by two-way ANOVA test; mean ± SEM.

Similar articles

References

    1. Siegel RL, Miller KD, Jemal A. Cancer statistics, 2018. CA Cancer J Clin. 2018;68:7–30. - PubMed
    1. Barbieri I, Kouzarides T. Role of RNA modifications in cancer. Nature reviews Cancer. 2020;20:303–22. - PubMed
    1. Yang T, Liu X, Kumar SK, Jin F, Dai Y. Decoding DNA methylation in epigenetics of multiple myeloma. Blood reviews. 2022;51:100872. - PubMed
    1. Harding T, Swanson J, Van Ness B. EZH2 inhibitors sensitize myeloma cell lines to panobinostat resulting in unique combinatorial transcriptomic changes. Oncotarget. 2018;9:21930–42. - PMC - PubMed
    1. Dimopoulos K, Sogaard Helbo A, Fibiger Munch-Petersen H, Sjo L, Christensen J, Sommer Kristensen L. et al. Dual inhibition of DNMTs and EZH2 can overcome both intrinsic and acquired resistance of myeloma cells to IMiDs in a cereblon-independent manner. Molecular oncology. 2018;12:180–95. - PMC - PubMed