. 2024 Dec;17(12):e011725.
doi: 10.1161/CIRCHEARTFAILURE.124.011725. Epub 2024 Nov 8.

Myocardial Posttranscriptional Landscape in Peripartum Cardiomyopathy

Affiliations

Myocardial Posttranscriptional Landscape in Peripartum Cardiomyopathy

Amy Li et al. Circ Heart Fail. 2024 Dec.

Abstract

Background: Pregnancy imposes significant cardiovascular adaptations, including progressive increases in plasma volume and cardiac output. For most women, this physiological adaptation resolves at the end of pregnancy, but some women develop pathological dilatation and ultimately heart failure late in pregnancy or in the postpartum period, manifesting as peripartum cardiomyopathy (PPCM). Despite the mortality risk of this form of heart failure, the molecular mechanisms underlying PPCM have not been extensively examined in human hearts.

Methods: Protein and metabolite profiles from left ventricular tissue of end-stage PPCM patients (N=6-7) were compared with dilated cardiomyopathy (DCM; N=5-6) and nonfailing donors (N=7-18) using unbiased quantitative mass spectrometry. All samples were derived from the Sydney Heart Bank. Data are available via ProteomeXchange with identifier PXD055986. Differential protein expression and metabolite abundance and Kyoto Encyclopedia of Genes and Genomes pathway analyses were performed.

Results: Proteomic analysis identified 2 proteins, SBSPON (somatomedin B and thrombospondin type 1 domain-containing protein precursor) and TNS3 (tensin 3), that were uniquely downregulated in PPCM. SBSPON, an extracellular matrix protein, and TNS3, involved in actin remodeling and cell signaling, may contribute to impaired tissue remodeling and fibrosis in PPCM. Metabolomic analysis revealed elevated levels of homogentisate and deoxycholate and reduced levels of lactate and alanine in PPCM, indicating disrupted metabolic pathways and glucose utilization. Both PPCM and DCM shared pathways related to inflammation, immune responses, and signal transduction. However, thyroid hormone signaling was notably reduced in PPCM, affecting contractility and calcium handling through altered expression of PLN (phospholamban) and Sarcoendoplasmic Reticulum Calcium ATPase (SERCA). Enhanced endoplasmic reticulum stress and altered endocytosis pathways in PPCM suggested additional mechanisms of energy metabolism disruption.

Conclusions: The present study reveals unique posttranslational molecular features of the PPCM myocardium, which mediates cellular and metabolic remodeling, and holds promise as potential targets for therapeutic intervention.

Keywords: cardiomyopathy; heart failure; metabolomics; myocardium; peripartum period; pregnancy; proteomics.


Conflict of interest statement

None.

Figures

Figure 1.
Figure 1.
Schematic summary. A, Schematic of condition groups and multi-omic profiling platforms of the samples. B, Patient and sample summary of the experiment. Top, Disease condition (left) and age (right) distributions in measured individual hearts by proteomics. Bottom, Disease condition (left) and age (right) distributions in measured individual hearts by metabolomics. Age distributions are illustrated by boxplots, which indicate medians as the middle line, first and third quartiles as the box, and whiskers show the 1.5× interquartile range above and below the box. C, Counts of individual hearts measured by each omic platform in a Venn diagram. DCM indicates dilated cardiomyopathy; LC-MS/MS, liquid chromatography-tandem mass spectrometry; and PPCM, peripartum cardiomyopathy.
Figure 2.
Figure 2.
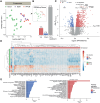
Differential analysis in protein expression level between peripartum cardiomyopathy (PPCM) and donor samples. A, Multidimensional scaling (MDS) plot of proteomic data. B, Summary of differentially expressed (DE) proteins comparing PPCM vs donor. Estimates are derived using a linear regression model adjusted for log2-transformed age with nDonor=18 and nPPCM=6. The direction of regulation is in reference to the donor; that is, upregulated proteins are higher expressed in PPCM than in the donors. C, Volcano plot for differential analysis in proteins comparing PPCM vs donor. D, Heatmap with dendrograms of the top 100 DE proteins by Benjamini-Hochberg (BH)-adjusted P values between PPCM and donor. Protein intensities are centered on their sample medians. Samples are annotated by their condition groups. Proteins are annotated by direction of differential expression. E, Kyoto Encyclopedia of Genes and Genomes pathways significantly enriched in DCM compared with donor. AGE-RAGE indicates advanced glycation end products−receptor for advanced glycation end products; cGMP-PKG, cGMP−protein kinase G; FC, fold change; MAPK, mitogen-activated protein kinase; and PI3K-Akt, phosphoinositide 3-kinase−protein kinase B.
Figure 3.
Figure 3.
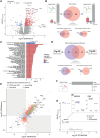
Differentially expressed (DE) proteins in dilated cardiomyopathy (DCM) vs donor compared with those of peripartum cardiomyopathy (PPCM) vs donor. A, Volcano plot for differential analysis in proteins comparing DCM vs donor. Estimates are derived using a linear regression model adjusted for log2-transformed age with nDonor=18 and nDCM=6. The direction of regulation is in reference to donor; that is, upregulated proteins are higher expressed in DCM than donor. B, Left, Summary of DE proteins comparing DCM vs donor. Right, Summary of DE proteins comparing PPCM vs donor (also as Figure 2B). Middle, Venn diagram showing the overlap in DE proteins in DCM vs donor and those in PPCM vs donor. Bottom left, Venn diagram showing the overlap in upregulated DE proteins in DCM vs donor and those in PPCM vs donor. Bottom right, Venn diagram showing the overlap in downregulated DE proteins in DCM vs donor and those in PPCM vs donor. C, Kyoto Encyclopedia of Genes and Genomes (KEGG) pathways significantly enriched in DCM compared with donors. D, Top, Venn diagram showing the overlap in significantly enriched KEGG pathways in DCM vs donor and those in PPCM vs donor. Bottom left, Venn diagram showing the overlap in significantly upregulated KEGG pathways in DCM vs donor and those in PPCM vs donor. Bottom right, Venn diagram showing the overlap in significantly downregulated KEGG pathways in DCM vs donor and those in PPCM vs donor. E, Plot of protein log2 FCs between DCM and donor (x axis) against those of PPCM vs donor (y axis). F, Summary of DE proteins comparing PPCM vs DCM. G, Volcano plot for differential analysis in proteins comparing PPCM and DCM. Estimates are derived using a linear regression model adjusted for log2-transformed age with nPPCM=6 and nDCM=6. The direction of regulation is in reference to DCM; that is, upregulated proteins are higher expressed in DCM than in PPCM. H, Boxplots of SBSPON (somatomedin B and thrombospondin type 1 domain-containing protein precursor; left) and TNS3 (tensin 3; right) log2-intensities in DCM and PPCM samples. AEBP1 indicates AE binding protein 1; APOA4, apolipoprotein A-IV; ASPN, asporin; BH, Benjamini-Hochberg; CA3, carbonic anhydrase 3; C4A, complement C4A (Rodgers Blood Group); cGMP-PKG, cGMP−protein kinase G; FC, fold change; FMOD, fibromodulin; IGHA2, immunoglobulin heavy constant alpha 2; JAK-STAT, Janus kinase−signal transducer and activator of transcription; LTBP2, latent transforming growth factor beta-binding protein 2; MAPK, mitogen-activated protein kinase; PI3K-Akt, phosphoinositide 3-kinase−protein kinase B; PI16, peptidase inhibitor 16; and POSTN, periostin.
Figure 4.
Figure 4.
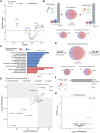
Differential analysis in metabolite abundance level between peripartum cardiomyopathy (PPCM) and donor samples. A, Multidimensional scaling (MDS) plot of metabolomics data. B, Summary of differentially abundant (DA) metabolites comparing PPCM vs donor. Estimates are derived using a linear regression model adjusted for log2-transformed age with nDonor=7 and nPPCM=7. The direction of regulation is in reference to the donor; that is, upregulated metabolites are more abundant in PPCM than in donor samples. C, Volcano plot for differential analysis in metabolites comparing PPCM vs donor. D, Heatmap with dendrograms of DA metabolites in PPCM vs donor. Metabolite intensities are centered on their sample medians. Samples are annotated by their condition groups. Metabolites are annotated by the direction of differential abundance. E, Kyoto Encyclopedia of Genes and Genomes pathways significantly enriched in PPCM compared with donor. ABC indicates ATP-binding cassette; BH, Benjamini-Hochberg; FC, fold change; and mTOR, mammalian target of rapamycin.
Figure 5.
Figure 5.
Differentially abundant (DA) metabolites in dilated cardiomyopathy (DCM) vs donor compared with those of peripartum cardiomyopathy (PPCM) vs donor. A, Volcano plot for differential analysis in metabolites comparing DCM vs donor. Estimates are derived using a linear regression model adjusted for log2-transformed age with nDonor=7 and nDCM=5. The direction of regulation is in reference to the donor; that is, upregulated metabolites are higher expressed in DCM than donor. B, Left, Summary of DA metabolites comparing DCM vs donor. Right, Summary of DA metabolites comparing PPCM vs donor (also as Figure 4B). Middle, Venn diagram showing the overlap in DA metabolites in DCM vs donor and those in PPCM vs donor. Bottom left, Venn diagram showing the overlap in upregulated DA metabolites in DCM vs donor and those in PPCM vs donor. Bottom right, Venn diagram showing the overlap in downregulated DA metabolites in DCM vs donor and those in PPCM vs donor. C, Kyoto Encyclopedia of Genes and Genomes (KEGG) pathways significantly enriched in DCM compared with donors. D, Top, Venn diagram showing the overlap in significantly enriched KEGG pathways in DCM vs donor and those in PPCM vs donor. Bottom left, Venn diagram showing the overlap in significantly upregulated KEGG pathways in DCM vs donor and those in PPCM vs donor. Bottom right, Venn diagram showing the overlap in significantly downregulated KEGG pathways in DCM vs donor and those in PPCM vs donor. E, Plot of metabolite log2 FCs between DCM and donor (x axis) against those of PPCM vs donor (y axis). F, Summary of DA metabolites comparing PPCM vs DCM. G, Volcano plot for differential analysis in metabolites comparing PPCM and DCM. Estimates are derived using a linear regression model adjusted for log2-transformed age with nPPCM=7 and nDCM=5. ABC indicates ATP-binding cassette; BH, Benjamini-Hochberg; FC, fold change; mTOR, mammalian target of rapamycin; and TCA, tricarboxylic acid.
Figure 6.
Figure 6.
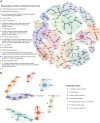
Protein coexpression and metabolite coabundance networks in peripartum cardiomyopathy (PPCM) samples. A, Coexpression network among PPCM samples in the top 200 differentially expressed (DE) proteins ranked by Benjamini-Hochberg (BH)-adjusted P values between PPCM and donor. B, Coabundance network among PPCM samples in DA metabolites between PPCM and donor. BCAA indicates valine/branched-chain amino acid synthesis; NAD, nicotinamide adenine dinucleotide; NOS, nitric oxide synthase; and TCA, tricarboxylic acid.

References

    1. Chung E, Leinwand LA. Pregnancy as a cardiac stress model. Cardiovasc Res. 2014;101:561–570. doi: 10.1093/cvr/cvu013 - PMC - PubMed
    1. de Haas S, Spaanderman MEA, van Kuijk SMJ, van Drongelen J, Mohseni Z, Jorissen L, Ghossein-Doha C. Adaptation of left ventricular diastolic function to pregnancy: a systematic review and meta-analysis. J Hypertens. 2021;39:1934–1941. doi: 10.1097/HJH.0000000000002886 - PMC - PubMed
    1. Ferreira AF, Azevedo MJ, Proenca T, Saraiva FA, Machado AP, Sousa C, Sampaio Maia B, Leite-Moreira A, Ramalho C, Fa I. Cardiac remodelling and reverse remodelling in pregnant women: what can be expected? Eur Heart J. 2021;42:ehab724.2904. doi: 10.1093/eurheartj/ehab724.2904
    1. Sliwa K, Bauersachs J, Arany Z, Spracklen TF, Hilfiker-Kleiner D. Peripartum cardiomyopathy: from genetics to management. Eur Heart J. 2021;42:3094–3102. doi: 10.1093/eurheartj/ehab458 - PubMed
    1. Goli R, Li J, Brandimarto J, Levine LD, Riis V, McAfee Q, DePalma S, Haghighi A, Seidman JG, Seidman CE, et al. ; IMAC-2 and IPAC Investigators. Genetic and phenotypic landscape of peripartum cardiomyopathy. Circulation. 2021;143:1852–1862. doi: 10.1161/CIRCULATIONAHA.120.052395 - PMC - PubMed

MeSH terms

LinkOut - more resources