Clinical Trial
. 2024 Nov 8;9(21):e169927.
doi: 10.1172/jci.insight.169927.

Inhibition of Bruton's tyrosine kinase with PD-1 blockade modulates T cell activation in solid tumors

Affiliations
Clinical Trial

Inhibition of Bruton's tyrosine kinase with PD-1 blockade modulates T cell activation in solid tumors

Emily Schwarz et al. JCI Insight. .

Abstract

BACKGROUNDInhibition of Bruton's tyrosine kinase with ibrutinib blocks the function of myeloid-derived suppressor cells (MDSC). The combination of ibrutinib and nivolumab was tested in patients with metastatic solid tumors.METHODSSixteen patients received ibrutinib 420 mg p.o. daily with nivolumab 240 mg i.v. on days 1 and 15 of a 28-day cycle. The effect of ibrutinib and nivolumab on MDSC, the immune profile, and cytokine levels were measured. Single-cell RNA-Seq and T cell receptor sequencing of immune cells was performed.RESULTSCommon adverse events were fatigue and anorexia. Four patients had partial responses and 4 had stable disease at 3 months (average 6.5 months, range 3.5-14.6). Median overall survival (OS) was 10.8 months. Seven days of Bruton's tyrosine kinase (BTK) inhibition significantly increased the proportion of monocytic-MDSC (M-MDSC) and significantly decreased chemokines associated with MDSC recruitment and accumulation (CCL2, CCL3, CCL4, CCL13). Single-cell RNA-Seq revealed ibrutinib-induced downregulation of genes associated with MDSC-suppressive function (TIMP1, CXCL8, VEGFA, HIF1A), reduced MDSC interactions with exhausted CD8+ T cells, and decreased TCR repertoire diversity. The addition of nivolumab significantly increased circulating NK and CD8+ T cells and increased CD8+ T cell proliferation. Exploratory analyses suggest that MDSC and T cell gene expression and TCR repertoire diversity were differentially affected by BTK inhibition according to patient response.CONCLUSIONIbrutinib and nivolumab were well tolerated and affected MDSC and T cell function in patients with solid metastatic tumors.TRIAL REGISTRATIONClinicalTrials.gov NCT03525925.FUNDINGNIH; National Cancer Institute Cancer; National Center for Advancing Translational Sciences; Pelotonia.

Keywords: Cancer immunotherapy; Cellular immune response; Clinical trials; Immunology; T cells.


Conflict of interest statement

Conflict of interest: The authors have declared that no conflict of interest exists.

Figures

Figure 1
Figure 1. CONSORT diagram.
Sixteen patients with metastatic solid tumors were enrolled in the pilot phase I study. All patients were allocated to the same treatment intervention (ibrutinib 420 mg p.o. daily with nivolumab 240 mg i.v. on days 1 and 15 of a 28-day cycle).
Figure 2
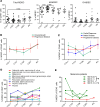
Figure 2. Levels of circulating myeloid-derived suppressor cells.
(A) Circulating levels of total (CD11b+, CD33+, HLA-DRlo/–), monocytic (CD14+) or granulocytic (CD66b+) MDSC were measured by mass cytometry at cycle 1 day –7 (baseline), after 1 week of ibrutinib (cycle 1 day 1), cycle 1 day 8, cycle 2 day 1, and at disease progression (PD) (n = 16). Data represent mean ± SEM and were analyzed by paired Student’s t test. The P values were adjusted for multiple comparisons using Holm-Bonferroni method. (B and C) MDSC levels by best response for patients with clinical benefit (partial response and stable disease, n = 8) versus progressive disease (n = 8) (B) and patients with partial response (n = 4) versus stable disease (n = 4) versus progressive disease (n = 8) (C). Data represent mean ± SEM and were analyzed using Student’s t test (unpaired) in B and ANOVA in C. The P values were adjusted for multiple comparisons using Holm-Bonferroni. (D) Average MDSC levels by tumor type. (E) MDSC levels from patients with melanoma (n = 4).
Figure 3
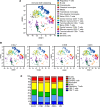
Figure 3. Overall immune cell profile in patients with metastatic solid cancer following treatment with ibrutinib and nivolumab.
Mass cytometry analysis of patient PBMC at baseline (C1D–7), following treatment with single-agent ibrutinib (C1D1) or ibrutinib in combination with nivolumab (C1D8, C2D1) and at the time of disease progression (PD) in 16 patients with metastatic solid tumors. (A) Representative t-SNE plot of immune cells clustered in an unbiased manner from live/CD45+ cells. (B) Representative t-SNE plots of immune cell population clustering from 1 patient with metastatic solid disease over the course of the study. (C) Bar graph of mean immune cell populations in patients with metastatic solid tumors (n = 16) over the duration of the study.
Figure 4
Figure 4. Circulating levels of chemokines and cytokines associated with MDSC migration and recruitment.
Plasma levels of 20 cytokines and chemokines were measured at the indicated times and at progression of disease (PD) using a custom U-PLEX Human Cytokine Panel 20-plex Assay. The assay was performed in duplicate, and analyte levels were measured for all patients (n = 16) and displayed as mean ± SEM. (A) Levels of CCL2, CCL3, CCL4, and CCL13. (B) Levels of IL-12/23p40 and IL-1β. Data are analyzed by Student’s t test (paired), and P values are adjusted for multiple comparisons within each biomarker using Holm-Bonferroni method. *P < 0.05, **P < 0.01, ***P < 0.001.
Figure 5
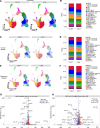
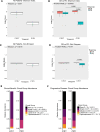
Figure 5. Single-cell RNA-Seq of patient immune cells after ibrutinib treatment and MDSC-specific gene changes.
Peripheral blood mononuclear cell (PBMC) samples (2 paired samples from 14 patients plus individual samples from 2 patients, n = 30) at baseline (C1D–7) and following single-agent ibrutinib treatment (C1D1) were analyzed by scRNA-Seq. PBMC samples were aggregated and clustered into immune populations based on gene expression and visualized using UMAP. (A) UMAP showing clusters from all patients combined at C1D–7 (left) and C1D1 (right). (B) The ratio of each cell type present at each time point. (C) Combined UMAP from patients with clinical benefit (CB) (partial response or stable disease) who had 2 paired samples (n = 6) at C1D–7 (left) and C1D1 (right). (D) The ratio of each cell type present at each time point. (E) Combined UMAP plot from patients with 2 paired samples who had disease progression (PD, n = 8) at C1D–7 (left) and C1D1 (right). (F) The ratio of each cell type present at each time point. (G) Volcano plot of top differentially expressed genes in MDSC from all patients after ibrutinib treatment. Genes downregulated in MDSC at C1D1 relative to C1D–7 are represented in blue, and genes upregulated in MDSC at C1D1 relative to C1D–7 are represented in red. (H) Volcano plot of top differentially expressed genes in C1D1 MDSC from patients with CB versus patients with PD. Genes downregulated in MDSC from patients with CB relative to MDSC from patients with PD at C1D1 are represented in blue, and genes upregulated in MDSC from patients with CB relative to PD are represented in red (x axis = log2 fold change/y axis = –log10[adjusted P value]). cDC, conventional dendritic cell; pDC, plasmacytoid DC; HSPC, hematopoietic stem cells.
Figure 6
Figure 6. Analysis of changes in MDSC interactions and signaling networks after BTK inhibition.
(A) Circle plot generated using CellChat analysis of single-cell RNA-Seq data depicting the inferred cell–cell communication networks between MDSC, T cells, and NK cells in all patients from C1D–7 and C1D1 combined (n = 16). Circle sizes are proportional to the number of cells in each group, and the weight of the arrows is proportional to the number of ligands-receptor pairs. (B) Significant ligand-receptor pairs between MDSC, T cells, and NK cells in all patients at C1D–7 and C1D1. Circle sizes are representative of P values, and the probability of communication is represented by color (minimal communication in blue, maximum communication in red). (C) Circle plot for patients with clinical benefit (partial response or stable disease, n = 6). (D) Circle plot for patients with progressive disease (n = 8). (E) Significant ligand-receptor pairs between MDSC, T cells, and NK cells in patients with clinical benefit at C1D–7 and C1D1. (F) Significant ligand-receptor pairs between MDSC, T cells, and NK cells in patients with progressive disease at C1D–7 and C1D1. Differential expression (DE) analyses were performed using the Wilcoxon rank-sum test. All P values were adjusted for multiple comparisons using a Bonferroni correction.
Figure 7
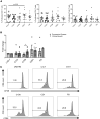
Figure 7. Ibrutinib in combination with nivolumab increases T cell proliferation.
Patient PBMCs were activated with anti-CD3/CD28 beads and labeled with CFSE. After 3 days, cells were collected and stained with anti-CD8 and anti-CD4 antibodies; proliferation was assessed by flow cytometry. (A) Quantification of CD8+, CD4+, and total T cell proliferation from 16 patients. Data represent mean ± SEM. Student’s t test (paired) was used, and P values were adjusted for multiple comparisons using Holm-Bonferroni method. (B) T cell proliferation in patients that experienced clinical benefit (partial response and stable disease, n = 8) or progressive disease (n = 8) analyzed by Student’s t tests (unpaired). (C) Representative histograms of CD8+ T cell proliferation in 1 patient. *P < 0.05.
Figure 8
Figure 8. TCR repertoire diversity changes after ibrutinib treatment.
The TCR-α and TCR-β CDR3 regions of 16 patients were amplified and sequenced using the 10X Genomics single cell immune profiling kit before (C1D–7) and after single-agent ibrutinib treatment (C1D1). (A and B) Shannon Diversity Index scores at C1D–7 and C1D1 in all patients (n = 16) (A) and patients with clinical benefit (CB, n = 6) or progressive disease (PD, n = 8) (B). (C and D) Gini-Simpson index scores in all patients (C) and patients with CB or PD (D). (E and F) Distribution of clonal type groups shown as relative abundance of rare, small, medium, large, and hyperexpanded clonal groups at C1D–7 and C1D1 in patients with CB (E) and patients with PD (F). The statistical significance of differences between response groups and/or time points was evaluated using the Wilcoxon rank-sum test for 2-group comparisons and the Kruskal-Wallis test for comparison of more than 2 groups. P values were adjusted for multiple testing using the Bonferroni procedure when multiple pairs were simultaneously evaluated. Boxes in the box-and-whisker plot represent the 25th and 75th percentiles, and the lines inside the boxes represent the median. Whiskers extend to the minimum and maximum values, and dots outside the whiskers represent outliers.

References

    1. Robert C. A decade of immune-checkpoint inhibitors in cancer therapy. Nat Commun. 2020;11(1):3801. doi: 10.1038/s41467-020-17670-y. - DOI - PMC - PubMed
    1. Stiff A, et al. Myeloid-derived suppressor cells express Bruton’s tyrosine kinase and can be depleted in tumor-bearing hosts by ibrutinib treatment. Cancer Res. 2016;76(8):2125–2136. doi: 10.1158/0008-5472.CAN-15-1490. - DOI - PMC - PubMed
    1. Gabrilovich DI, Nagaraj S. Myeloid-derived suppressor cells as regulators of the immune system. Nat Rev Immunol. 2009;9(3):162–174. doi: 10.1038/nri2506. - DOI - PMC - PubMed
    1. Jordan KR, et al. Myeloid-derived suppressor cells are associated with disease progression and decreased overall survival in advanced-stage melanoma patients. Cancer Immunol Immunother. 2013;62(11):1711–1722. doi: 10.1007/s00262-013-1475-x. - DOI - PMC - PubMed
    1. Markowitz J, et al. Patients with pancreatic adenocarcinoma exhibit elevated levels of myeloid-derived suppressor cells upon progression of disease. Cancer Immunol Immunother. 2015;64(2):149–159. doi: 10.1007/s00262-014-1618-8. - DOI - PMC - PubMed

Publication types

MeSH terms

Associated data