. 2024 Nov 8;9(21):e181330.
doi: 10.1172/jci.insight.181330.

Thrombopoietin mimetic reduces mouse lung inflammation and fibrosis after radiation by attenuating activated endothelial phenotypes

Affiliations

Thrombopoietin mimetic reduces mouse lung inflammation and fibrosis after radiation by attenuating activated endothelial phenotypes

Jeb English et al. JCI Insight. .

Abstract

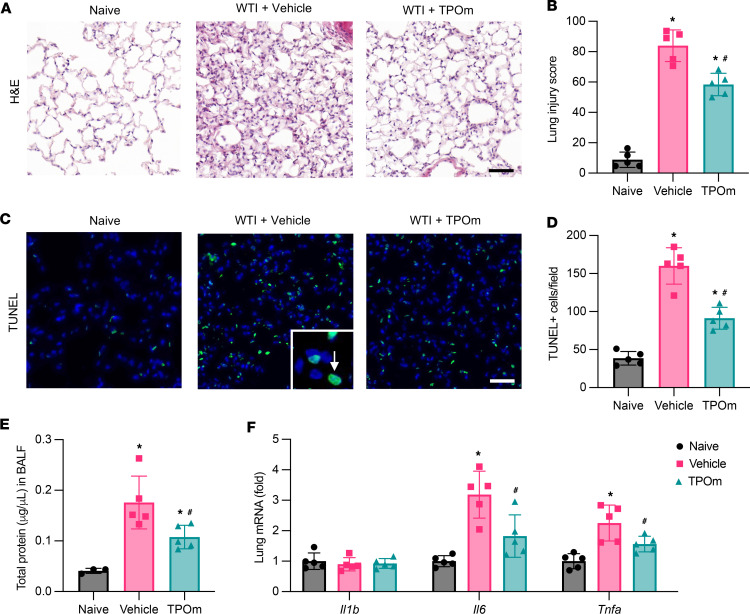
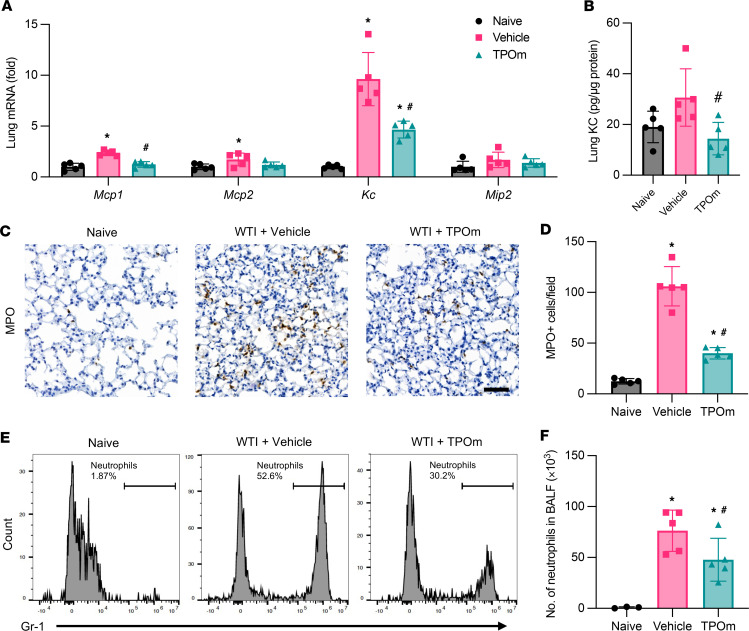
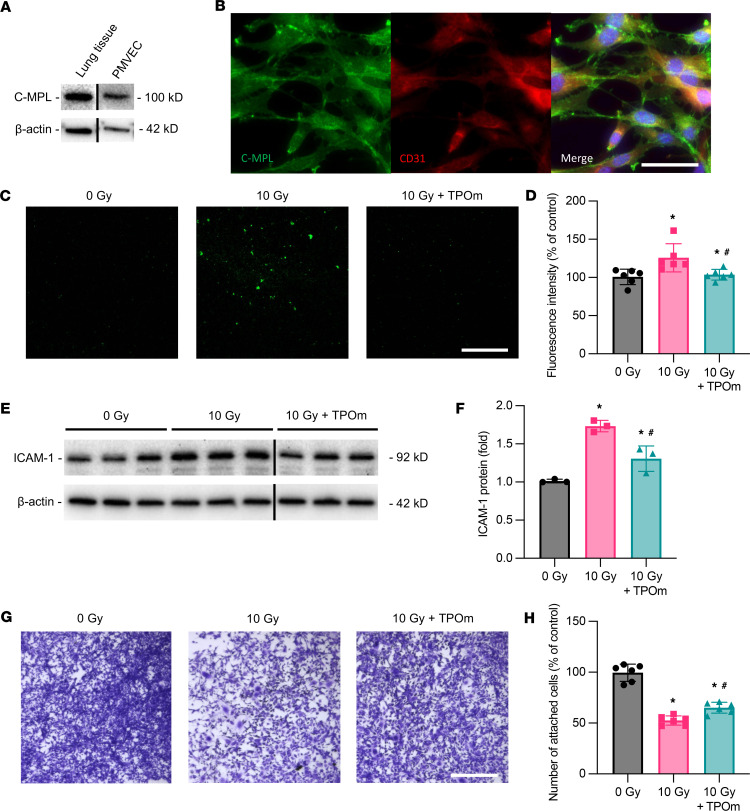
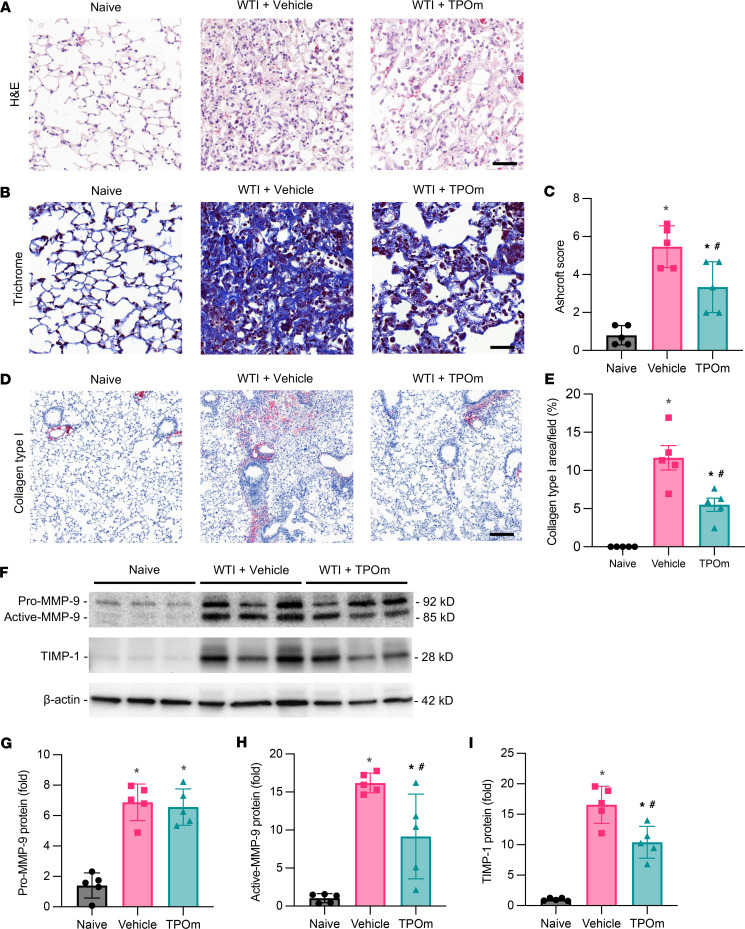
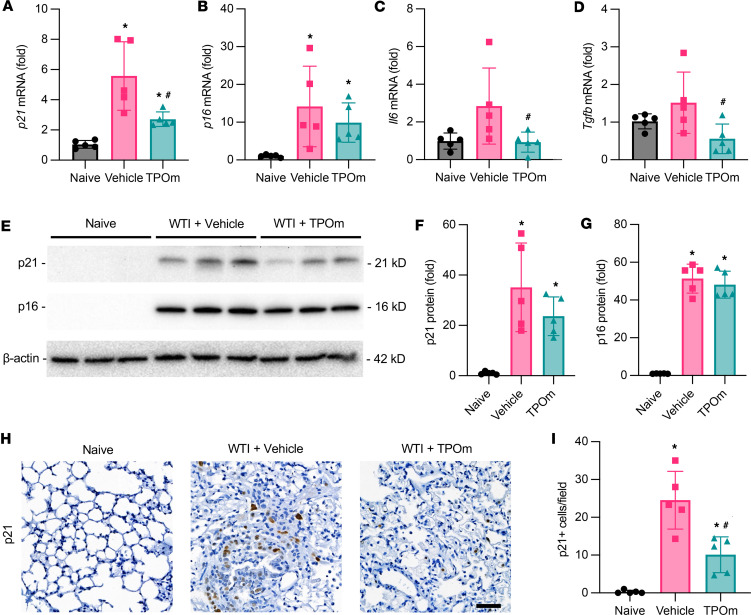
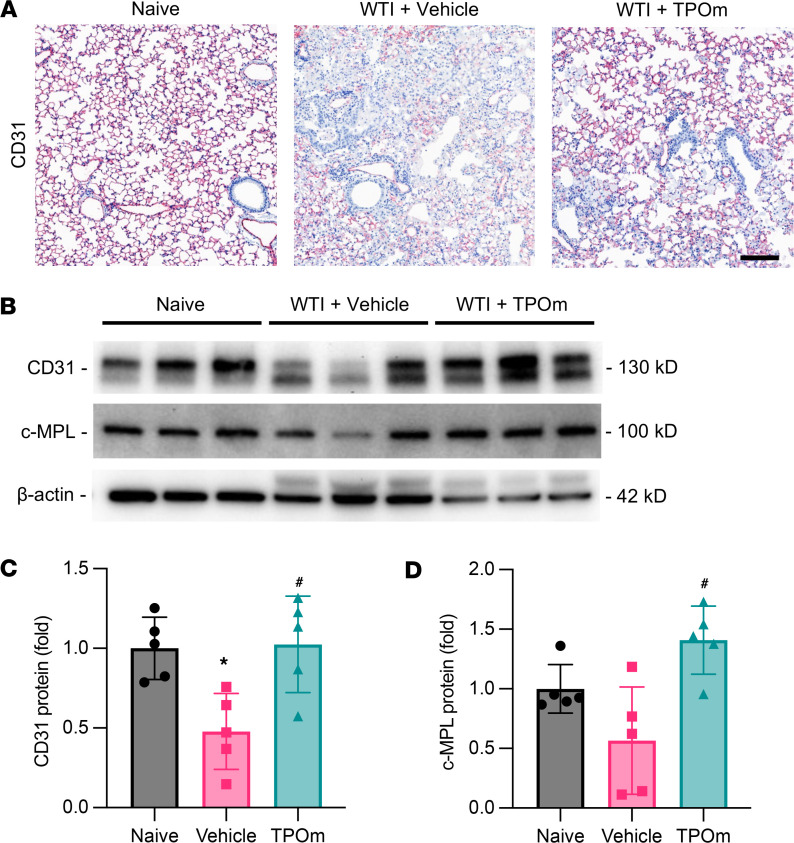
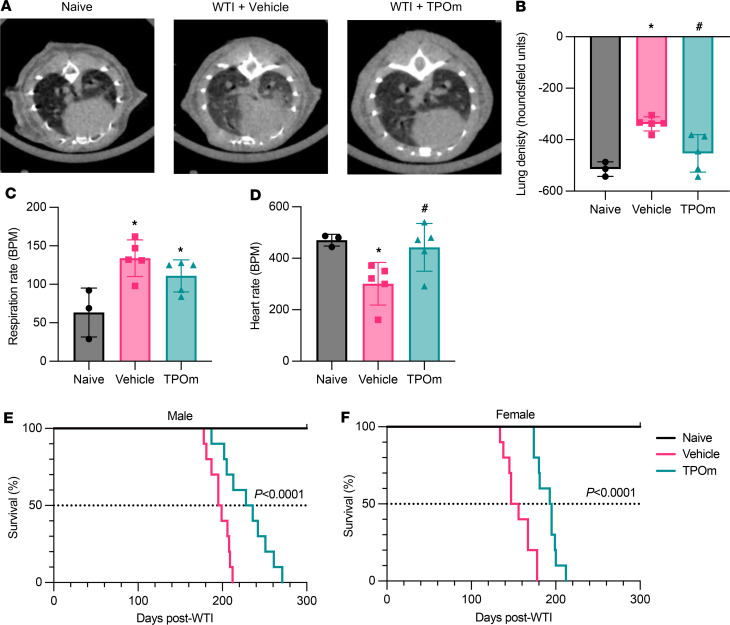
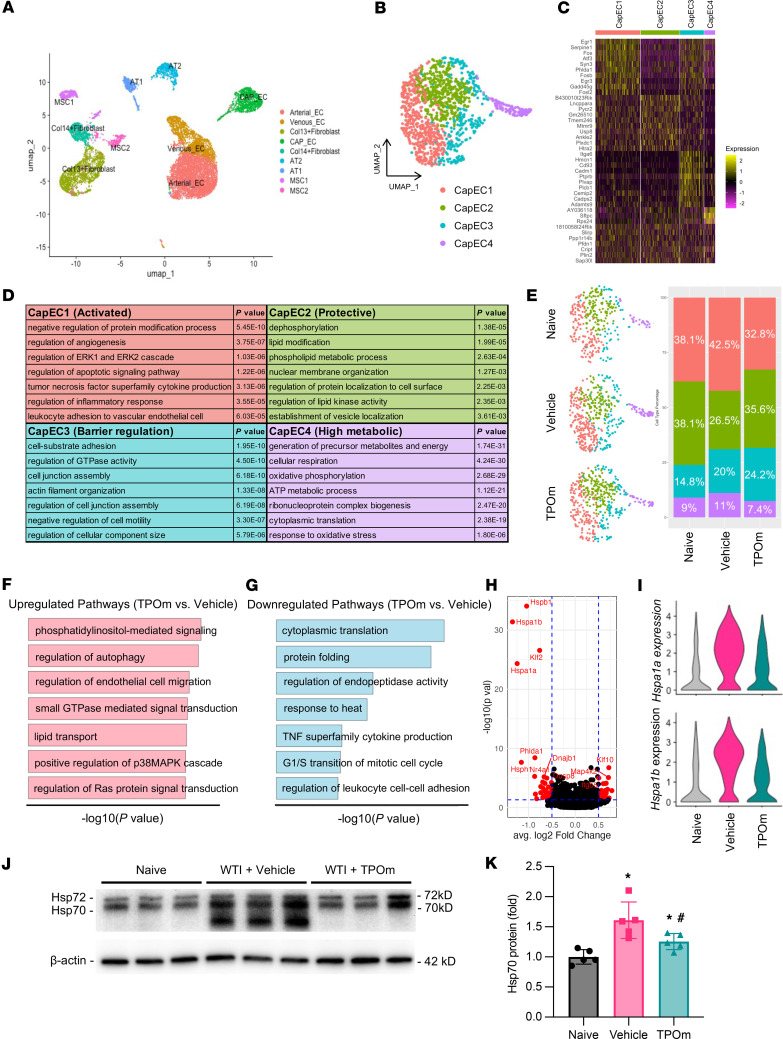
Radiation-induced lung injury (RILI) initiates radiation pneumonitis and progresses to fibrosis as the main side effect experienced by patients with lung cancer treated with radiotherapy. There is no effective drug for RILI. Sustained vascular activation is a major contributor to the establishment of chronic disease. Here, using a whole thoracic irradiation (WTI) mouse model, we investigated the mechanisms and effectiveness of thrombopoietin mimetic (TPOm) for preventing RILI. We demonstrated that administering TPOm 24 hours before irradiation decreased histologic lung injury score, apoptosis, vascular permeability, expression of proinflammatory cytokines, and neutrophil infiltration in the lungs of mice 2 weeks after WTI. We described the expression of c-MPL, a TPO receptor, in mouse primary pulmonary microvascular endothelial cells, showing that TPOm reduced endothelial cell-neutrophil adhesion by inhibiting ICAM-1 expression. Seven months after WTI, TPOm-treated lung exhibited less collagen deposition and expression of MMP-9, TIMP-1, IL-6, TGF-β, and p21. Moreover, TPOm improved lung vascular structure, lung density, and respiration rate, leading to a prolonged survival time after WTI. Single-cell RNA sequencing analysis of lungs 2 weeks after WTI revealed that TPOm shifted populations of capillary endothelial cells toward a less activated and more homeostatic phenotype. Taken together, TPOm is protective for RILI by inhibiting endothelial cell activation.

Keywords: Endothelial cells; Fibrosis; Pulmonology; Radiation therapy; Therapeutics.


Conflict of interest statement

Conflict of interest: GE is a former employee of Johnson & Johnson. CG has received research grants from Johnson & Johnson for conducting research on TPOm. CG and GE are cofounders of a biotechnology start-up, Bioconvergent Health. GE, CG, JE, and WLY have filed a provisional patent (WO2023225628A3, “Methods for mitigating lung injury in conjunction with exposure to radiation and/or radiation or radiomimetic treatments”) with the World Intellectual Property Organization.

Figures

Figure 1
Figure 1. Effect of TPOm on radiation-induced lung damage, alveolar permeability, and inflammation in the mice 2 weeks after WTI.
C57BL/6J mice were treated with PBS (Vehicle) or TPOm 24 hours before 16 Gy WTI. The lungs of naive and WTI mice were harvested 2 weeks after WTI. (A) Representative H&E staining of lung. Scale bar: 50 μm. (B) Histologic lung injury score judged by the H&E staining. (C) Representative TUNEL staining (green) in lung. Counterstained with DAPI (blue). Scale bar: 50 μm. The white arrow indicates TUNEL+ nucleus. (D) Quantification of TUNEL+ cells per field averaged over 5 microscopic fields/animal in each group. (E) Quantification of protein concentration in BALF. (F) Cytokine mRNA expression of Il1b, Il6, and Tnfa in lung, as determined by qPCR. The results of qPCR analysis are normalized with Hprt1 as an internal control and are expressed as fold change compared with the naive group. Data are shown as mean ± SEM (n = 5/group). *P < 0.05 vs. naive and #P < 0.05 vs. vehicle. Data were analyzed using nonparametric methods, using a 1-way ANOVA with Tukey’s test as post hoc comparison.
Figure 2
Figure 2. Effect of TPOm on radiation-induced neutrophil infiltration in the lungs of mice 2 weeks after WTI.
C57BL/6J mice were treated with PBS (Vehicle) or TPOm 24 hours before 16 Gy WTI. The lungs of naive and WTI mice were harvested 2 weeks after WTI. (A) Chemokine mRNA expression of Mcp1, Mcp2, Kc, and Mip2 in lung, as determined by qPCR. The results of qPCR analysis are normalized with Hprt1 as an internal control and are expressed as fold change compared with the naive group. (B) Protein levels of KC in lung tissue lysate measured by ELISA. (C) Representative immunohistochemistry staining of MPO (brown) in lung. Counterstained with hematoxylin. Scale bar: 50 μm. (D) Quantification of MPO+ cell infiltrate in lung per field, averaged over 5 microscopic fields/animal in each group. (E) Representative flow cytometry contour plots of live/CD45+/Gr-1+ cells in BALF. (F) Quantification of total neutrophil number in BALF. Data are shown as mean ± SEM (n = 5/group). *P < 0.05 vs. naive and #P < 0.05 vs. vehicle. Data were analyzed using nonparametric methods, using a 1-way ANOVA with Tukey’s test as post hoc comparison.
Figure 3
Figure 3. Effect of TPOm on neutrophil adherence and activation of irradiated mouse PMVECs.
Mouse primary PMVECs were isolated from C57B/6J mouse and cultured. (A) Western blot analysis of c-MPL expression in lung tissue and PMVECs. β-Actin was used as loading control. (B) Immunofluorescence staining of c-MPL (green) and CD31 (red) in PMVECs. Counterstained with DAPI (blue). Scale bar: 40 μm. (C) Representative images of fluorescently labeled mouse neutrophils (green) coincubated on non- and irradiated PMVECs for 30 minutes and then washed with PBS. PMVECs were pretreated with PBS or TPOm 2 hours before irradiating at 10 Gy and then cultured for another 48 hours before adhesion assay. Adherent neutrophils were imaged by fluorescent microscopy. Scale bar: 100 μm. (D) Averaged fluorescence intensity of each group measured at an excitation and emission of 488/515 nm. The intensity of 0 Gy control is designated as 100% for comparison (n = 6/group). (E) Western blot images of ICAM-1 expression in mouse PMVECs from 0 Gy control and irradiated PMVECs at 10 Gy 48 hours after IR. The irradiated PMVECs were pretreated with PBS and TPOm 2 hours before IR. β-Actin was used as loading control. (F) Quantification of relative ICAM-1 protein levels compared with 0 Gy control set as 1 (n = 3/group). (G) Representative images of crystal violet staining of PMVECs from 0 Gy control and irradiated PMVECs at 10 Gy 24 hours after IR. The irradiated PMVECs were pretreated with PBS and TPOm 2 hours before IR. Scale bar: 100 μm. (H) Quantification of crystal violet staining after elution with methanol, followed by reading at 570 nm on a microplate reader. The OD reading of the 0 Gy control is designated as 100% for comparison (n = 6/group). Data are shown as mean ± SD. *P < 0.05 vs. 0 Gy and #P < 0.05 vs. 10 Gy. Data were analyzed using nonparametric methods, using a 1-way ANOVA with Tukey’s test as post hoc comparison.
Figure 4
Figure 4. Effect of TPOm on radiation-induced fibrosis in the lungs of mice 7 months after WTI.
C57BL/6J mice were treated with PBS (Vehicle) or TPOm 24 hours before 16 Gy WTI. The lungs of naive and WTI mice were harvested 7 months after WTI. (A) Representative H&E staining of lung. Scale bar: 50 μm. (B) Representative Masson’s trichrome blue staining of lung. Scale bar: 50 μm. (C) Aschroft score of Masson’s trichrome–stained sections. (D) Representative immunohistochemistry staining of collagen type I (red) of lung. Counterstained with hematoxylin. Scale bar: 125 μm. (E) Quantification of alveolar collagen type I immunohistochemistry. Reported as percentage of positive stained area per field averaged over 5 microscopic fields/animal in each group. (F) Representative Western blot images of precursor of MMP-9 (pro–MMP-9), active MMP-9, and TIMP-1 expression in lung. β-Actin was used as loading control. (GI) Quantification of relative (G) pro–MMP-9, (H) active MMP-9, and (I) TIMP-1 protein levels compared with naive control set as 1. Data are shown as mean ± SEM (n = 5/group). *P < 0.05 vs. naive and #P < 0.05 vs. vehicle. Data were analyzed using nonparametric methods, using a 1-way ANOVA with Tukey’s test as post hoc comparison.
Figure 5
Figure 5. Effect of TPOm on radiation-induced senescence in the lungs of the mice 7 months after WTI.
C57BL/6J mice were treated with PBS (Vehicle) or TPOm 24 hours before 16 Gy WTI. The lungs of naive and WTI mice were harvested 7 months after WTI. (AD) The total RNA from lung tissue was isolated to analyze the mRNA levels of (A) p21, (B) p16, (C) Il6, and (D) Tgfb as determined by RT-qPCR. The results of qPCR analysis are normalized with Hprt1 as an internal control and are expressed as fold change compared with the naive group. (E) Representative Western blot image of p21 and p16 of lung. β-Actin was used as loading control. (F and G) Quantification of relative (F) p21 and (G) p16 protein levels compared with naive control set as 1. (H) Representative immunohistochemistry staining of p21 (brown) in lung. Counterstained with hematoxylin. Scale bar: 50 μm. (I) Quantification of p21+ cells in lung per field averaged over 5 microscopic fields/animal in each group. Data are shown as mean ± SEM (n = 5/group). *P < 0.05 vs. Naive and #P < 0.05 vs. Vehicle. Data were analyzed using nonparametric methods, using a 1-way ANOVA with Tukey’s test as post hoc comparison.
Figure 6
Figure 6. Effect of TPOm on radiation-induced changes in vascularity of the lungs of mice 7 months after WTI.
C57BL/6J mice were treated with PBS (Vehicle) or TPOm 24 hours before 16 Gy WTI. The lungs of naive and WTI mice were harvested 7 months after WTI. (A) Representative immunohistochemistry staining of CD31 (magenta) in lung. Counterstained with hematoxylin. Scale bar: 125 μm. (B) Representative Western blot images of CD31 and c-MPL. β-Actin was used as loading control. (C and D) Quantification of relative (C) CD31 and (D) c-MPL protein levels compared with naive control set as 1. Data are shown as mean ± SEM (n = 5 per group). *P < 0.05 vs. naive and #P < 0.05 vs. vehicle. Data were analyzed using nonparametric methods, using a 1-way ANOVA with Tukey’s test as post hoc comparison.
Figure 7
Figure 7. Effect of TPOm on lung-cardiac function of the mice 7 months after WTI and their survival after WTI.
(AD) C57BL/6J mice were treated with PBS (Vehicle) or TPOm 24 hours before 16 Gy WTI. The naive and WTI mice were scanned 7 months after WTI. (A) Representative μCT thoracic cross sections. (B) Quantification of radiodensity of 3D contoured μCT lung images. (C) Respiration rate of each mouse reported as breaths per minute (BPM). (D) Heart rate of each mouse reported as beats per minute (BPM). Data are shown as mean ± SEM (n = 3–5/group). *P < 0.05 vs. naive and #P < 0.05 vs. vehicle. (E and F) C57BL/6J mice were treated with PBS or TPOm 24 hours before 18 Gy WTI. The survival time of (E) male and (F) female mice after WTI with Kaplan-Meier plot. The reported P value is from log rank comparing survival curves between vehicle and TPOm. μCT, breath rate, and heart rate data were analyzed using nonparametric methods, using a 1-way ANOVA with Tukey’s test as post hoc comparison. Survival data were analyzed using Kaplan-Meier analysis.
Figure 8
Figure 8. Effect of TPOm on radiation-induced phenotypic changes of capillary endothelial cells in lungs of mice 2 weeks after WTI.
C57BL/6J mice were treated with PBS (Vehicle) or TPOm 24 hours before 16 Gy WTI. Lungs of naive and WTI mice were harvested 2 weeks after WTI, and nonhematopoietic lung cells (CD45-) were isolated for scRNA-Seq analysis. (A) 2D UMAP projection of 12,238 individual lung cells isolated across treatment groups. Arterial_EC, arterial EC; Venous_EC, venous EC; Col13+Fibroblast collagen type 13+ fibroblasts; CAP_EC, capillary EC; Col14+Fibroblast, collagen type 14+ fibroblasts; AT2, alveolar type 2 cells; AT1, alveolar type 1 cells; MSC1, mesenchymal stromal cells 1; MSC2, mesenchymal stromal cells 2. (B) 2D UMAP projection of 1,287 lung capillary ECs (CapECs). Different colors denote different clusters: CapEC1, CapEC2, CapEC3, and CapEC4. (C) Heatmap of the most differentially expressed genes in each CapEC cluster. Color bars represent gene expression in log2 scale. (D) Enriched biological processes based on Gene Ontology analysis and enriched genes found in each cluster. P values are indicated to the right of each enriched term found in that particular cluster. (E) 2D UMAP projection of CapECs split among naive, vehicle-, and TPOm-treated lung cells. Each cluster’s distribution by percentage is iterated by treatment condition. (F and G) Biological process (F) upregulated and (G) downregulated in TPOm vs. vehicle. Length of bar coordinates with –log10 P value. (H) Volcano plot of differentially expressed genes of TPOm-treated vs. vehicle-treated cells. (I) Violin plots of Hspa1a and Hspa1b across each treatment condition. (J) Representative Western blot images of Hsp70 and Hsp72 in lung. β-Actin was used as loading control. (K) Quantification of relative Hsp70 protein levels compared with naive control set as 1. Data are shown as mean ± SEM (n = 5/group). *P < 0.05 vs. naive and #P < 0.05 vs. vehicle. Data were analyzed using nonparametric methods, using a 1-way ANOVA with Tukey’s test as post hoc comparison. Statistical test of differential expression in scRNA-Seq analysis was completed using MAST.

Similar articles

Cited by

References

    1. Gutiérrez E, et al. Current evidence for stereotactic body radiotherapy in lung metastases. Curr Oncol. 2021;28(4):2560–2578. doi: 10.3390/curroncol28040233. - DOI - PMC - PubMed
    1. Giuranno L, et al. Radiation-induced lung injury (RILI) Front Oncol. 2019;9:877. doi: 10.3389/fonc.2019.00877. - DOI - PMC - PubMed
    1. Graves PR, et al. Radiation pulmonary toxicity: from mechanisms to management. Semin Radiat Oncol. 2010;20(3):201–207. doi: 10.1016/j.semradonc.2010.01.010. - DOI - PubMed
    1. Ding NH, et al. Molecular mechanisms and treatment of radiation-induced lung fibrosis. Curr Drug Targets. 2013;14(11):1347–1356. doi: 10.2174/13894501113149990198. - DOI - PMC - PubMed
    1. Hanania AN, et al. Radiation-induced lung injury: assessment and management. Chest. 2019;156(1):150–162. doi: 10.1016/j.chest.2019.03.033. - DOI - PMC - PubMed

MeSH terms

Substances