. 2024 Nov 8;9(21):e179982.
doi: 10.1172/jci.insight.179982.

Diversity of the immune microenvironment and response to checkpoint inhibitor immunotherapy in mucosal melanoma

Affiliations

Diversity of the immune microenvironment and response to checkpoint inhibitor immunotherapy in mucosal melanoma

Joris L Vos et al. JCI Insight. .

Abstract

Mucosal melanoma (MucM) is a rare cancer with a poor prognosis and low response rate to immune checkpoint inhibition (ICI) compared with cutaneous melanoma (CM). To explore the immune microenvironment and potential drivers of MucM's relative resistance to ICI drugs, we characterized 101 MucM tumors (43 head and neck [H&N], 31 female urogenital, 13 male urogenital, 11 anorectal, and 3 other gastrointestinal) using bulk RNA-Seq and immunofluorescence. RNA-Seq data show that MucM has a significantly lower IFN-γ signature levels than CM. MucM tumors of the H&N region show a significantly greater abundance of CD8+ T cells, cytotoxic cells, and higher IFN-γ signature levels than MucM from lower body sites. In the subcohort of 35 patients with MucM treated with ICI, hierarchical clustering reveals clusters with a high and low degree of immune infiltration, with a differential ICI response rate. Immune-associated gene sets were enriched in responders. Signatures associated with cancer-associated fibroblasts, macrophages, and TGF-β signaling may be higher in immune-infiltrated, but ICI-unresponsive tumors, suggesting a role for these resistance mechanisms in MucM. Our data show organ region-specific differences in immune infiltration and IFN-γ signature levels in MucM, with H&N MucM displaying the most favorable immune profile. Our study might offer a starting point for developing more personalized treatment strategies for this disease.

Keywords: Cancer immunotherapy; Immunology; Melanoma; Molecular biology; Oncology.


Figures

Figure 1
Figure 1. Relapse-free and overall survival since surgery of all 86 patients with mucosal melanoma treated with surgery.
(A) Kaplan-Meier estimates for RFS since surgery with 95% CIs. (B) Kaplan-Meier estimates for OS since surgery with 95% CIs. RFS, relapse-free survival; OS, overall survival; MucM, mucosal melanoma; H&N, head and neck.
Figure 2
Figure 2. Swimmer plot, progression-free survival, and overall survival of the subcohort of 35 patients with MucM treated with ICB.
(A) Swimmer plot visualizing each patient treated with ICI as an individual bar. All bars begin at the point at which a patient first started ICI therapy and end at the last follow-up date; deaths from any cause are marked with an X. Bar colors indicate primary MucM location. Lines within bars indicate systemic palliative treatments, from the first to the last administered dose. Palliative radiotherapy and surgical interventions are marked with diamonds and triangles, respectively. CR, PR, and PD are marked with the symbols displayed in the legend. Patients with progressive disease in the context of a mixed response (MR) are indicated. The 2 patients with rapid symptomatic PD, in whom no imaging response assessment was performed, are included with the date of clinical progression as PD date. Please note that the x axis is interrupted twice. (B) Kaplan-Meier estimates and 95% CI for PFS since the start of the first ICI therapy for the whole ICI subcohort. (C) OS with 95% CI since the start of ICI therapy for the whole cohort. (D) PFS since the start of ICI, stratified per primary MucM region. P values were calculated using a 2-sided log-rank test. (E) OS since the start of ICI, stratified per primary MucM region. P values were calculated using a 2-sided log-rank test. (F) PFS since the start of ICI, stratified per best objective response. P values were calculated using a 2-sided log-rank test. (G) OS since the start of ICI, stratified per best objective response. The number at risk refers to the total number of patients who have not yet experienced the event of interest or been censored at the specified time points P values were calculated using a 2-sided log-rank test. RT, radiotherapy; PFS, progression-free survival; OS, overall survival; MucM, mucosal melanoma; H&N, head and neck; SN, sinonasal; OC, oral cavity, FUT, female urogenital tract; MUT, male urogenital tract; AR, anorectal; GI, gastrointestinal; CR, complete response; PR, partial response; SD, stable disease; PD, progressive disease; MR, mixed response.
Figure 3
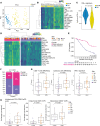
Figure 3. RNA-Seq– and mIF-based characterization of the MucM immune microenvironment across primary sites and compared with CM dataset (21).
(A) PCA of primary MucM (N = 101) and CM (N = 64) samples after computational batch correction. (B) Hierarchical clustering heatmap of CM and MucM samples per the Danaher (30) immune cell signatures. (C) Box-and-violin plots visualizing the presence of the 10-gene IFN-γ RNA signature (23) in batch-corrected MucM vs. CM samples. (D) Heatmap leukocyte gene expression signatures in MucM, with hierarchical clustering divides samples into less-infiltrated (violet) and more-infiltrated (magenta) groups. Samples are further annotated with their primary MucM site of origin. (E) Kaplan-Meier overall survival estimate in all patients treated with surgery (N = 86), stratified by immune cluster identified in D. Exact P values were calculated using a 2-sided log-rank test. (F) Stacked bar plot showing the fraction of lower and H&N region MucM clustering as either more or less infiltrated. The P value was calculated using Fisher’s exact test. (G) Box plots showing the Z-scores of CD8+ T cell, cytotoxic cell, and Ayers’ 10-gene IFN-γ signature across MucM regions. (H) Box plots showing the density of CD3+CD8FoxP3, CD8+, and CD20+ cells located within the tumor parenchyma, assessed through digital analysis of mIF-stained slides. The CD20+ plot’s y axis was log10-transformed. Dot colors in G and H correspond to the MucM site. Box plots in C, G, and H show medians, IQRs, and whiskers up to 1.5 times the IQR. The violin in C displays the probability density of the data. P values in C and G, and H were calculated using a 2-sided Wilcoxon’s rank-sum test. MucM, mucosal melanoma; CM, cutaneous melanoma; H&N, head and neck; SN, sinonasal; OC, oral cavity, FUT, female urogenital tract; MUT, male urogenital tract; AR, anorectal; GI, gastrointestinal; PCA, principal component analysis.
Figure 4
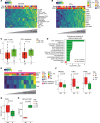
Figure 4. Microenvironmental correlates of response to ICI in mucosal melanoma.
(A) Heatmap of samples’ Danaher leukocyte RNA signatures, ordered by the mean across all signatures (the TIL-score). (B) Heatmap of genes associated with IFN-γ signaling (23), ordered by mean expression the IFN-γ signature. (C) Box plots of Z-scores of CD8+ T cell and IFN-γ signatures per ICI response category (responders, green; nonresponders, red). (D) Enrichment analysis of Hallmark gene sets (32) in responders and nonresponders, ordered by FDR. (E) Heatmap visualizing TIDE signatures (33) associated with CAFs, MDSCs, and TAMs in all patients from the more-infiltrated cluster defined in Figure 3D. Heatmap is organized by the mean across the 3 signatures. (F) Box plots of TIDE signature values in responders vs. nonresponders from the more-infiltrated cluster. (G) Box plots displaying the TGF-β signatures in responders vs. nonresponders from the more-infiltrated cluster. (H) Box plot visualizing the mIF-assessed stromal CD8+ T cell density in responding vs. nonresponding samples from the more-infiltrated cluster. Tracks in A, B, and E annotate sample’s primary site of origin and best objective response, with asterisks indicating tumprs that progressed in the context ofa mixed response. Boxes in C and FH indicate the median and IQR; with whiskers extending up to 1.5 times the IQR. Exact P values in C and FH were calculated using a Wilcoxon’s rank-sum test. Dot colors represent samples’ site of primary MucM origin. H&N, head and neck; SN, sinonasal; OC, oral cavity, FUT, female urogenital tract; MUT, male urogenital tract; AR, anorectal; GI, gastrointestinal; BOR, best objective response; NR, no response; R, response; CR, complete response; PR, partial response; SD, stable disease; PD, progressive disease; MR, mixed response; TIDE, tumor immune dysfunction and exclusion; MDSC, myeloid-derived suppressor cell; CAF, cancer-associated fibroblast; TAM, tumor-associated macrophage; APM, antigen-presenting machinery.

References

    1. Chang AE, et al. The National Cancer Data Base report on cutaneous and noncutaneous melanoma: a summary of 84,836 cases from the past decade. The American College of Surgeons Commission on Cancer and the American Cancer Society. Cancer. 1998;83(8):1664–1678. doi: 10.1002/(SICI)1097-0142(19981015)83:8<1664::AID-CNCR23>3.0.CO;2-G. - DOI - PubMed
    1. Koomen ER, et al. Epidemiology of extracutaneous melanoma in the Netherlands. Cancer Epidemiol Biomarkers Prev. 2010;19(6):1453–1459. doi: 10.1158/1055-9965.EPI-09-1267. - DOI - PubMed
    1. Chi Z, et al. Clinical presentation, histology, and prognoses of malignant melanoma in ethnic Chinese: a study of 522 consecutive cases. BMC Cancer. 2011;11:85. doi: 10.1186/1471-2407-11-85. - DOI - PMC - PubMed
    1. Heppt MV, et al. Prognostic factors and treatment outcomes in 444 patients with mucosal melanoma. Eur J Cancer. 2017;81:36–44. doi: 10.1016/j.ejca.2017.05.014. - DOI - PubMed
    1. Lian B, et al. The natural history and patterns of metastases from mucosal melanoma: an analysis of 706 prospectively-followed patients. Ann Oncol. 2017;28(4):868–873. doi: 10.1093/annonc/mdw694. - DOI - PubMed

MeSH terms

Substances