

The brain atlas of a subsocial bee reflects that of eusocial Hymenoptera
- PMID: 39513483
- PMCID: PMC11544451
- DOI: 10.1111/gbb.70007
The brain atlas of a subsocial bee reflects that of eusocial Hymenoptera
Abstract
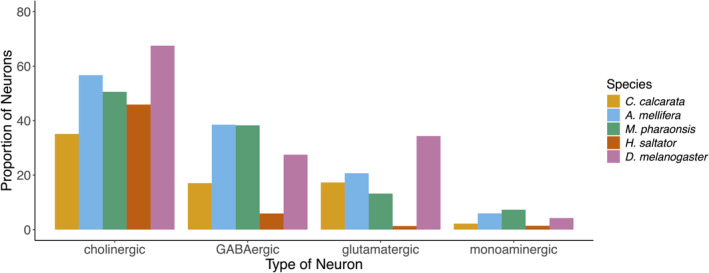
The evolutionary transition from solitary life to group-living in a society with cooperative brood care, reproductive division of labor and morphological castes is associated with increased cognitive demands for task-specialization. Associated with these demands, the brains of eusocial Hymenoptera divide transcriptomic signatures associated with foraging and reproduction to different populations of cells and also show diverse astrocyte and Kenyon cell types compared with solitary non-hymenopteran insects. The neural architecture of subsocial bees, which represent evolutionary antecedent states to eusocial Hymenoptera, could then show how widely this eusocial brain is conserved across aculeate Hymenoptera. Using single-nucleus transcriptomics, we have created an atlas of neuron and glial cell types from the brain of a subsocial insect, the small carpenter bee (Ceratina calcarata). The proportion of C. calcarata neurons related to the metabolism of classes of neurotransmitters is similar to that of other insects, whereas astrocyte and Kenyon cell types show highly similar gene expression patterns to those of eusocial Hymenoptera. In the winter, the transcriptomic signature across the brain reflected diapause. When the bee was active in the summer, however, genes upregulated in neurons reflected foraging, while the gene expression signature of glia associated with reproductive functions. Like eusocial Hymenoptera, we conclude that neural components for foraging and reproduction in C. calcarata are compartmentalized to different parts of its brain. Cellular examination of the brains of other solitary and subsocial insects can show the extent of neurobiological conservation across levels of social complexity.
Keywords: brain evolution; cell type evolution; diapause; neurotransmitters; single cell; sociality.
© 2024 The Author(s). Genes, Brain and Behavior published by International Behavioural and Neural Genetics Society and John Wiley & Sons Ltd.
Conflict of interest statement
The authors declare no conflicts of interest.
Figures


Similar articles
-
The Genome and Methylome of a Subsocial Small Carpenter Bee, Ceratina calcarata.Genome Biol Evol. 2016 May 13;8(5):1401-10. doi: 10.1093/gbe/evw079. Genome Biol Evol. 2016. PMID: 27048475 Free PMC article.
-
Brain Gene Expression of Foraging Behavior and Social Environment in Ceratina calcarata.Genome Biol Evol. 2023 Jul 3;15(7):evad117. doi: 10.1093/gbe/evad117. Genome Biol Evol. 2023. PMID: 37364293 Free PMC article.
-
At the brink of eusociality: transcriptomic correlates of worker behaviour in a small carpenter bee.BMC Evol Biol. 2014 Dec 17;14:260. doi: 10.1186/s12862-014-0260-6. BMC Evol Biol. 2014. PMID: 25514967 Free PMC article.
-
Juvenile hormone in adult eusocial Hymenoptera: gonadotropin and behavioral pacemaker.Arch Insect Biochem Physiol. 1997;35(4):559-83. doi: 10.1002/(SICI)1520-6327(1997)35:4<559::AID-ARCH13>3.0.CO;2-9. Arch Insect Biochem Physiol. 1997. PMID: 9210289 Review.
-
The eusocial non-code: Unveiling the impact of noncoding RNAs on Hymenoptera eusocial evolution.Noncoding RNA Res. 2024 Oct 28;11:48-59. doi: 10.1016/j.ncrna.2024.10.007. eCollection 2025 Apr. Noncoding RNA Res. 2024. PMID: 39736856 Free PMC article. Review.
References
MeSH terms
Grants and funding
LinkOut - more resources
Full Text Sources
