Osteosarcoma stem cells resist chemotherapy by maintaining mitochondrial dynamic stability via DRP1
- PMID: 39513621
- PMCID: PMC11554380
- DOI: 10.3892/ijmm.2024.5451
Osteosarcoma stem cells resist chemotherapy by maintaining mitochondrial dynamic stability via DRP1
Abstract
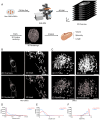
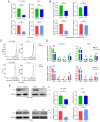
Osteosarcoma malignancy exhibits significant heterogeneity, comprising both osteosarcoma stem cells (OSCs) and non‑OSCs. OSCs demonstrate increased resistance to chemotherapy due to their distinctive cellular and molecular characteristics. Alterations in mitochondrial morphology and homeostasis may enhance chemoresistance by modulating metabolic and regulatory processes. However, the relationship between mitochondrial homeostasis and chemoresistance in OSCs remains to be elucidated. The present study employed high‑resolution microscopy to perform multi‑layered image reconstructions for a quantitative analysis of mitochondrial morphology. The results indicated that OSCs exhibited larger mitochondria in comparison with non‑OSCs. Furthermore, treatment of OSCs with cisplatin (CIS) or doxorubicin (DOX) resulted in preserved mitochondrial morphological stability, which was not observed in non‑OSCs. This finding suggested a potential association between mitochondrial homeostasis and chemoresistance. Further analysis indicated that dynamin‑related protein 1 (DRP1) might play a pivotal role in maintaining the stability of mitochondrial homeostasis in OSCs. Depletion of DRP1 resulted in the disruption of mitochondrial stability when OSCs were treated with CIS or DOX. Additionally, knocking out DRP1 in OSCs led to a reduction in chemoresistance. These findings unveil a novel mechanism underlying chemoresistance in osteosarcoma and suggest that targeting DRP1 could be a promising therapeutic strategy to overcome chemoresistance in OSCs. This provided valuable insights for enhancing treatment outcomes among patients with osteosarcoma.
Keywords: cancer stem cells; chemoresistance; mitochondrial dynamics; osteosarcoma.
Conflict of interest statement
The authors declare that they have no conflicts of interest.
Figures


Similar articles
-
Notch pathway inhibition using DAPT, a γ-secretase inhibitor (GSI), enhances the antitumor effect of cisplatin in resistant osteosarcoma.Mol Carcinog. 2019 Jan;58(1):3-18. doi: 10.1002/mc.22873. Epub 2018 Nov 5. Mol Carcinog. 2019. PMID: 29964327
-
OTULIN confers cisplatin resistance in osteosarcoma by mediating GPX4 protein homeostasis to evade the mitochondrial apoptotic pathway.J Exp Clin Cancer Res. 2024 Dec 26;43(1):330. doi: 10.1186/s13046-024-03249-8. J Exp Clin Cancer Res. 2024. PMID: 39721999 Free PMC article.
-
Hsp90 inhibitor 17‑AAG inhibits stem cell‑like properties and chemoresistance in osteosarcoma cells via the Hedgehog signaling pathway.Oncol Rep. 2020 Jul;44(1):313-324. doi: 10.3892/or.2020.7597. Epub 2020 Apr 28. Oncol Rep. 2020. PMID: 32377704
-
The Regulatory Mechanisms of Dynamin-Related Protein 1 in Tumor Development and Therapy.Cancer Biother Radiopharm. 2021 Feb;36(1):10-17. doi: 10.1089/cbr.2020.3791. Epub 2020 Aug 6. Cancer Biother Radiopharm. 2021. PMID: 32762544 Review.
-
Advances in the research of osteosarcoma stem cells and its related genes.Cell Biol Int. 2022 Mar;46(3):336-343. doi: 10.1002/cbin.11752. Epub 2022 Jan 15. Cell Biol Int. 2022. PMID: 34941001 Review.
Cited by
-
Mitochondrial metabolism and cancer therapeutic innovation.Signal Transduct Target Ther. 2025 Aug 4;10(1):245. doi: 10.1038/s41392-025-02311-x. Signal Transduct Target Ther. 2025. PMID: 40754534 Free PMC article. Review.
References
MeSH terms
Substances
LinkOut - more resources
Full Text Sources
Research Materials
Miscellaneous
