An official website of the United States government
The .gov means it’s official.
Federal government websites often end in .gov or .mil. Before
sharing sensitive information, make sure you’re on a federal
government site.
The site is secure.
The https:// ensures that you are connecting to the
official website and that any information you provide is encrypted
and transmitted securely.
1 Department of Medicine, Columbia Center for Human Development, Vagelos College of Physicians and Surgeons, Columbia University Irving Medical Center, New York, New York.
2 Herbert Irving Comprehensive Cancer Center, Vagelos College of Physicians and Surgeons, Columbia University Irving Medical Center, New York, New York.
3 Cardiometabolic Genomics Program, Division of Cardiology, Department of Medicine, Columbia University Irving Medical Center, New York, New York.
4 Department of System Biology, Columbia University Irving Medical Center, New York, New York.
5 Department of Microbiology and Immunology, Vagelos College of Physicians and Surgeons, Columbia University Irving Medical Center, New York, New York.
6 Department of Gastric Surgery, Fujian Medical University Union Hospital, Fuzhou, P.R. China.
7 Key Laboratory of Ministry of Education of Gastrointestinal Cancer, Fujian Medical University, Fuzhou, P.R. China.
8 Fujian Key Laboratory of Tumor Microbiology, Fujian Medical University, Fuzhou, P.R. China.
9 Department of Pathology and Cell Biology, Columbia University Irving Medical Center, New York, New York.
10 Department of Genetics and Development, Columbia University Irving Medical Center, New York, New York.
11 Department of Molecular Pharmacology and Therapeutics, Columbia University Irving Medical Center, New York, New York.
12 Division of Digestive and Liver Disease, Department of Medicine, Vagelos College of Physicians and Surgeons, Columbia University Irving Medical Center, New York, New York.
SCLC is highly aggressive, with limited effective treatment options. We show that ablating sympathetic nerves or inhibiting the ADRB2 receptor slows SCLC progression and prolongs survival in mice. Additionally, ADRB2 inhibition reduces the growth of human SCLC organoids and xenografts by disrupting PKA signaling, identifying a new therapeutic target.
Figure 1.. Sympathetic nerve fiber density and norepinephrine level are increased in mouse SCLCs.
(A)…
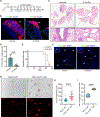
Figure 1.. Sympathetic nerve fiber density and norepinephrine level are increased in mouse SCLCs.
(A) Expression of tyrosine hydroxylase (TH) and Ki67 in the in situ and invasive tumors in the lungs of CMVCre; RP mice. A high magnification view of the boxed area is shown on the right panel. (B) In situ and invasive tumors present in the lungs of AdCre; RPM; tdT mice. Tissue sections were stained with Hematoxylin and Eosin (H&E). (C) Expression of TH (green) and Calcitonin Gene-Related Peptide (CGRP) (red) in the normal lung tissue. Note TH expression in both in situ and invasive tumors that are labeled by tdTomato (tdT). The in situ and invasive tumor images were cropped from the large field images shown in Supplementary Fig. S1C. A high magnification view of the boxed area is shown in the lower panel. (D) Quantification of TH positive (TH+) areas in normal lung tissues (n=5 mice) or in situ and invasive tumor tissues (n=7 mice). (E) Norepinephrine (NE) content in the lungs of RPM; tdT mice with or without infection of Ad5-CGRP-Cre virus (n=3 mice for each group). Data represent mean ± SD. *p < 0.05; **p < 0.01; ***p < 0.001; ****p < 0.0001. Statistical values were calculated using an unpaired, two-tailed t-test. Abbreviation: airway (aw). Scale bar: 50 μm.
Figure 2.. Denervation suppresses the development of…
Figure 2.. Denervation suppresses the development of mouse SCLC.
(A) Experimental scheme of chemical sympathectomy…
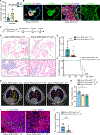
Figure 2.. Denervation suppresses the development of mouse SCLC.
(A) Experimental scheme of chemical sympathectomy of AdCre; RPM; tdT mice by intraperitoneal injection of 6-hydroxydopamine (6-OHDA). (B) TH+ sympathetic neural fibers in SCLC in mice with or without sympathectomy. (C) Tumors developed in chemical sympathectomy and PBS-treated vehicle mouse lungs. A high magnification view is shown on the lower panels. (D) The percentage of tumor / total lung areas as shown in (C). Each dot represents one animal. (E) The survival of AdCre; RPM; tdT mice that were subjected to either vehicle or 6-OHDA treatment (n=5 mice per group). (F) Expression of cleaved caspase-3 (CC-3) in the tumor free lung tissue from mice treated with vehicle or 6-OHDA. Apoptotic cells are indicated by the arrowheads. The high magnifcaiton for the area indicated by the red arrowheads are shown in the box. (G) Organoids formed by tdT+ SCLC cells with/without stellate ganglia (SG). (H and I) Quantification of the size and the number of the organoids. Data represent mean ± SD. *p < 0.05; ***p < 0.001; ****p < 0.0001. Statistical values were calculated using an unpaired, two-tailed t-test or Mantel-Cox log-rank test. Scale bar in B: 50 μm; C: 4 mm (upper panel) or 200 μm (lower panel); F: 100 μm; G: 250 μm.
Figure 3.. Constitutive or conditional Adrb2 deletion…
Figure 3.. Constitutive or conditional Adrb2 deletion inhibits the progression of mouse SCLC.
(A) Expression…
Figure 3.. Constitutive or conditional Adrb2 deletion inhibits the progression of mouse SCLC.
(A) Expression of the indicated genes in the SCLCs of RPM mice. The y-axis represents the normalized read count using the DESeq2 median of ratios. (B) Expression of ADRB2 in in situ and invasive tumors that are labeled by tdT in the lungs of AdCre; RPM; tdT mice. (C) Time course analysis of lung tissues from AdCre; RPM; Adrb2+/+; tdT or AdCre; RPM; Adrb2loxp/loxp; tdT mice. (D) SCLC developed in AdCre; RPM; Adrb2+/+; tdT or AdCre; RPM; Adrb2loxp/loxp; tdT mice six weeks after viral infection. High magnification images are shown in the lower panels. (E) Quantification of tumor / total lung areas as in (D). n=11 for each group. (F) Survival rates of AdCre; RPM; Adrb2+/+; tdT or AdCre; RPM; Adrb2loxp/loxp; tdT mice (AdCre; RPM; Adrb2+/+; tdT, n=13; AdCre; RPM; Adrb2loxp/loxp; tdT, n=12). (G) MicroCT images of tumors developed in mice with/without Adrb2 six weeks after viral infection. Air volume of the lungs tissues are pseudocolored in dark purple; tumors and airways highlighted in yellow. (H) Quantification of tumor volumes measured by microCT imaging (tumor volumes / total lung volumes). Each dot represents one animal (n=5 for each group). (I) Reduction of TH+ nerve fibers in the tdT+ tumors developed in the lungs of AdCre; RPM; Adrb2loxp/loxp; tdT mice six weeks after viral infection. (J) Quantification of TH+ areas in the lung sections from mice with/without Adrb2. Data represent mean ± SD. *p < 0.05; **p < 0.01. Statistical values were calculated using an unpaired, two-tailed t-test or Mantel-Cox log-rank test. Abbreviation: airway (aw). Scale bar in B and I: 50 μm; D: 4 mm (upper panel) or 200 μm (lower panel).
Figure 4.. ADRB2 is critical for the…
Figure 4.. ADRB2 is critical for the growth of human SCLC cells.
(A) qRT-PCR analysis…
Figure 4.. ADRB2 is critical for the growth of human SCLC cells.
(A) qRT-PCR analysis of ADRB2 expression in NCI-H524 or NCI-H446 cells infected with shADRB2#1, shADRB2#2, or shControl. (B) The growth of NCI-H524 or NCI-H446 cells with/without ADRB2 knockdown. (C) Tumor spheres formed by NCI-H524 cells with/without ADRB2 knockdown. (D and E) Quantification of the size and number of spheres as shown in (C). (F) qRT-PCR analysis of ADRB2 expression in NCI-H2171 cells infected with PCDH vector or PCDH-ADRB2. (G) The growth of NCI-H2171 cells with/without ADRB2 overexpression. Cells were maintained for 72 hours. (H) Spheres formed by NCI-H2171 cells with/without ADRB2 overexpression. Spheres were maintained for two weeks. Inserts represent the high magnification views of the boxed areas. (I and J) Quantification of the size and number of the spheres established with NCI-H2171 cells with/without ADRB2 overexpression. Data represent mean ± SD. **p < 0.01; ***p < 0.001; ****p < 0.0001. Statistical values were calculated using an unpaired, two-tailed t-test. Scale bar: 250 μm.
Figure 5.. Selective β2-blocker treatment inhibits the growth of SCLC accompanied by reduced sympathetic nerve…
Figure 5.. Selective β2-blocker treatment inhibits the growth of SCLC accompanied by reduced sympathetic nerve infiltration.
(A) Experimental scheme showing AdCre; RPM; tdT mice treated with the ADRB2 antagonist ICI 118, 551 (ICI). (B) SCLC developed in the lungs of AdCre; RPM; tdT mice treated with vehicle (PBS) or ICI for six weeks. Representative high magnification views are shown on lower panels. (C) Quantification of the percentage of tumor / total lung areas from (B) (PBS, n=6; ICI, n=6). (D) Reduction of TH+ nerve fibers by ICI in tumors labeled by tdT. (E) Quantification of TH+ areas in the sections from vehicle or ICI-treated mice lungs. (F) Spheres formed by NCI-H524 cells were treated with control (DMSO) or ICI (25 μM) for two weeks. The boxed areas indicate high magnification. (G and H) Quantification of the size and numbers of the spheres as represented by (F). (I) The growth of NCI-H524 cells treated with the indicated concentration of NE. Cell growth was assessed with the WST-1 assay. (J and K) The growth of NCI-H524 and NCI-H446 cells treated with ICI (50 μM) or ICI+NE (10 μM). Cell growth was assessed with the WST-1 assay. (L) Growth of tumors after treatment with vehicle (PBS) or ICI (female nude mice). Tumors were established with NCI-H524 cells. (M) Measurement of tumor weight after treatment with vehicle or ICI. (N) Expression of TH (green), NFH (white), and Ki67 (red) in tumors treated with vehicle or ICI. A high magnification view of the boxed areas is shown on the right panels. (O) Quantification of TH+ areas as represented by (N). Data represent mean ± SD. ns, not significant; *p < 0.05; **p < 0.01; ***p < 0.001; ****p < 0.0001. Statistical values were calculated using an unpaired, two-tailed t-test. Abbreviation: airway (aw). Scale bar in B: 4 mm (upper panel) or 200 μm (lower panel); D and N: 50 μm; F: 250 μm.
Figure 6.. ADRB2 regulates PKA signaling in…
Figure 6.. ADRB2 regulates PKA signaling in SCLC.
(A) Immunoblot analysis of NCI-H524 and NCI-H446…
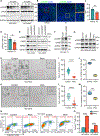
Figure 6.. ADRB2 regulates PKA signaling in SCLC.
(A) Immunoblot analysis of NCI-H524 and NCI-H446 cells treated with the indicated concentration of ICI or control (DMSO). (B) Expression of pCREB in tumor sections from nude mice treated with either vehicle (PBS) or ICI. A high magnification view of the boxed area is shown on the right panels. (C and D) Quantification of mean fluorescence intensity of pCREB and percentage of pCREB+ in representative sections as (B). (E) Immunoblot analysis of NCI-H446 and NCI-H524 cells with/without ADRB2 knockdown. (F) Immunoblot analysis of NCI-H2171 cells infected with lentivirus containing PCDH vector or PCDH-ADRB2. (G) Immunoblot analysis of NCI-H446 and NCI-H524 cells treated with the PKAi. (H) Spheres formed by NCI-H524 cells that were treated with control (DMSO) or PKA inhibitor H-89 (PKAi) (5 μM). The boxed areas are high magnification views. (I and J) Quantification of the size and number of the spheres as represented by (H). (K) Spheres formed by NCI-H446 cells that were treated with control (DMSO) or PKAi (5 μM). The boxed areas are high magnification views. (L and M) Quantification of the sizes and numbers of the spheres as represented by (K). (N) Flow cytometry analysis of apoptotic (Annexin V+) cells in control (DMSO) or PKAi (5 μM) treated NCI-H524 and NCI-H446 cells. (O) Quantification of apoptotic cells. Data represent mean ± SD. *p < 0.05; ***p < 0.001; ****p < 0.0001. Statistical values were calculated using an unpaired, two-tailed t test. Scale bar in B: 50 μm; H, K: 250 μm.
Figure 7.. ADRB2 enrichment is associated with…
Figure 7.. ADRB2 enrichment is associated with sympathetic innervation in human SCLC.
(A) Expression of…
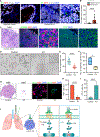
Figure 7.. ADRB2 enrichment is associated with sympathetic innervation in human SCLC.
(A) Expression of TH (green), NFH (red) and SOX2 (white) in SCLC or adjacent tumor free tissues. A high magnification view of the boxed area is shown on the right panels. (B) Quantification of TH+ areas. (adjacent tissues, n=9; human SCLC, n=15). (C) Expression of ADRB2 (green), Ki67 (red) and SYP (green) in human SCLC samples. A high magnification view of the boxed area is shown on the right panels. (D) Organoids formed by primary human SCLC cells treated with control (DMSO) or ICI (25 μM) for two weeks. The boxed areas indicate high magnification views. (E and F) Quantification of the size and number of the organoids as represented by D. (G) H&E staining and the expression of CC-3 (green), Ki67 (red) in the organoids formed by control or ICI-treated primary human SCLC cells. (H and I) Quantification of the percentage of CC-3+ or Ki67+ cells. (J) Schematic illustration showing sympathetic neuron regulation of SCLC development. Infiltrating sympathetic nerve fibers produce norepinephrine (NE) and activate the ADRB2/PKA/P-CREB axis to promote the expansion of SCLC cells. Ablation of the sympathetic nerve fibers with 6-OHDA or inhibition of the ADRB2/PKA/P-CREB axis with genetic or pharmaceutical approaches blocks tumor progression. Data represent mean ± SD. *p < 0.05; ****p < 0.0001. Statistical values were calculated using an unpaired, two-tailed t test. Abbreviation: airway (aw). Scale bar in A, C, G: 50 μm; D: 250 μm.
Rudin CM, Brambilla E, Faivre-Finn C, Sage J. Small-cell lung cancer. Nat Rev Dis Primers 2021;7(1):3 doi 10.1038/s41572-020-00235-0.
-
DOI
-
PMC
-
PubMed
Pietanza MC, Byers LA, Minna JD, Rudin CM. Small cell lung cancer: will recent progress lead to improved outcomes? Clin Cancer Res 2015;21(10):2244–55 doi 10.1158/1078-0432.CCR-14-2958.
-
DOI
-
PMC
-
PubMed
van Meerbeeck JP, Fennell DA, De Ruysscher DK. Small-cell lung cancer. Lancet 2011;378(9804):1741–55 doi 10.1016/S0140-6736(11)60165-7.
-
DOI
-
PubMed
Byers LA, Rudin CM. Small cell lung cancer: where do we go from here? Cancer 2015;121(5):664–72 doi 10.1002/cncr.29098.
-
DOI
-
PMC
-
PubMed
Branchfield K, Nantie L, Verheyden JM, Sui PF, Wienhold MD, Sun X. Pulmonary neuroendocrine cells function as airway sensors to control lung immune response. Science 2016;351(6274):707–10 doi 10.1126/science.aad7969.
-
DOI
-
PMC
-
PubMed