. 2025 Feb 20;231(2):e419-e428.
doi: 10.1093/infdis/jiae551.

Early Viral Dynamics Predict Human Immunodeficiency Virus Posttreatment Control After Analytic Treatment Interruption

Affiliations

Early Viral Dynamics Predict Human Immunodeficiency Virus Posttreatment Control After Analytic Treatment Interruption

Gesham Magombedze et al. J Infect Dis. .

Abstract

Background: A key research priority for developing a human immunodeficiency virus (HIV) cure strategy is to define the viral dynamics and biomarkers associated with sustained posttreatment control. The ability to predict the likelihood of sustained posttreatment control or noncontrol could minimize the time off antiretroviral therapy (ART) for those destined to be controllers and anticipate longer periods off ART for those destined to be controllers.

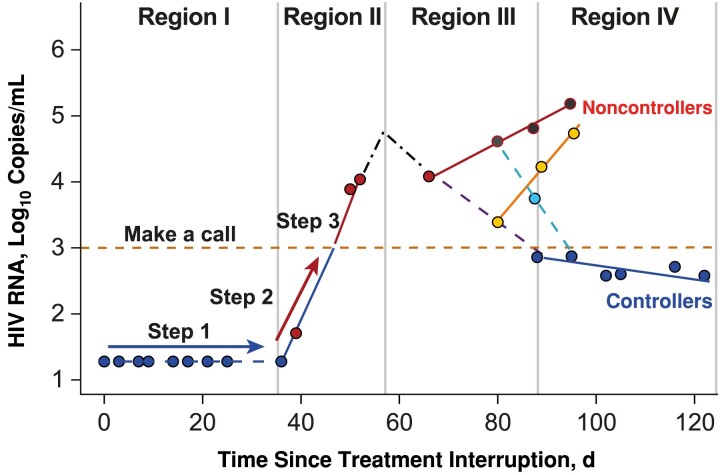
Methods: Mathematical modeling and machine learning were used to characterize virologic predictors of long-term virologic control, using viral kinetics data from several studies in which participants interrupted ART. Predictors of post-ART outcomes were characterized using data accumulated from the time of treatment interruption, replicating real-time data collection in a clinical study, and classifying outcomes as either posttreatment control (plasma viremia, ≤400 copies/mL at 2 of 3 time points for ≥24 weeks) or noncontrol.

Results: Potential predictors of virologic control were the time to rebound, the rate of initial rebound, and the peak plasma viremia. We found that people destined to be noncontrollers could be identified within 3 weeks of rebound (prediction scores: accuracy, 80%; sensitivity, 82%; specificity, 71%).

Conclusions: Given the widespread use of analytic treatment interruption in cure-related trials, these predictors may be useful to increase the safety of analytic treatment interruption through early identification of people who are unlikely to become posttreatment controllers.

Keywords: HIV; analytical treatment interruption; posttreatment control; sustained virologic response; viral rebound.


Conflict of interest statement

Potential conflicts of interest. G. M., E. V., D. S., and R. G. have stock or stock options in and are employees of Gilead Sciences. S. G. D. reports consulting fees from AbbVie, Eli Lilly, Enanta, GSK, Hookipa, and Immunocore; participated on an advisory board for American Gene Technologies; and owns Tendel stock. M. J. P. reports consulting for Gilead Sciences and AstraZeneca and receiving medical-legal consultation fees. All other authors report no potential conflicts. All authors have submitted the ICMJE Form for Disclosure of Potential Conflicts of Interest. Conflicts that the editors consider relevant to the content of the manuscript have been disclosed.

Figures

Figure 1.
Figure 1.
Model illustration. A, Typical viral kinetics of an analytic treatment interruption (ATI) clinical study participant through 4 different regions. Region I is the period when human immunodeficiency virus (HIV) RNA is at or below the limit of detection. Region II is the period when the virus rebounds, resumes replication, and accumulates to the peak; this region is followed by reduction of viral replication. Region III contains viral mixed kinetic patterns, and the boundary of this region corresponds with the viral nadir (or viral set point). Region IV is associated with steady increase in plasma viremia in noncontrollers and sustained reduced plasma viremia in controllers. Dots represent data points for plasma viremia. B, Viral kinetics shown in A are explained with a piecewise ordinary differential equation. The model describes the viral kinetics in each region with a parameter, and these parameters are used to learn and characterize early predictors (from regions I and II) that classify ATI long-term outcomes observed in region IV. C, Data partitioning into the training, testing, and clinical imitation subsets used to identify and validate the performance of the predictors. The distribution of controllers vs noncontrollers was ~25% and was balaned in each data partition.
Figure 2.
Figure 2.
Statistical difference between analytic treatment interruption (ATI) controllers (C) and noncontrollers (NC). A, The peak plasma human immunodeficiency virus (HIV) viremia value observed within the first 4 weeks of viral rebound can distinctively separate ATI controllers from noncontrollers (P < .001). B, After rebounding, noncontrollers have a faster rebounding rate than controllers (P < .001). C, Difference between time to viral rebound, time to viral peak, and time from rebound to peak. The time to viral peak did not differ significantly between controllers and noncontrollers (P = .18).
Figure 3.
Figure 3.
Decision trees showing classification of analytic treatment interruption (ATI) outcomes. The plasma viremia (observed viral peak) provides the best classification of controllers (C) and noncontrollers (NC). A, An ATI participant who attains a viral peak <3 log10 human immunodeficiency virus (HIV) RNA copies/mL is likely to be a posttreatment controller. B, Decision tree based on the viral slope (rate of viral replication). Noncontrollers are shown to be associated with a fast rate of viral rebounding speed. C, Time to viral rebound of ≥53 days likely predicts a controller. D, Short time to attain viral peak (<18 days) in a predicted noncontroller.
Figure 4.
Figure 4.
Decision rule on how to make a call. Step 1: Follow up the participant until an observation above the lower limit of detection is made; record this as the time to rebound. Step 2: Follow up the participant for 2 or at most 3 weeks. Record the human immunodeficiency virus (HIV) RNA level weekly, and record the slope of regression line (rate of viral replication) and HIV RNA level at week 3 (viral peak). Step 3: Make a call. If the plasma viremia at week 3 in step 2 exceeds 3 log10 copies/mL at any time within 2–3 weeks, the call is noncontroller; if the plasma viremia remains below 3 log10 copies/mL within 3 weeks, then the call is controller. Step 4: If results are on the borderline, check whether the time to rebound is <53 days. If <53 days, then the call is noncontroller; otherwise, the call is controller. On this step also, the regression line is used to consolidate the call; if the regression slope (rate of viral replication) is <0.033, then the call is confirmed as controller, otherwise an extra data point (week 4) is required. In region I, blue dots represent HIV RNA levels below the limit of detection. In region II, red dots represent HIV RNA levels above the limit of detection. Region III is a region of mixed patterns; red dots represent values that remain high, and yellow dots identify a pattern with an initial decrease in viral load but then with resumption of replication, ending with being a noncontroller. Cyan dots represent the opposite, that is, a pattern that reverses to viral control. In region IV, red and yellow dots above the yellow dashed line represent noncontrollers, and blue dots represent controllers.

References

    1. Etemad B, Esmaeilzadeh E, Li JZ. Learning from the exceptions: HIV remission in post-treatment controllers. Front Immunol 2019; 10:1749. - PMC - PubMed
    1. Landovitz RJ, Scott H, Deeks SG. Prevention, treatment and cure of HIV infection. Nat Rev Microbiol 2023; 21:657–70. - PubMed
    1. Li JZ, Aga E, Bosch RJ, et al. Time to viral rebound after interruption of modern antiretroviral therapies. Clin Infect Dis 2022; 74:865–70. - PMC - PubMed
    1. Stephenson KE, Neubauer GH, Bricault CA, et al. Antibody responses after analytic treatment interruption in human immunodeficiency virus-1-infected individuals on early initiated antiretroviral therapy. Open Forum Infect Dis 2016; 3:ofw100. - PMC - PubMed
    1. Pasternak AO, Psomas CK, Berkhout B. Predicting post-treatment HIV remission: does size of the viral reservoir matter? Front Microbiol 2021; 12:648434. - PMC - PubMed

Substances