. 2024 Oct 24;13(21):1765.
doi: 10.3390/cells13211765.

Structure-Function Correlation in Cobalt-Induced Brain Toxicity

Affiliations

Structure-Function Correlation in Cobalt-Induced Brain Toxicity

Basel Obied et al. Cells. .

Abstract

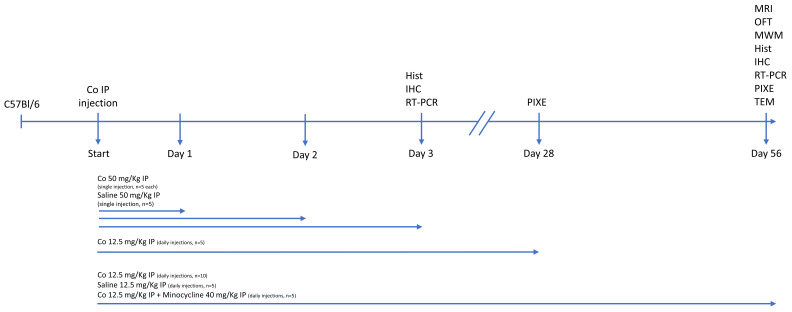
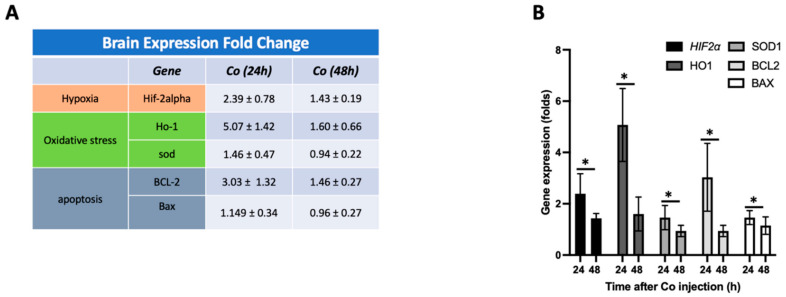
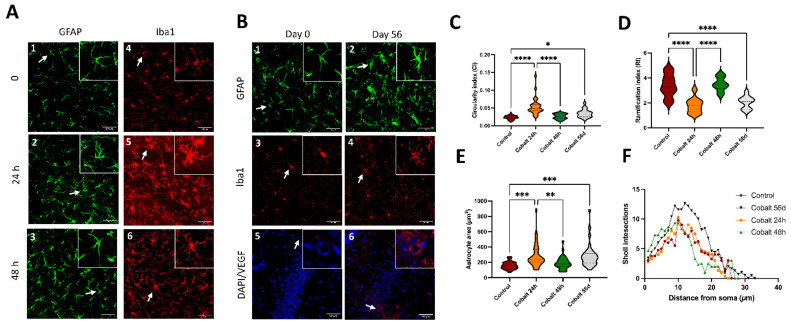
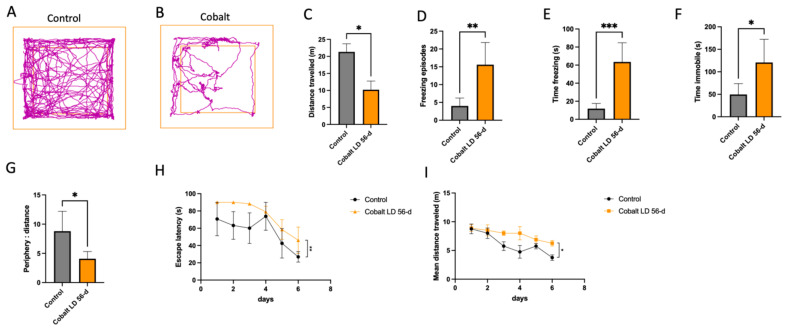
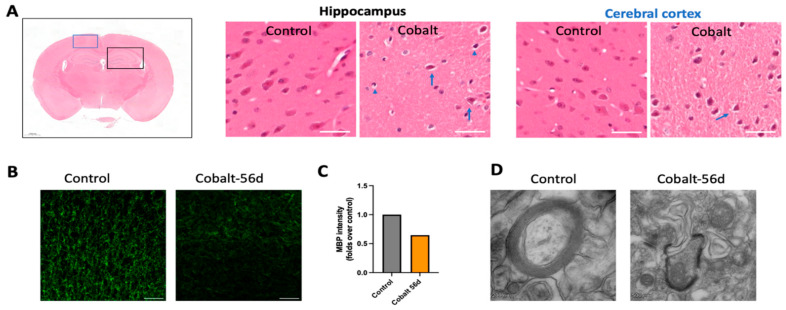
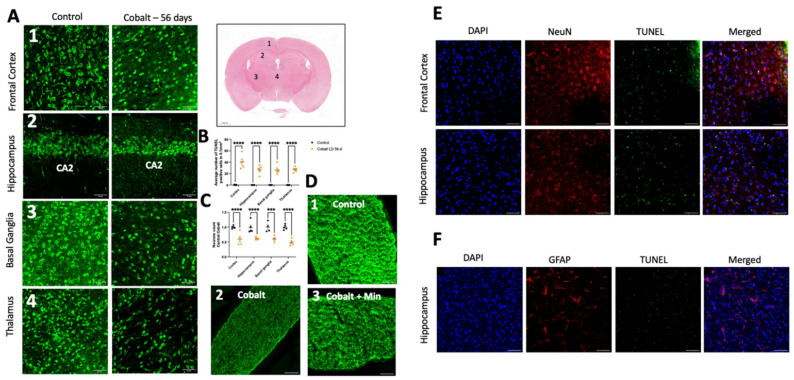
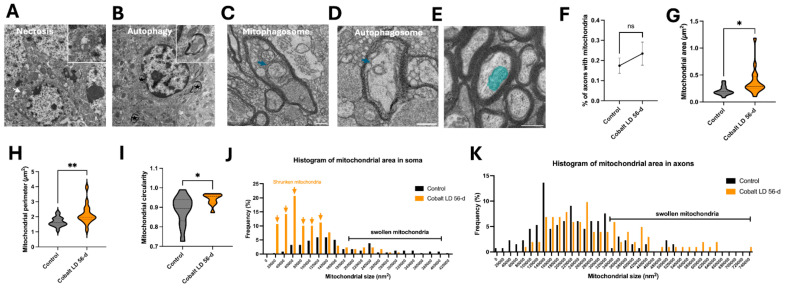
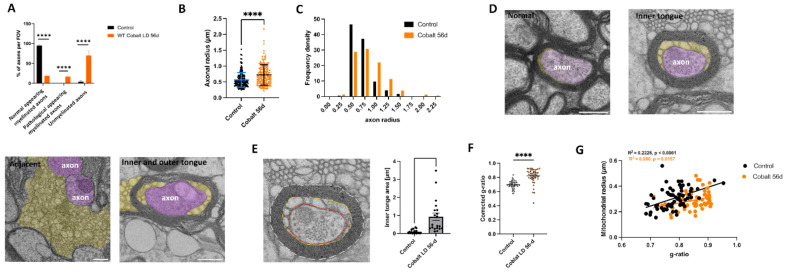
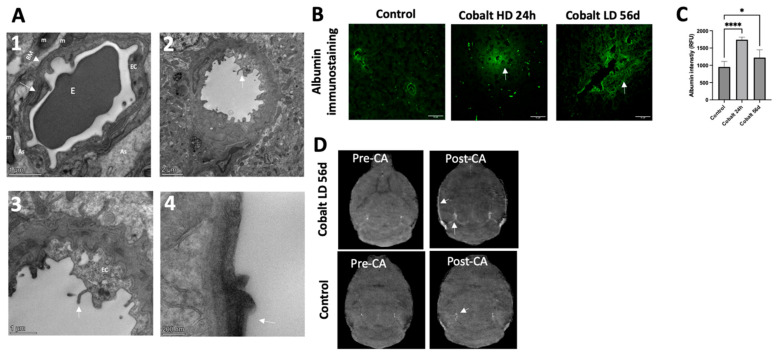
Cobalt toxicity is difficult to detect and therefore often underdiagnosed. The aim of this study was to explore the pathophysiology of cobalt-induced oxidative stress in the brain and its impact on structure and function. Thirty-five wild-type C57B16 mice received intraperitoneal cobalt chloride injections: a single high dose with evaluations at 24, 48, and 72 h (n = 5, each) or daily low doses for 28 (n = 5) or 56 days (n = 15). A part of the 56-day group also received minocycline (n = 5), while 10 mice served as controls. Behavioral changes were evaluated, and cobalt levels in tissues were measured with particle-induced X-ray emission. Brain sections underwent magnetic resonance imaging (MRI), electron microscopy, and histological, immunohistochemical, and molecular analyses. High-dose cobalt caused transient illness, whereas chronic daily low-dose administration led to long-term elevations in cobalt levels accompanied by brain inflammation. Significant neurodegeneration was evidenced by demyelination, increased blood-brain barrier permeability, and mitochondrial dysfunction. Treated mice exhibited extended latency periods in the Morris water maze test and heightened anxiety in the open field test. Minocycline partially mitigated brain injury. The observed signs of neurodegeneration were dose- and time-dependent. The neurotoxicity after acute exposure was reversible, but the neurological and functional changes following chronic cobalt administration were not.

Keywords: MRI; Morris water maze; PIXE; behavioral tests; cobalt; electron microscopy; minocycline; neurodegeneration; open field test.


Conflict of interest statement

The authors declare no conflicts of interest. The funders had no role in the design of the study; in the collection, analyses, or interpretation of data; in the writing of the manuscript; or in the decision to publish the results.

Figures

Figure 1
Figure 1
Overview of experimental design for cobalt exposure in mice. Thirty-five wild-type mice were divided into two groups: mice treated with a single high-dose IP injection of CoCl2 observed for 3 days (n = 5 each) and mice treated with a daily low-dose IP injection of CoCl2 for 28 (n = 5) or 56 days (n = 15). An additional 10 mice served as controls. The doses administered and follow-up times and studies performed are noted. Hist—histology, IHC—immunohistochemistry, IP—intraperitoneal, MRI—magnetic resonance imaging, TEM—transmission electron microscopy, OFT—open field test, MWM—Morris water maze, RT-PCR—real-time polymerase chain reaction, PIXE—particle-induced X-ray emission, TEM—transmission electron microscopy.
Figure 2
Figure 2
Co-injection caused an increase in the expression of genes related to hypoxia, oxidative stress, and apoptosis. (A,B) Gene expression levels of several targets, including hypoxia (Hif-2alpha), oxidative stress (Ho-1), and apoptosis (BCL-2, Bax) genes, were determined over the first 48h. The ratio of Bax to BCL-2 was determined to be 0.379 after 24 h and 0.65 after 48 h post-injection. Data expressed as percent change from baseline. Data shown are mean ± SD, * p < 0.05.
Figure 3
Figure 3
Morphometric analysis of microglial and astrocytic activation following cobalt exposure (AF). (A1A6) Increased immunoreactivity of Iba-positive microglia and GFAP-positive astrocytes was evident during the first 24 h after a single high-dose injection of cobalt and subsided by 48 h. (B1B4). Low levels of Iba and GFAP immunoreactivity after 56 days of daily low-dose cobalt administration. (C) Swarm plot showing circularity index of the experimental groups. (D) Swarm plot showing ramification index of the experimental groups. (E) Swarm plot showing astrocytic cover area in the experimental groups. (F) Distinct difference between control and low-dose-cobalt-treated group (* p < 0.05) in Sholl intersection distribution by distance from the astrocyte’s soma. The analyses (CF) were performed by one–way ANOVA with Tukey’s multiple comparison tests. Each group contained 5 mice (n = 5); for each mouse, twenty to thirty cells per region were analyzed. (B5,B6) Increased VEGF immunoreactivity, particularly localized around blood vessels, in the cobalt-treated group versus the control group; * p < 0.05, ** p < 0.01, *** p < 0.001, **** p < 0.0001.
Figure 4
Figure 4
Behavioral assessment of cobalt-induced effects on locomotion and anxiety. (AG). (A,B) Representative OFT track plot recorded during the 5-min test sessions (ANY-maze). The central square was designated the “central zone”, and the periphery, the “border zone”. (CG) Locomotor activity decreased after chronic cobalt treatment, whereas anxiety-related behavior was increased. * p < 0.05, ** p < 0.01, Student t-test. (H,I) MWM spatial acquisition learning curves after 6 consecutive days. Data points represent mean values of escape latency of the control (black) and the cobalt-injected (orange) groups (H). The between-group difference was statistically significant. (I) Mean distance traveled in meters until island zone entry as a function of the day of training. The day of training had a significant influence on the mean distance traveled in both groups (p < 0.05). * p < 0.05, ** p < 0.01, *** p < 0.001 Student t-test. Number of mice: n = 5 in each group. Data shown are mean ± SEM. LD = low dose.
Figure 5
Figure 5
Immunohistochemistry (IHC) and ultrastructural analysis of cobalt-induced neurotoxicity. (A) H&E staining in the cobalt-treated group revealed small, deformed nuclei (blue arrowhead) and cracked cytoplasm (blue arrow). Other findings included hyperchromatic cells (blue arrow), cellular atrophy, shrinkage, cellular necrosis, pyknosis, and deeply stained and dark nuclei, in addition to large multipolar cells, neuronal swelling, chromatolysis, and nuclear margination. (B,C) Immunostaining with myelin basic protein (MBP) (green) in the cortex showing demyelination compared to controls with decreased staining signal intensity in the treated group; scale bar = 50 µm. (D) TEM analysis revealed extensive loss of myelin and axonal injury.
Figure 6
Figure 6
Immunostaining and quantification of neuronal loss and cell death. (A) Neurons were labeled with NeuN antibody in the frontal cortex, hippocampus, thalamus, and basal ganglia. (B) Quantification of the mean number of neurons in these brain areas indicated neuronal loss in the cobalt-treated group. (C) Quantification of TUNEL+ cells/area in the frontal cortex, hippocampus, thalamus, and basal ganglia. **** p < 0.0001, *** p < 0.001, Student t-test. Number of mice: n = 5 in each group. Data shown are mean ± SEM. Scale bar = 50 µm. LD = low dose. (D1) Illustration of normal myelin in a control mouse. (D2) Extensive demyelination in a cobalt-treated mouse. (D3) Partial preservation of myelin in a minocycline-treated mouse on MBP immunohistochemical staining. Scale bar: 50 µm. (E) TUNEL and neuronal marker NeuN+ staining after daily IP treatment for 56 days yielded positive findings. (F) GFAP and TUNEL did not overlap, indicating that astrocytes were less susceptible to cobalt toxicity.
Figure 7
Figure 7
Cobalt-induced neuronal death mechanisms: necrosis, autophagy, and mitochondrial alterations. (A) Necrotic neuronal cell body showing the absence of a defined nuclear membrane, enlarged mitochondria (white arrow), and altered chromatin organization after 56 days of daily cobalt exposure. The inset presents a high-resolution image of the swollen mitochondria. (B) Autophagic activity observed in neuronal cell bodies at 56 days after cobalt treatment, with autophagosomes marked by asterisks. The inset provides a detailed view of an autophagosome. (C,D) An example of a small, degraded mitochondrion within a mitophagosome and the formation of autophagosomes (blue arrows) in an axon from a cobalt-treated mouse. Scale bar: 0.5 µm. (E) Cross-sectional view of a myelinated axon with mitochondria (blue) in a control mouse; scale bar: 0.5 µm. (F) Percentage comparison of myelinated axons containing mitochondria between cobalt-exposed and control mice. (GI) Cross-sectional analysis of mitochondrial size (G), perimeter (H), and circularity (I) in axons. Violin plots show the full distribution of measurements. * p < 0.05, ** p < 0.01, NS (not significant); Student’s t-test. A total of 300 mitochondria were analyzed in each group, with data expressed as mean ± SEM. (J,K) Frequency distribution of mitochondrial area in neuronal cell bodies (J) and axons (K) between control and cobalt-exposed groups following two months of daily treatment. Arrows indicate a higher occurrence of shrunken mitochondria. Number of mitochondria analyzed: n = 300 per group.
Figure 8
Figure 8
Phenotypic quantification of optic nerve alterations following cobalt treatment. (A) Analysis was performed on optic nerve cross-sections on a total area of >320 µm2 with >200 axons per group; all the axons in the field of view were counted. **** p < 0.001, unpaired t-test. (B) Plot showing increased axonal radius in the cobalt-treated group compared to controls. **** p < 0.0001, unpaired t-test. (C) Histogram showing axonal radius density. (D) Electron micrograph of optic nerves showing myelin pathology. Membrane tubules (orange) emerge at the inner tongue of the cobalt-treated mice. Occasionally, tubulations (purple) are seen at the outer tongue of myelinated axons associated with tubulations at the inner tongue. At places where most compact myelin is lost, membrane tubules loop out and leave partially demyelinated axons behind. Tubules could also be found next to demyelinated axons. (E) Illustration of corrected g-ratio measurement. Three lines are drawn for the area measurement: the outline of the fiber (stippled white line), the outline of the inner border of the compact myelin (orange), and the axon (red). Scale bar = 500 nm. The inner tongue area was increased in the low-dose-cobalt-treated group compared to the control. (F) Corrected g-ratio measurements reveal a progressive decrease in compact myelin in the cobalt-treated group compared to controls. Number of mice: n = 5, >20 axons each. **** p < 0.0001, unpaired t-test. (G) Scatter plot illustrating the relationship between the mitochondrial radius and the g-ratio. Pearson’s r test.
Figure 9
Figure 9
Cobalt-induced disruption of blood–brain barrier (BBB) integrity and enhanced vascular permeability. (A1) Capillary from the cerebral cortex of a control mouse (high magnification). Note the single layer of endothelial cells surrounded by a layer of basement membrane, forming an intact BBB. An erythrocyte can be observed in the lumen of the capillary. (A2,A3) Numerous vesicles are present in the cytoplasm of an endothelial cell from the cortex and hippocampus of a cobalt-treated mouse. Microvilli and their fragments (white arrows) are present in the capillary lumen. (A4) The tight junctions were unclear, and basal laminas were partially collapsed. (B,C) Immunohistochemical analysis revealed the presence of albumin within brain tissues. In control mice, albumin immunostaining distinctly showed localization within blood vessels, but in cobalt-treated mice, albumin extravasation (green, indicated by arrows) was observed. Number of mice: n = 5 each. One-way ANOVA. * p < 0.05, **** p < 0.0001. (D) Cross-view images acquired before (Pre-CA) and after (Post-CA) injection showing increased signal intensity (white arrow), indicating BBB leakage. CA = contrast agent.

References

    1. Leyssens L., Vinck B., Van Der Straeten C., Wuyts F., Maes L. Cobalt toxicity in humans-A review of the potential sources and systemic health effects. Toxicology. 2017;387:43–56. doi: 10.1016/j.tox.2017.05.015. - DOI - PubMed
    1. Garcia M.D., Hur M., Chen J.J., Bhatti M.T. Cobalt toxic optic neuropathy and retinopathy: Case report and review of the literature. Am. J. Ophthalmol. Case Rep. 2020;17:100606. doi: 10.1016/j.ajoc.2020.100606. - DOI - PMC - PubMed
    1. Crutsen J.R.W., Koper M.C., Jelsma J., Heymans M., Heyligers I.C., Grimm B., Mathijssen N.M.C., Schotanus M.G.M. Prosthetic hip-associated cobalt toxicity: A systematic review of case series and case reports. EFORT Open Rev. 2022;7:188–199. doi: 10.1530/EOR-21-0098. - DOI - PMC - PubMed
    1. Kovochich M., Finley B.L., Novick R., Monnot A.D., Donovan E., Unice K.M., Fung E.S., Fung D., Paustenbach D.J. Understanding outcomes and toxicological aspects of second generation metal-on-metal hip implants: A state-of-the-art review. Crit. Rev. Toxicol. 2018;48:853–901. doi: 10.1080/10408444.2018.1563048. - DOI - PubMed
    1. MDA/2017/018. Medical Device Alert. All Metal-on-Metal (MoM) Hip Replacements: Updated Advice for Follow-Up of Patients. [(accessed on 29 November 2021)]; Available online: http://www.mhra.gov.uk/

Publication types

LinkOut - more resources