. 2024 Oct 31;13(21):1801.
doi: 10.3390/cells13211801.

Expression Profiling Identified TRPM7 and HER2 as Potential Targets for the Combined Treatment of Cancer Cells

Affiliations

Expression Profiling Identified TRPM7 and HER2 as Potential Targets for the Combined Treatment of Cancer Cells

Miyuki Egawa et al. Cells. .

Abstract

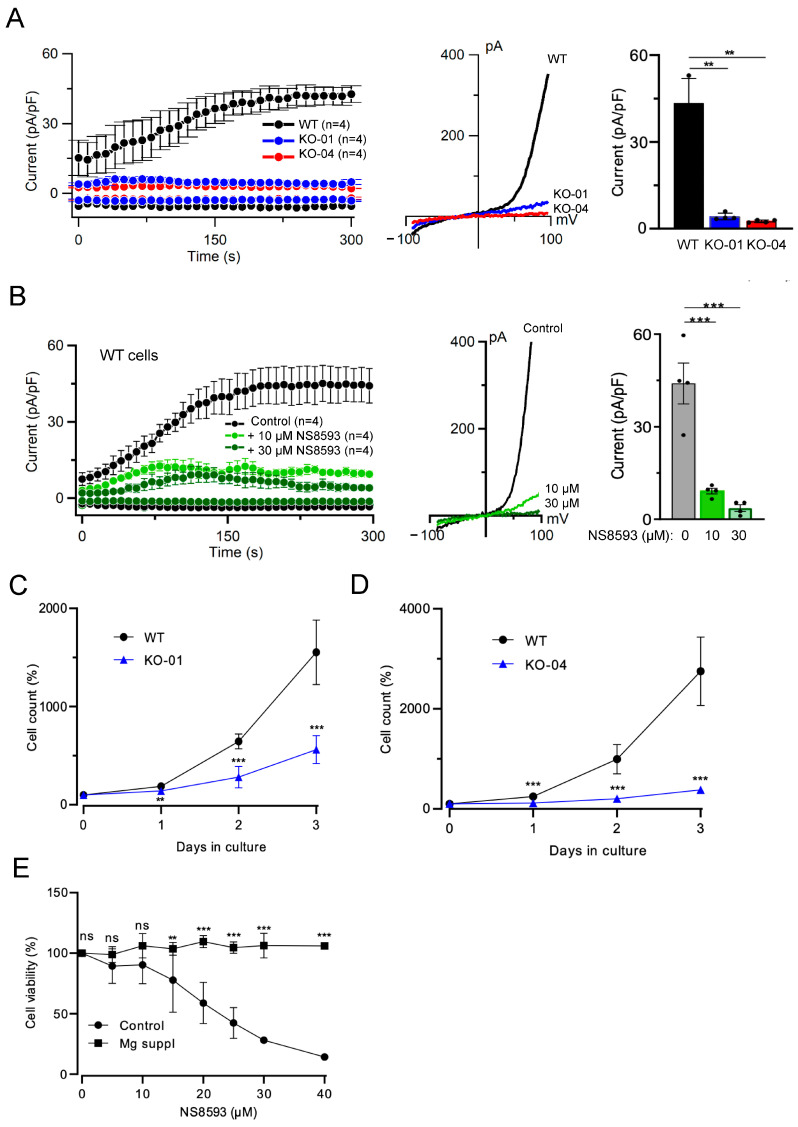
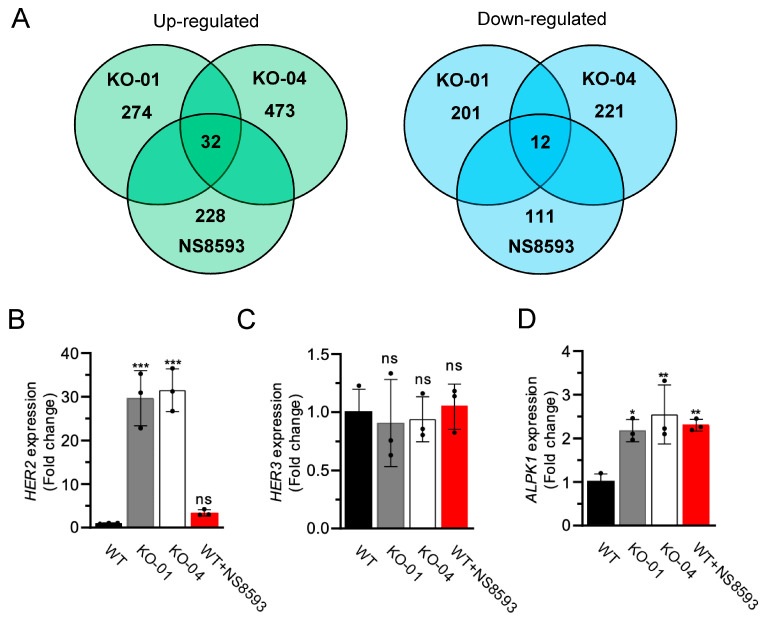
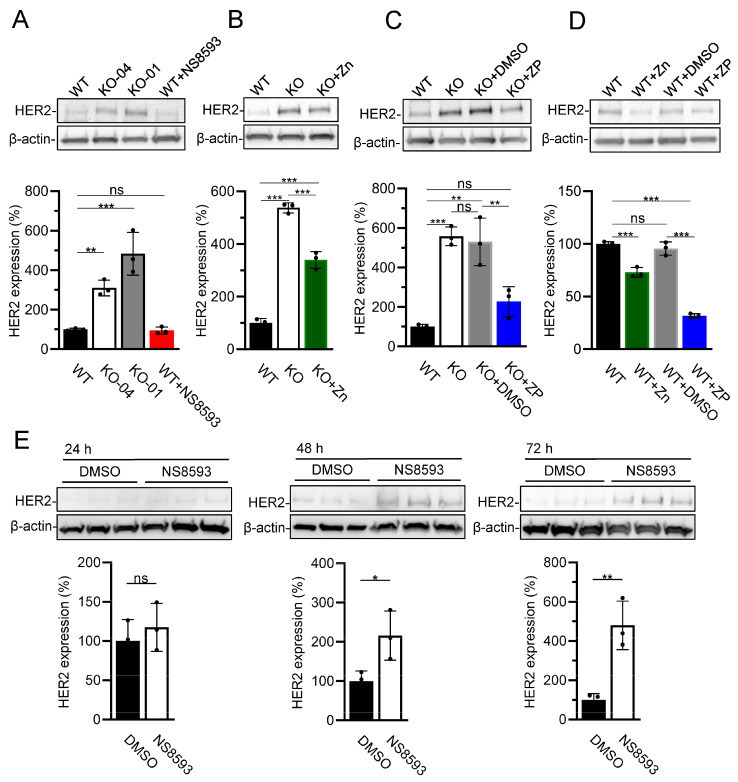
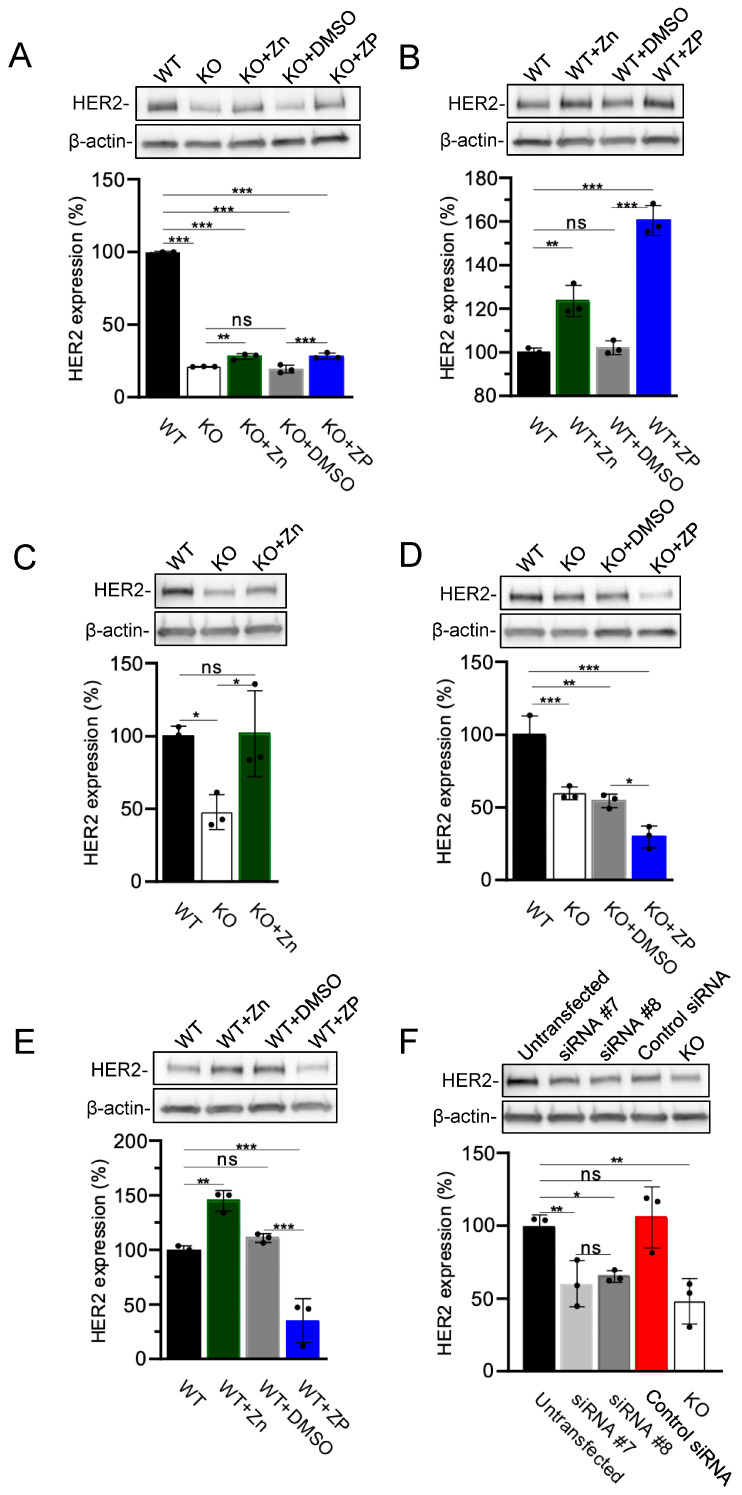
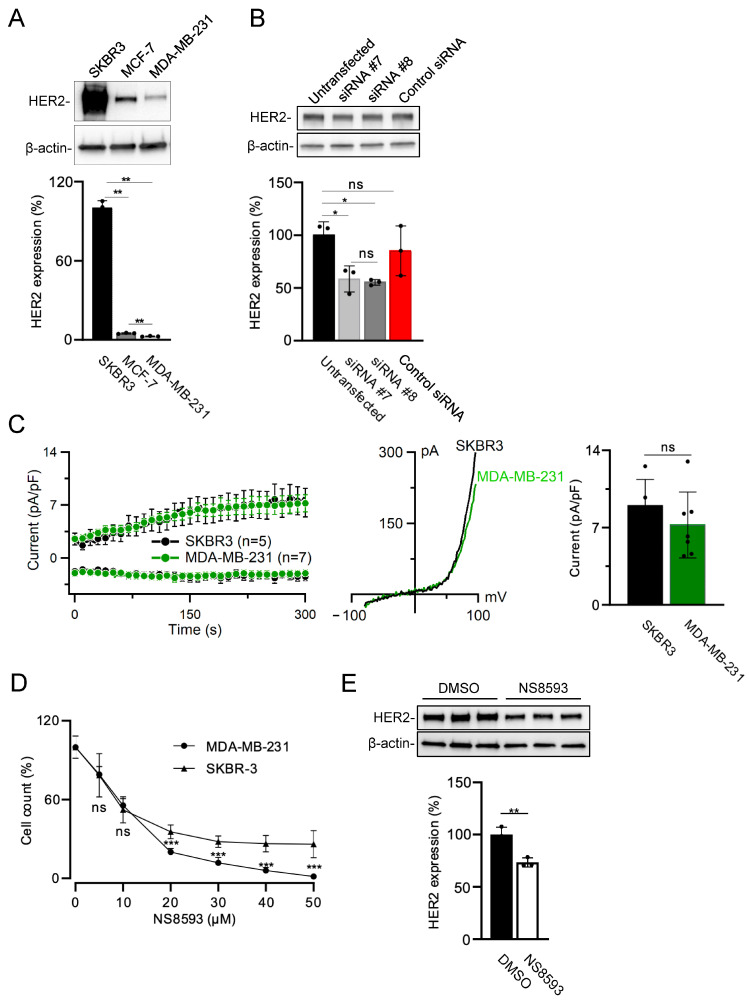
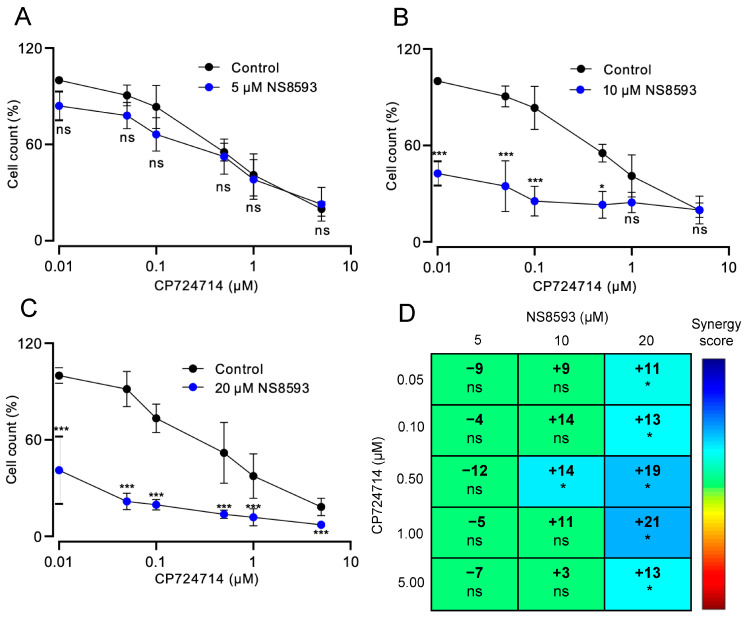
TRPM7 is a divalent cation-permeable channel that is highly active in cancer cells. The pharmacological inhibitors of TRPM7 have been shown to suppress the proliferation of tumor cells, highlighting TRPM7 as a new anticancer drug target. However, the potential benefit of combining TRPM7 inhibitors with conventional anticancer therapies remains unexplored. Here, we used genome-wide transcriptome profiling of human leukemia HAP1 cells to examine cellular responses caused by the application of NS8593, the potent inhibitor of the TRPM7 channel, in comparison with two independent knockout mutations in the TRPM7 gene introduced by the CRISPR/Cas9 approach. This analysis revealed that TRPM7 regulates the expression levels of several transcripts, including HER2 (ERBB2). Consequently, we examined the TRPM7/HER2 axis in several non-hematopoietic cells to show that TRPM7 affects the expression of HER2 protein in a Zn2+-dependent fashion. Moreover, we found that co-administration of pharmacological inhibitors of HER2 and TRPM7 elicited a synergistic antiproliferative effect on HER2-overexpressing SKBR3 cells but not on HER2-deficient MDA-MB-231 breast cancer cells. Hence, our study proposes a new combinatorial strategy for treating HER2-positive breast cancer cells.

Keywords: CP724714; ERBB2; HER2; NS8593; TRP channels; breast cancer; zinc.


Conflict of interest statement

The authors declare no conflicts of interest.

Figures

Figure 1
Figure 1
Assessment of human leukemia HAP1 cells. (A) Left panel: Whole-cell currents measured at −80 and +80 mV over time in WT (WT) and two TRPM7 KO (KO-01 and KO-04) HAP1 cell lines. Middle panel: Representative current−voltage (I−V) relationships obtained at 300 s in measurements illustrated on the Left panel. Right panel: Bar graphs of current amplitudes at +80 mV (300 s) illustrated on the Left panel. Data are mean ± SD; n, the number of cells examined. ** p ≤ 0.01 (one-way ANOVA). (B) Left panel: Whole-cell currents measured at −80 and +80 mV over time in WT HAP1 cells in the absence (Control) and the presence of 10 or 30 µM NS8593. Middle panel: Representative I−V relationships obtained at 300 s in measurements illustrated on the Left panel. Right panel: Bar graphs of current amplitudes at +80 mV (300 s) illustrated on the Left panel. Data are mean ± SD; n, the number of cells examined. *** p ≤ 0.001 (one-way ANOVA). (C,D) Proliferation rate of WT and TRPM7 KO-01 (C) and KO-04 (D) HAP1 cells. The cells were cultured for 3 days in the regular cell culture medium. The initial cell density (Day 0) was accounted as 100%. Data are mean ± SD of n = 3 independent experiments. *** p ≤ 0.001; ** p ≤ 0.01 (t-test). (E) Viability of WT HAP1 cells maintained in regular cell culture medium (Control) or medium with an additional 10 mM MgCl2 (Mg suppl) containing different concentrations of NS8593 for 72 h. Cell densities in the absence of NS8593 were accounted as 100%. Data are mean ± SD of n = 3 independent experiments. *** p ≤ 0.001; ** p ≤ 0.01; ns—not significantly different (t-test).
Figure 2
Figure 2
Genome-wide transcriptome profiling of HAP1 cells. (A) Venn diagrams for transcripts showing ≥1.5-fold up-regulation (Left panel) and down-regulation (Right panel) in TRPM7 KO-01 (KO-01), TRPM7 KO-04 (KO-04), and NS8593-treated WT (NS8593) HAP1 cells as compared to untreated WT HAP1 cells. (BD) Relative expression levels of HER2 (ERBB2) (B) and HER3 (ERBB3) (C) and ALPK1 (D), assessed by qRT-PCR approach in WT (WT), TRPM7 KO-01 (KO-01), TRPM7 KO-04 (KO-04), and NS8593-treated WT (WT+NS8593) HAP1 cells with HPRT as a reference transcript. Data are mean ± SD of n = 3 independent experiments. *** p ≤ 0.001; ** p ≤ 0.01; * p ≤ 0.05; ns—not significantly different (one-way ANOVA).
Figure 3
Figure 3
The impact of TRPM7 on HER2 expression levels in HAP1 cells. (A) HER2 expression in WT (WT), TRPM7 KO-04 (KO-04), TRPM7 KO-01 (KO-01), and NS8593-treated WT (WT+NS8593) HAP1 cells. (BD) Effects of 10 µM ZnCl2 (Zn) and 0.5 µM zinc pyrithione (ZP) on HER2 expression in WT (WT) and TRPM7 KO-04 (KO) HAP1 cells. (E) HER2 expression in WT HAP cells treated by 20 µM NS8593 for 24, 48, and 72 h. In (CE), equal DMSO volumes (DMSO) were used instead of ZP or NS8593. Upper panels: Representative western blots are shown. Equal volumes of cell lysates were assessed using anti-HER2 and anti-β-actin antibodies. Lower panels: Bar graphs showing normalized HER2 expression levels in experiments from the Upper panel. The ratio of HER2 and anti-β-actin signals in untreated WT HAP1 cells was accounted as 100%. The results shown in the bar graphs are mean ± SD of n = 3 independent experiments. In (AD), *** p ≤ 0.001; ** p ≤ 0.01; ns—not significantly different (one-way ANOVA). In (E), ** p ≤ 0.01; * p ≤ 0.05; ns—not significantly different (t-test).
Figure 4
Figure 4
The regulatory effect of TRPM7 on HER2 expression in embryonic trophoblast stem (TS) cells and HEK293 cells. (A,B) Assessment of HER2 expression in WT (WT) and TRPM7 KO (KO) TS cells. Upper panels: Representative western blots obtained with the cells cultured in the absence or presence of 10 µM ZnCl2 (Zn) and 0.5 µM zinc pyrithione (ZP) are shown. Equal volumes of cell lysates were assessed using anti-HER2 and anti-β-actin antibodies. Equal volumes of DMSO (DMSO) were used instead of ZP as an additional control. Lower panels: Bar graphs showing normalized HER2 expression levels in experiments in the Upper panels. The ratio of HER2 to anti-β-actin signals in WT TS cells was accounted as 100%. (CE) Assessment of HER2 expression in WT (WT) and TRPM7 KO (KO) HEK293 cells in the absence or presence of 10 µM ZnCl2 (Zn) and 0.5 µM zinc pyrithione (ZP). The experiments were performed and analyzed analogously to (A,B). (F) Analysis of HER2 expression in untransfected WT (Untransfected) HEK293 cells, WT HEK293 cells transfected by TRPM7-specific siRNA #7 (siRNA #7), TRPM7-specific siRNA #8 (siRNA #8) and AllStars Negative Control siRNA (Control siRNA), and TRPM7 KO (KO) HEK293 cells. Experiments were performed and analyzed analogously to (A,B) except that the ratio of HER2 to anti-β-actin signal in untransfected WT HEK293 cells was accounted as 100%. The results in the bar graphs are mean ± SD of n = 3 independent experiments. *** p ≤ 0.001; ** p ≤ 0.01; * p ≤ 0.05; ns—not significantly different (one-way ANOVA).
Figure 5
Figure 5
Assessment of breast cancer SKBR3, MCF-7, and MDA-MB-231 cells. (A) Analysis of HER2 expression in SKBR3, MCF-7, and MDA-MB-231 cells. Upper panel: Representative western blot obtained with SKBR3, MCF-7, and MDA-MB-231 cells. Equal volumes of cell lysates were assessed using anti-HER2 and anti-β-actin antibodies. Lower panel: Bar graph showing normalized HER2 expression levels in experiments from the Upper panel. The ratio of HER2 to anti-β-actin signal in SKBR3 cells was accounted as 100%. (B) Assessment of HER2 expression in untransfected (Untransfected) SKBR3 cells and SKBR3 cells transfected by TRPM7-specific siRNA #7 (siRNA #7), siRNA #8 (siRNA #8), and AllStars Negative Control siRNA (Control siRNA). Experiments were performed and analyzed analogously to (A) except that the ratio of HER2 to anti-β-actin signal in untransfected SKBR3 cells was accounted as 100%. The results in the bar graphs in (A,B) are mean ± SD of n = 3 independent experiments. ** p ≤ 0.01; * p ≤ 0.05; ns—not significantly different (one-way ANOVA). (C) Comparison of endogenous TRPM7 currents measured in SKBR3 and MDA-MB-231 cells. Left panel: Whole-cell currents measured at −80 and +80 mV over time in SKBR3 and MDA-MB-231 cells. Middle panel: Representative current−voltage (I−V) relationships obtained at 300 s in measurements shown in the Left panel. Right panel: Bar graph of current amplitudes at +80 mV (300 s) illustrated on the Left panel. Data are mean ± SD; n, the number of cells examined. Ns—not significantly different (t-test). (D) Viability of SKBR3 and MDA-MB-231 cells exposed to different concentrations of NS8593 for 72 h. Cell densities in the absence of NS8593 were accounted as 100%. Data are mean ± SD of n = 3 independent experiments. *** p ≤ 0.001; ns—not significantly different (t-test). (E) HER2 expression in SKBR3 cells treated by 30 µM NS8593 (NS8593) or equal volumes of DMSO (DMSO) for 72 h. Upper panel: Representative western blots are shown. Equal volumes of cell lysates were assessed using anti-HER2 and anti-β-actin antibodies. Lower panel: Bar graphs showing normalized HER2 expression level in experiments from the Upper panel. The results in the bar graphs are mean ± SD of n = 3 independent experiments. ** p ≤ 0.01 (t-test).
Figure 6
Figure 6
Combinatory treatment of SKBR3 cells by NS8593 and CP724714. (AC) Viability of SKBR3 cells treated by different concentrations of CP724714 for 72 h in the absence (Control) and presence of 5 µM (A), 10 µM (B), or 20 µM (C) NS8593. Data are mean ± SD of n = 3 independent experiments. *** p ≤ 0.001; * p ≤ 0.05; ns—not significantly different (one-way ANOVA). (D) LOEWE synergy analysis of the cytotoxic effects elicited by NS8593 and CP724714 on SKBR3 cells in (AC). * p ≤ 0.05; ns—not significantly different (one-way ANOVA).

Similar articles

Cited by

  • TRPM7 underlies cadmium cytotoxicity in pulmonary cells.
    Correia L, Shalygin A, Erbacher A, Zaisserer J, Gudermann T, Chubanov V. Correia L, et al. Arch Toxicol. 2025 Aug;99(8):3269-3281. doi: 10.1007/s00204-025-04058-4. Epub 2025 May 15. Arch Toxicol. 2025. PMID: 40369100 Free PMC article.

References

    1. Gotru S.K., Chen W., Kraft P., Becker I.C., Wolf K., Stritt S., Zierler S., Hermanns H.M., Rao D., Perraud A.-L., et al. TRPM7 Kinase Controls Calcium Responses in Arterial Thrombosis and Stroke in Mice. Arter. Thromb. Vasc. Biol. 2018;38:344–352. doi: 10.1161/ATVBAHA.117.310391. - DOI - PubMed
    1. Fleig A., Chubanov V. Handbook of Experimental Pharmacology. Springer; Berlin/Heidelberg, Germany: 2014. pp. 521–546. - PMC - PubMed
    1. Bates-Withers C., Sah R., Clapham D.E. TRPM7, the Mg2+ inhibited channel and kinase. Adv. Exp. Med. Biol. 2011;704:173–183. - PubMed
    1. Nadezhdin K.D., Correia L., Narangoda C., Patel D.S., Neuberger A., Gudermann T., Kurnikova M.G., Chubanov V., Sobolevsky A.I. Structural mechanisms of TRPM7 activation and inhibition. Nat. Commun. 2023;14:2639. doi: 10.1038/s41467-023-38362-3. - DOI - PMC - PubMed
    1. Nadler M.J.S., Hermosura M.C., Inabe K., Perraud A.-L., Zhu Q., Stokes A.J., Kurosaki T., Kinet J.-P., Penner R., Scharenberg A.M., et al. LTRPC7 is a Mg.ATP-regulated divalent cation channel required for cell viability. Nature. 2001;411:590–595. doi: 10.1038/35079092. - DOI - PubMed

Publication types

MeSH terms

LinkOut - more resources