. 2025 Jun;47(3):2973-2994.
doi: 10.1007/s11357-024-01418-3. Epub 2024 Nov 8.

The role of inflammation induced by necroptosis in the development of fibrosis and liver cancer in novel knockin mouse models fed a western diet

Affiliations

The role of inflammation induced by necroptosis in the development of fibrosis and liver cancer in novel knockin mouse models fed a western diet

Ramasamy Selvarani et al. Geroscience. 2025 Jun.

Abstract

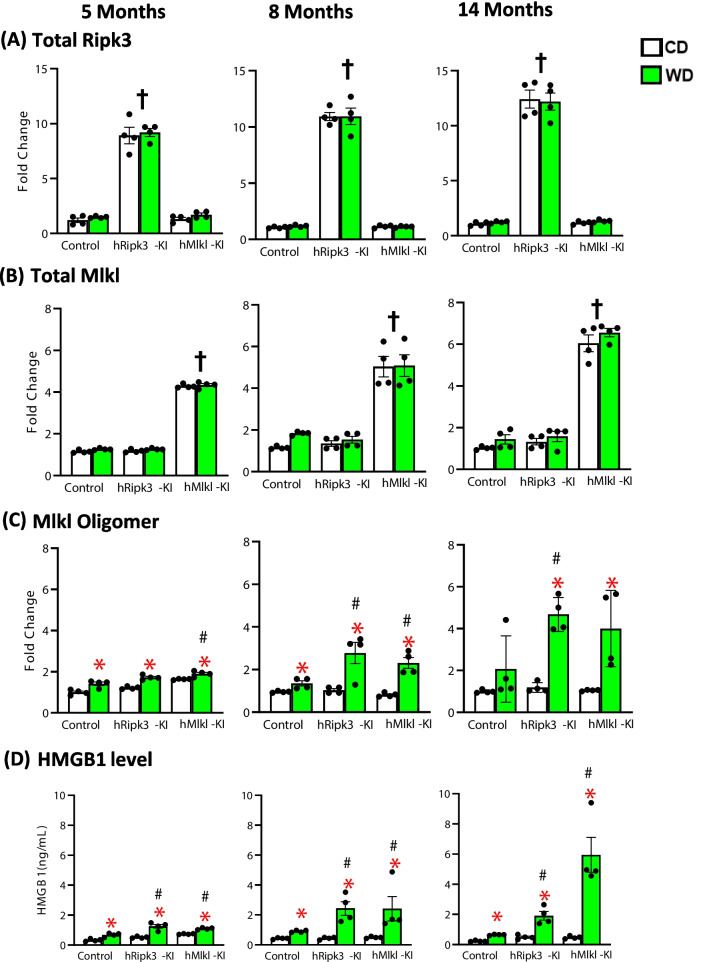
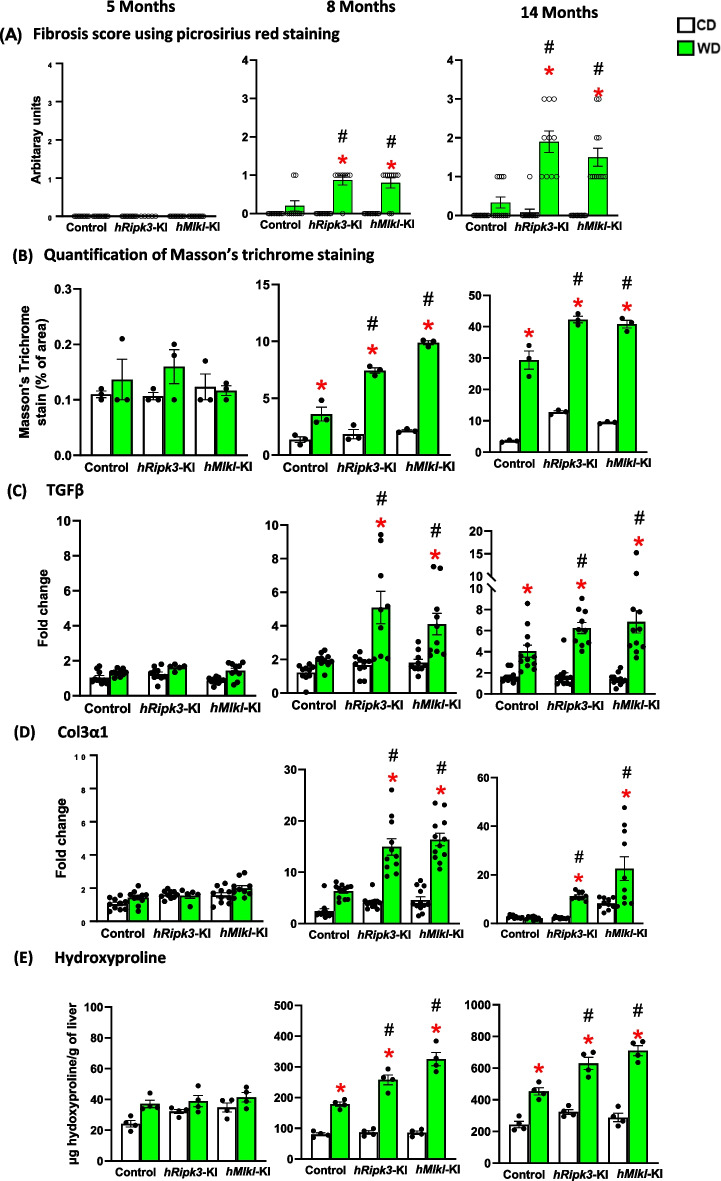
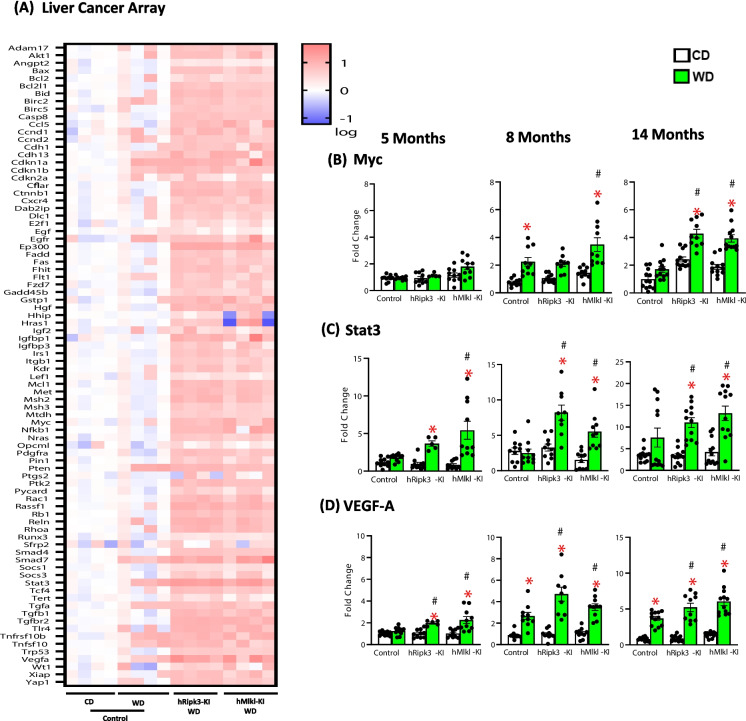
Non-resolving, chronic inflammation (inflammaging) is believed to play an important role in aging and age-related diseases. The goal of this study was to determine if inflammation induced by necroptosis arising from the liver plays a role in chronic liver disease (CLD) and liver cancer in mice fed a western diet (WD). Necroptosis was induced in liver using two knockin (KI) mouse models that overexpress genes involved in necroptosis (Ripk3 or Mlkl) specifically in liver (i.e., hRipk3-KI and hMlkl-KI mice). These mice and control mice (not overexpressing Ripk3 or Mlkl) were fed a WD (high in fat, sucrose, and cholesterol) starting at 2 months of age for 3, 6, and 12 months. Feeding the WD induced necroptosis in the control mice, which was further elevated in the hRipk3-KI and hMlkl-KI mice and was associated with a significant increase in inflammation in the livers of the hRipk3-KI and hMlkl-KI mice compared to control mice fed the WD. Overexpressing Ripk3 or Mlkl significantly increased steatosis and fibrosis compared to control mice fed the WD. Mice fed the WD for 12 months developed liver tumors (hepatocellular adenomas): 28% of the control mice developing tumors compared to 62% of the hRipk3-KI and hMlkl-KI mice. The hRipk3-KI and hMlkl-KI mice showed significantly more and larger tumor nodules. Our study provides the first direct evidence that inflammation induced by necroptosis arising from hepatocytes can lead to the progression of hepatic steatosis to fibrosis in obese mice that eventually results in an increased incidence in hepatocellular adenomas.

Keywords: Chronic liver disease; Hepatocellular adenoma; Liver cancer; Mixed lineage kinase domain–like protein (Mlkl); Receptor-interacting protein kinase (Ripk3).


Conflict of interest statement

Declarations. Conflict of interest: The authors declare no competing interests.

Figures

Fig. 1
Fig. 1
The effect of WD on necroptosis in hRipk3-KI and hMlkl-KI mice. The levels of Ripk3, Mlkl, and Mlkl-oligomers were measured by western blots (see Supplementary Figure S2 ) in hRipk3-KI and hMlkl-KI mice and compared to control mice fed either CD (white bars) or WD (green bars). The levels of Ripk3 (A) and Mlkl (B) normalized to GAPDH are expressed as fold change of Ripk3 or Mlkl expression at the three ages compared to control mice fed CD at 5 months of age. C The levels of Mlkl-oligomers (normalized to GAPDH) are expressed as fold change of Mlkl-oligomer expression in liver tissue compared to control mice fed CD at 5 months of age. Liver from a Sod1−/− mouse (Sod1KO sample) was used as a positive control on all blots, which allowed us to use this as a standard across all three blots. D Plasma HMGB1 levels (ng/mL) at 5, 8, and 14 months of age. All data were obtained from four mice/group, expressed as the mean ± SEM, and statistically analyzed using ANOVA. †Significant (p ≤ 0.001) difference between mice expressing the Ripk3 or hMlkl transgenes and other mice. *Significant (p ≤ 0.05) difference between mice fed CD and WD. #Significant (p ≤ 0.05) difference between control mice and hRipk3-KI or hMlkl-KI mice fed WD
Fig. 2
Fig. 2
The effect of WD on macrophages in the liver of hRipk3-KI and hMlkl-KI mice. Markers of macrophages were measured in livers of hRipk3-KI or hMlkl-KI mice and compared to control mice fed either CD (white bars) or WD (green bars). Transcript levels of the following markers of macrophages were normalized to β-microglobulin and expressed as fold change compared to control mice fed a CD diet at 5 months of age: total macrophages [F4/80, (A)], proinflammatory M1 macrophages [CD68, (B)], and anti-inflammatory M2 macrophages [CD206, (C)]. D Quantification of clusters of mononuclear cells from H&E staining (see Supplementary Figure S4) in liver tissue at 5, 8, and 14 months of age. The data were obtained from 5 to 12 mice/group and expressed as the mean ± SEM and were statistically analyzed using ANOVA. *Significance (p ≤ 0.05) difference between mice fed CD and WD. #Significance (p ≤ 0.05) difference between control mice and hRipk3-KI or hMlkl-KI mice fed WD
Fig. 3
Fig. 3
The effect of WD on the expression of chemokines and cytokines in the liver of hRipk3-KI and hMlkl-KI mice. A RT2 Profiler PCR Arrays of inflammatory cytokines and chemokines from four animals per group randomly selected from each of the four groups of animals. The intensity of red shows the increasing level of expression of the transcripts. Transcript levels of TNFα (B), IFNα2 (C), and CCL2 (D) from the livers of hRipk3-KI or hMlkl-KI mice and control mice fed either CD (white bars) or WD (green bars) at 5, 8, and 14 months of age. The data were obtained by rtPCR from 5 to 12 mice/group, normalized to β-microglobulin, and expressed as fold change compared to control mice fed CD at 5 months of age. The data are expressed as the mean ± SEM and were statistically analyzed using ANOVA. *Significance (p ≤ 0.05) difference between mice fed CD and WD. #Significance (p ≤ 0.05) difference between control mice and hRipk3-KI or hMlkl-KI mice fed WD
Fig. 4
Fig. 4
The effect of WD on steatosis in hRipk3-KI and hMlkl-KI mice. Steatosis was measured in the livers of hRipk3-KI and hMlkl-KI mice and compared to control mice fed either a CD (white bars) or WD (green bars) at 5, 8, and 14 months of age. A Steatosis score from H&E staining (see Supplementary Figure S5A) evaluated for both macro- and micro-vesicular steatosis with the severity of steatosis graded on the percentage of the total area affected using the following categories: 0 (< 5%), 1 (5–33%), 2 (33–66%), 3(> 66%). B The percent of area staining for Oil Red O as described in the Materials and Methods. C Liver triglycerides levels (mg/g) and D plasma triglycerides (mg/dL) were obtained from 5 to 12 mice/group. The data are expressed as the mean ± SEM and were statistically analyzed using ANOVA. *Significance (p ≤ 0.05) difference between mice fed CD and WD. #Significance (p ≤ 0.05) difference between control mice and hRipk3-KI or hMlkl-KI mice fed WD
Fig. 5
Fig. 5
The effect of WD on fibrosis in hRipk3-KI and hMlkl-KI mice. Fibrosis was measured in the livers of hRipk3-KI and hMlkl-KI mice and compared to control fed either a CD (white bars) or WD (green bars) at 5, 8, and 14 months of age. A Fibrosis score was obtained from Picrosirius red staining (see Supplementary Figure S6A) for 5–12 mice/group and based on the Brunt scoring system for the presence of pathologic collagen: 0 (none), 1 (mild perisinusoidal fibrosis), 2 (zone 3 periportal fibrosis), 3 (bridging fibrosis), 4 (cirrhosis). B Quantification from Masson’s trichrome staining was performed for three mice/group (see Supplementary Figure S6B). Transcript levels of TGFβ (C) and Col3α1 (D) were normalized to β-microglobulin and expressed as fold change compared to control mice fed a CD diet at 5 months of age for 5–12 mice/group. E Hydroxyproline levels (µg/g) obtained from four mice/group. The data are expressed as the mean ± SEM and were statistically analyzed using ANOVA. *Significance (p ≤ 0.05) difference between mice fed CD and WD. #Significance (p ≤ 0.05) difference between control mice and hRipk3-KI or hMlkl-KI mice fed WD
Fig. 6
Fig. 6
The effect of WD on cancer-related genes in the livers of hRipk3-KI and hMlkl-KI mice. A RT2 Profiler PCR Array of cancer-related genes from the livers 14-month-old control mice (Ripk3-KI or Mlkl-KI mice) fed either CD or WD and hRipk3-KI or hMlkl-KI mice fed WD. Four mice (two mice with and two mice without tumors) were randomly selected from each group with the intensity of red showing increased level of expression. Transcript levels of Myc (B), Stat3 (C), and VEGF-A (D) were measured by rtPCR at 5, 8, and 14 months of age from livers of hRipk3-KI or hMlkl-KI mice and control mice fed either CD (white bars) or WD (green bars). Data were obtained from 5 to 12 mice/group, normalized to β-microglobulin, and expressed as fold change compared to control mice fed CD diet at 5 months of age. The data are expressed as the mean ± SEM and were statistically analyzed using ANOVA. *Significance (p ≤ 0.05) difference between mice fed CD and WD. #Significance (p ≤ 0.05) difference between control mice and hRipk3-KI or hMlkl-KI mice fed WD
Fig. 7
Fig. 7
The effect of WD on the incidence of liver tumors in 14-month-old hRipk3-KI, hMlkl-KI, Ripk3-KI, and Mlkl-KI mice. A Mice with liver tumors were identified by the appearance of tumor nodules in the liver as shown. B The number of 14-month-old hRipk3-KI, Ripk3-KI, hMlkl-KI mice, and Mlkl-KI mice fed either CD or WD with or without the presence of tumors. To statistically analyze the tumor incidence, the Ripk3-KI and Mlkl-KI (control) and the hRipk3-KI and Mlkl-KI mice were combined into two groups. Using a one-tailed chi-square test to analyze these data, we show that the increased incidence liver tumors in the combined hRipk3-KI and hMlkl-KI mice (62%, 13/21) was significantly higher than in the combined control mice (28%, 5/18) at the p = 0.016 level. The average number of tumor nodules (C) or average number of large (> 5 mm) tumor nodules (D) in the liver of each mouse with a tumor is shown. The data are expressed as the mean ± SEM and were statistically analyzed using ANOVA. *Significance (p ≤ 0.05) difference between control mice and hRipk3-KI or hMlkl-KI mice. E H&E staining image from a tumor nodule showing the fibrous encapsulation around the tumor (arrows) by the sharp demarcation of the tumor from the surrounding parenchyma

Similar articles

Cited by

References

    1. Brubaker AL, Palmer JL, Kovacs EJ. Age-related dysregulation of inflammation and innate immunity: lessons learned from rodent models. Aging Dis. 2011;2(5):346–60. - PMC - PubMed
    1. Didier ES, et al. Immune correlates of aging in outdoor-housed captive rhesus macaques (Macaca mulatta). Immun Ageing. 2012;9(1):25. - PMC - PubMed
    1. Franceschi C, Campisi J. Chronic inflammation (inflammaging) and its potential contribution to age-associated diseases. J Gerontol A Biol Sci Med Sci. 2014;69(Suppl 1):S4-9. - PubMed
    1. Spaulding CC, Walford RL, Effros RB. Calorie restriction inhibits the age-related dysregulation of the cytokines TNF-α and IL-6 in C3B10RF1 mice. Mech Ageing Dev. 1997;93(1–3):87–94. - PubMed
    1. Masternak MM, et al. Dwarf mice and aging. Prog Mol Biol Transl Sci. 2018;155:69–83. - PubMed

Substances

LinkOut - more resources