

The Warburg Effect is the result of faster ATP production by glycolysis than respiration
- PMID: 39514306
- PMCID: PMC11573683
- DOI: 10.1073/pnas.2409509121
The Warburg Effect is the result of faster ATP production by glycolysis than respiration
Abstract
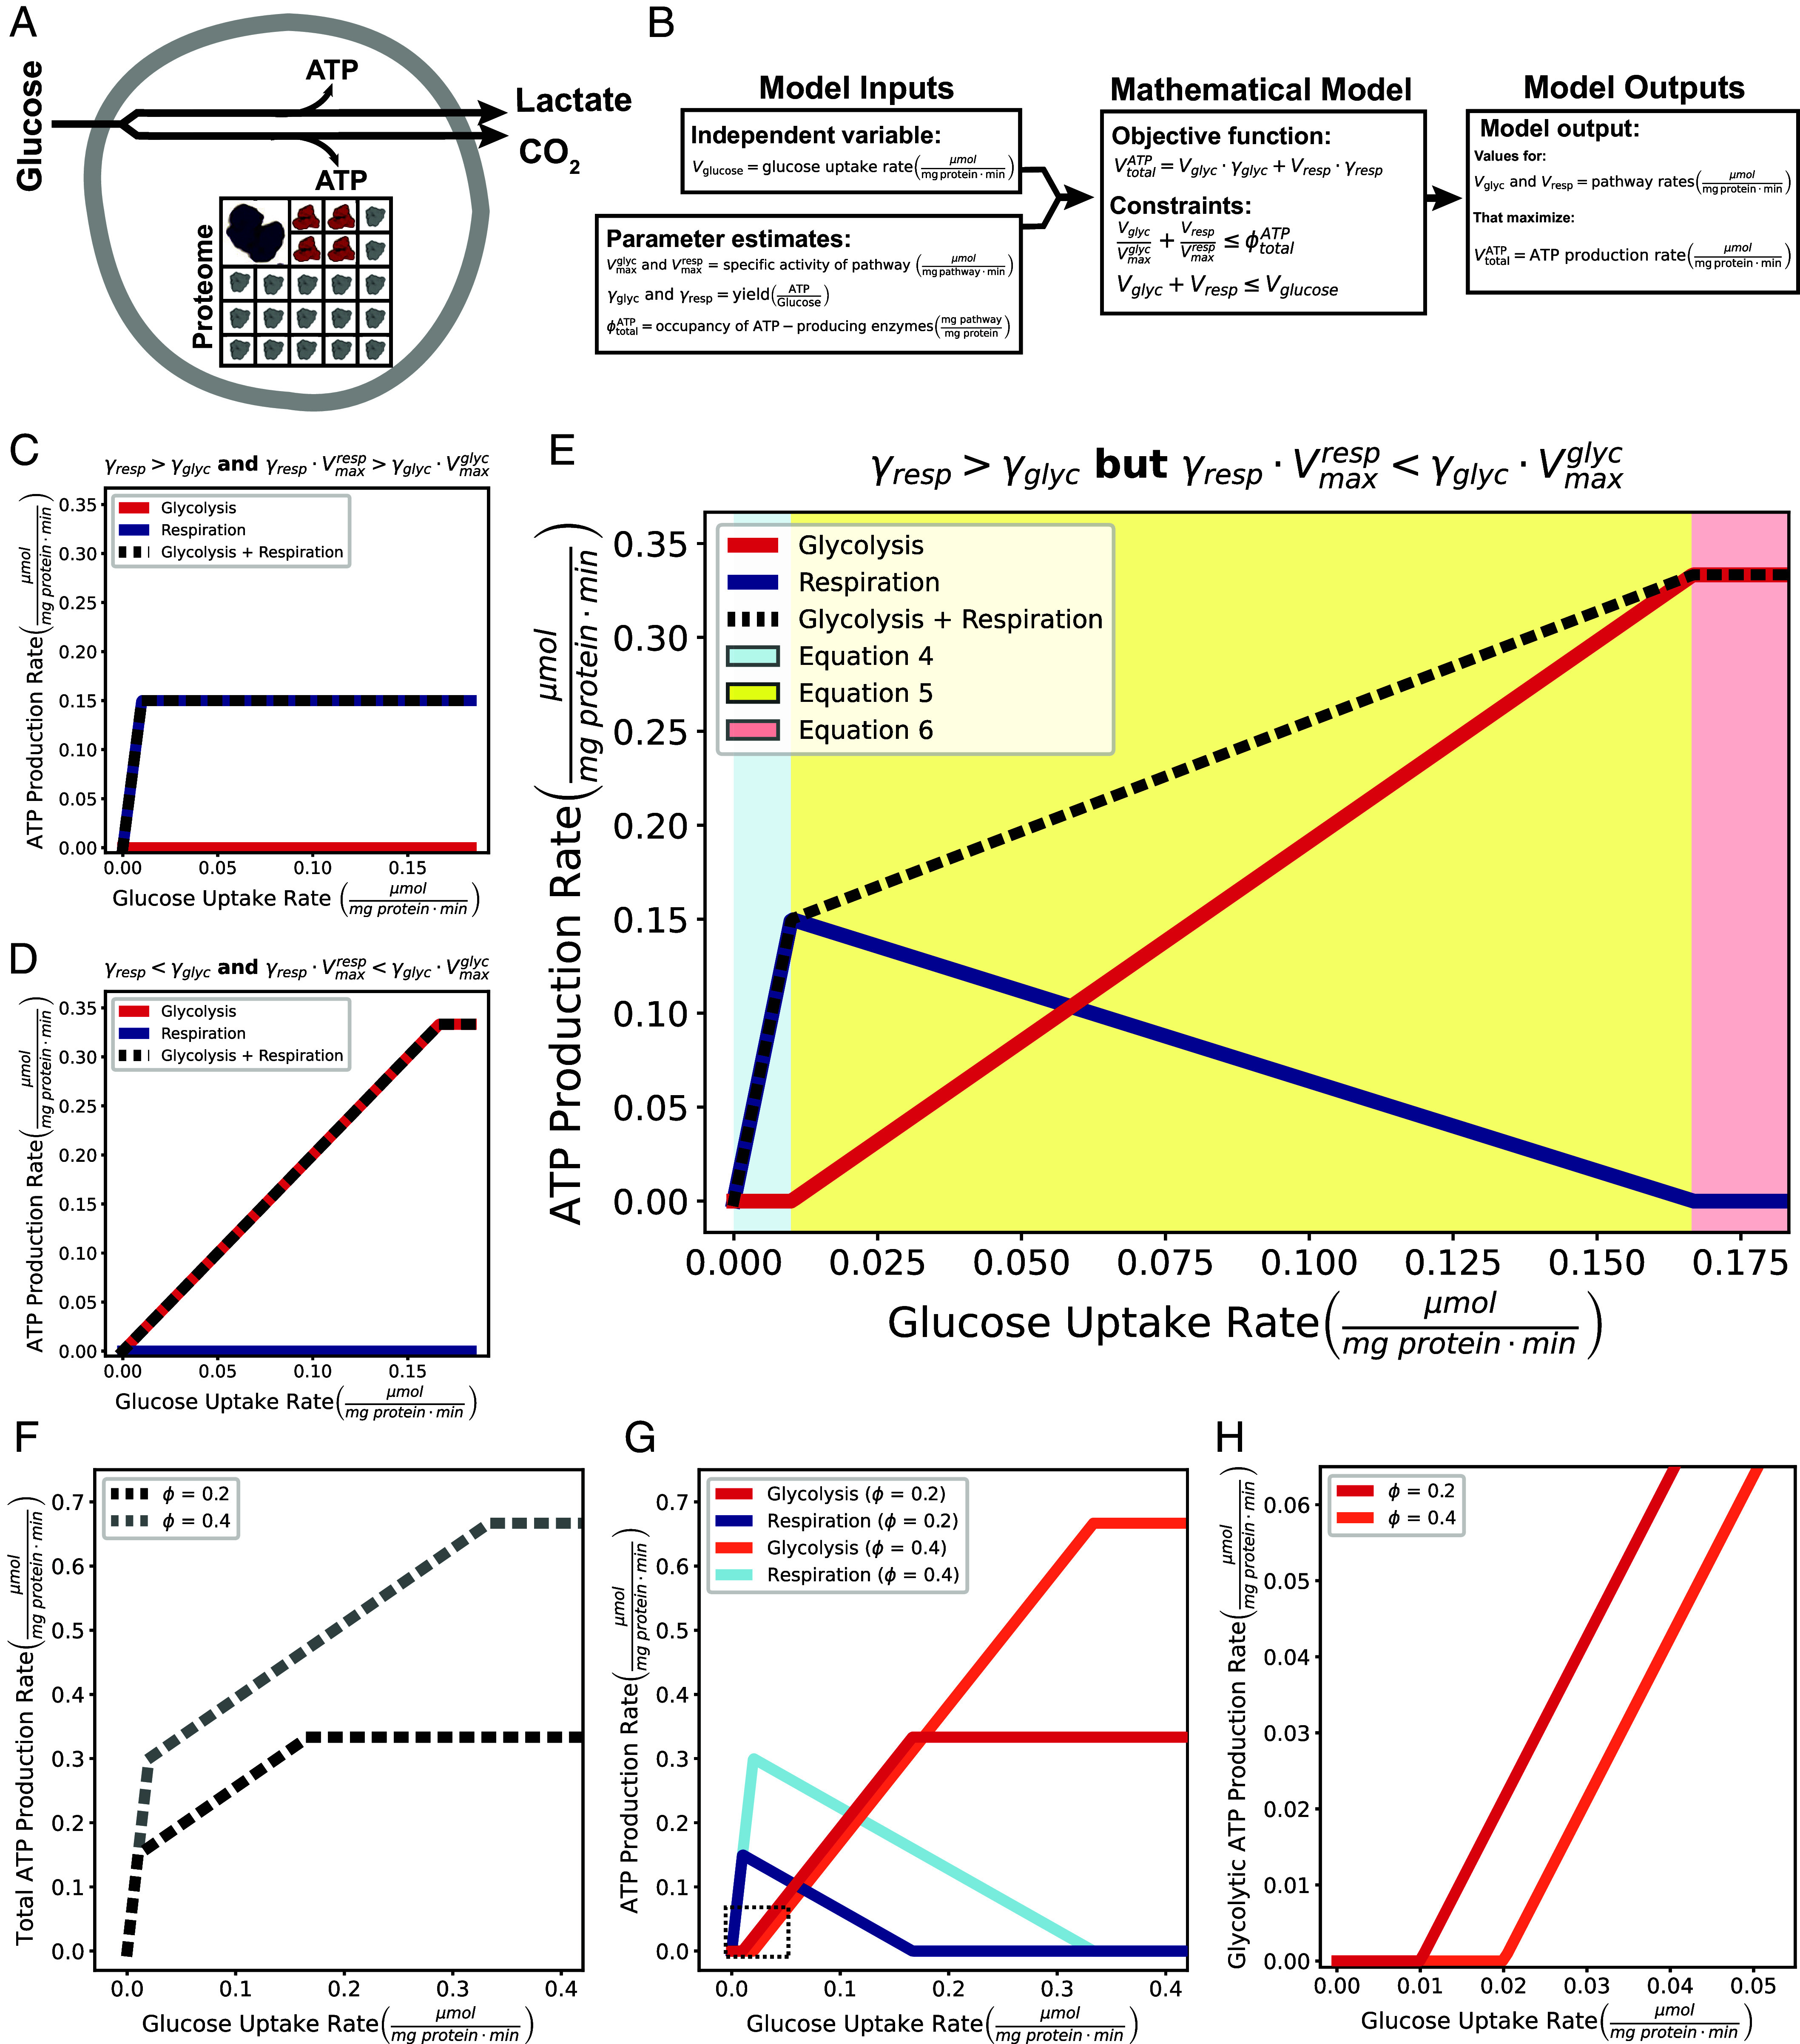
Many prokaryotic and eukaryotic cells metabolize glucose to organism-specific by-products instead of fully oxidizing it to carbon dioxide and water-a phenomenon referred to as the Warburg Effect. The benefit to a cell is not fully understood, given that partial metabolism of glucose yields an order of magnitude less adenosine triphosphate (ATP) per molecule of glucose than complete oxidation. Here, we test a previously formulated hypothesis that the benefit of the Warburg Effect is to increase ATP production rate by switching from high-yielding respiration to faster glycolysis when excess glucose is available and respiration rate becomes limited by proteome occupancy. We show that glycolysis produces ATP faster per gram of pathway protein than respiration in Escherichia coli, Saccharomyces cerevisiae, and mammalian cells. We then develop a simple mathematical model of energy metabolism that uses five experimentally estimated parameters and show that this model can accurately predict absolute rates of glycolysis and respiration in all three organisms under diverse conditions, providing strong support for the validity of the ATP production rate maximization hypothesis. In addition, our measurements show that mammalian respiration produces ATP up to 10-fold slower than respiration in E. coli or S. cerevisiae, suggesting that the ATP production rate per gram of pathway protein is a highly evolvable trait that is heavily optimized in microbes. We also find that E. coli respiration is faster than fermentation, explaining the observation that E. coli, unlike S. cerevisiae or mammalian cells, never switch to pure fermentation in the presence of oxygen.
Keywords: Warburg Effect; cancer metabolism; energy metabolism; modeling; systems biology.
Conflict of interest statement
Competing interests statement:The authors declare no competing interest.
Figures


Similar articles
-
Mathematical models for explaining the Warburg effect: a review focussed on ATP and biomass production.Biochem Soc Trans. 2015 Dec;43(6):1187-94. doi: 10.1042/BST20150153. Biochem Soc Trans. 2015. PMID: 26614659 Review.
-
Catabolic efficiency of aerobic glycolysis: the Warburg effect revisited.BMC Syst Biol. 2010 May 6;4:58. doi: 10.1186/1752-0509-4-58. BMC Syst Biol. 2010. PMID: 20459610 Free PMC article.
-
Enhancement of glutathione production by altering adenosine metabolism of Escherichia coli in a coupled ATP regeneration system with Saccharomyces cerevisiae.J Appl Microbiol. 2008 Feb;104(2):345-52. doi: 10.1111/j.1365-2672.2007.03415.x. Epub 2008 Jan 7. J Appl Microbiol. 2008. PMID: 18194260
-
Mitochondrial ATP generation is more proteome efficient than glycolysis.Nat Chem Biol. 2024 Sep;20(9):1123-1132. doi: 10.1038/s41589-024-01571-y. Epub 2024 Mar 6. Nat Chem Biol. 2024. PMID: 38448734 Free PMC article.
-
Revisiting the Crabtree/Warburg effect in a dynamic perspective: a fitness advantage against sugar-induced cell death.Cell Cycle. 2018;17(6):688-701. doi: 10.1080/15384101.2018.1442622. Cell Cycle. 2018. PMID: 29509056 Free PMC article. Review.
Cited by
-
Beyond nutritional immunity: immune-stressing challenges basic paradigms of immunometabolism and immunology.Front Nutr. 2025 Feb 12;12:1508767. doi: 10.3389/fnut.2025.1508767. eCollection 2025. Front Nutr. 2025. PMID: 40013164 Free PMC article. Review.
-
Decoding microglial immunometabolism: a new frontier in Alzheimer's disease research.Mol Neurodegener. 2025 Mar 27;20(1):37. doi: 10.1186/s13024-025-00825-0. Mol Neurodegener. 2025. PMID: 40149001 Free PMC article. Review.
-
MOB rules: Antibiotic Exposure Reprograms Metabolism to Mobilize Bacillus subtilis in Competitive Interactions.bioRxiv [Preprint]. 2024 Mar 20:2024.03.20.585991. doi: 10.1101/2024.03.20.585991. bioRxiv. 2024. PMID: 38562742 Free PMC article. Preprint.
-
Protocol to quantitatively assess glycolysis and related carbon metabolic fluxes using stable isotope tracing in Crabtree-positive yeasts.STAR Protoc. 2025 Jun 20;6(2):103786. doi: 10.1016/j.xpro.2025.103786. Epub 2025 Apr 22. STAR Protoc. 2025. PMID: 40266845 Free PMC article.
-
Robustness of mitochondrial biogenesis and respiration explain aerobic glycolysis.bioRxiv [Preprint]. 2024 Jul 5:2024.07.04.601975. doi: 10.1101/2024.07.04.601975. bioRxiv. 2024. PMID: 39005310 Free PMC article. Preprint.
References
MeSH terms
Substances
Grants and funding
LinkOut - more resources
Full Text Sources
Medical
