. 2025 Feb 1;85(3):567-584.
doi: 10.1158/0008-5472.CAN-24-1703.

Modeling Drug Responses and Evolutionary Dynamics Using Patient-Derived Xenografts Reveals Precision Medicine Strategies for Triple-Negative Breast Cancer

Affiliations

Modeling Drug Responses and Evolutionary Dynamics Using Patient-Derived Xenografts Reveals Precision Medicine Strategies for Triple-Negative Breast Cancer

Abigail Shea et al. Cancer Res. .

Abstract

The intertumor and intratumor heterogeneity of triple-negative breast cancers, which is reflected in diverse drug responses, interplays with tumor evolution. In this study, we developed a preclinical experimental and analytical framework using patient-derived tumor xenografts (PDTX) from patients with treatment-naïve triple-negative breast cancers to test their predictive value in personalized cancer treatment approaches. Patients and their matched PDTXs exhibited concordant drug responses to neoadjuvant therapy using two trial designs and dosing schedules. This platform enabled analysis of nongenetic mechanisms involved in relapse dynamics. Treatment resulted in permanent phenotypic changes, with functional and therapeutic consequences. High-throughput drug screening methods in ex vivo PDTX cells revealed patient-specific drug response changes dependent on first-line therapy. This was validated in vivo, as exemplified by a change in olaparib sensitivity in tumors previously treated with clinically relevant cycles of standard-of-care chemotherapy. In summary, PDTXs provide a robust tool to test patient drug responses and therapeutic regimens and to model evolutionary trajectories. However, high intermodel variability and permanent nongenomic transcriptional changes constrain their use for personalized cancer therapy. This work highlights important considerations associated with preclinical drug response modeling and potential uses of the platform to identify efficacious and preferential sequential therapeutic regimens. Significance: Patient-derived tumor xenografts from treatment-naïve breast cancer samples can predict patient drug responses and model treatment-induced phenotypic and functional evolution, making them valuable preclinical tools.


Conflict of interest statement

Y. Eyal-Lubling reports grants from European Union’s Horizon 2020 Research and Innovation Program under the Marie Sklodowska-Curie grant agreement No 895808 during the conduct of the study. G. Lerda reports other support from Cambridge Commonwealth, European, and International Trust during the conduct of the study. S. Wix reports grants from the Fulbright U.S. Student Program and Cambridge Trust during the conduct of the study. E. Provenzano reports personal fees from Roche and AstraZeneca and other support from IBEX Analytics outside the submitted work. K. McAdam reports personal fees from AstraZeneca and Pfizer outside the submitted work. C. Caldas reports grants and other support from AstraZeneca during the conduct of the study and other support from Illumina and grants from Genentech, Servier, and Roche outside the submitted work. No disclosures were reported by the other authors.

Figures

Figure 1.
Figure 1.
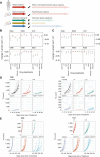
A preclinical platform of TNBC PDTXs. A, Clinical treatment and responses of the patient cohort from which the PDTX models used in this study were derived. B, Experimental framework of the coclinical trial. C, Top, correlation plots comparing GSEA enrichment scores (Hallmark and C6 gene sets) for models 1006, 1040, 1022, and 1141. Bottom, correlation plots comparing mutation VAFs for model 1006. Correlation was calculated between passages, sister mice, and multiple regions of the same tumor using Spearman correlation.
Figure 2.
Figure 2.
A coclinical trial framework reveals concordant patient–PDTX drug responses. A, Experimental framework (consisting of two trial designs) and associated analytical approach, with modeling metrics used to assess drug response. B and C, TV growth curves displaying linear mixed model fits of trial designs 1 (B) and 2 (C) over treatment duration. Treatment arm for each PDTX model corresponds to the clinical treatment of the matched patient. D and E, Analytical metrics derived from mathematical modeling (as in A). Change in growth rate (top) and estimated difference in the AUC (bottom) for trial design 1 (D) and growth rate under treatment (top) and predicted volume at treatment end (bottom) for trial design 2 (E). F, Box plots displaying growth rate under treatment (top) and predicted volume at treatment end (bottom) for trial design 2 between pCR and non-pCR models. Statistical significance is calculated using the Wilcoxon test.
Figure 3.
Figure 3.
PDTXs identify patient-specific drug responses and model patient- and treatment-specific regrowth dynamics. A, Experimental framework to test drug responses to alternative treatments and regrowth dynamics. B and C, Mean difference in daily growth rate between the treated and untreated groups during treatment (B) and after treatment has ceased (C). D and E, TV growth curves displaying linear mixed model fits of PDTX models 1040 (left) and 1141 (right) during treatment (D) and after treatment has ceased (E). T–UT, treated–untreated.
Figure 4.
Figure 4.
Short-term olaparib treatment does not cause major genomic changes. A, Growth curves displaying raw data of model 1006 treated with olaparib for 11 weeks (purple) or untreated controls (black). Dotted line indicates end of treatment, after which, tumors were left to progress until size limits. B, Correlation plots comparing mean VAFs of mutations between untreated and treated (left) or untreated and post-treated (right) samples. R value calculated using the Spearman correlation. C, Heatmap displaying VAFs of depleted and emergent mutations in each sample. Columns indicate samples (labeled by mouse number and intratumor region). OC, oncogenic classification as predicted by Cancer Genome Interpreter.
Figure 5.
Figure 5.
Olaparib treatment causes permanent phenotypic changes due to TF reprogramming. A, Heatmap displaying z-score (scaled by row) of the top 250 strong and variable genes. Clustering analysis performed using Euclidean distances. Columns indicate PDTX samples (labeled by mouse number). B, Top 10 significant gene sets by normalized enrichment score (NES) between untreated and post-treated samples, identified by GSEA (Hallmark gene sets). DN, down. C, IHC for phenotypic markers. D, Western blot for E-cadherin and vimentin. E, scRNA-seq data of all cells analyzed post-QC. Color indicates cell states (groups of MCs). F, Average gene expression (number of UMIs per 1,000 UMIs) of key markers across MCs. G, Percentage of cells from each condition that reside in each cell state. Immune-Act, immune activation. H, Top, epithelial and mesenchymal scores for individual MCs. Bottom, MC composition of each strata using mesenchymal minus epithelial scores to stratify MCs into 5 groups (EMT1–5). I, Top, mesenchymal and IER scores for individual MCs. Bottom, MC composition of each strata using the IER score to stratify MCs into 4 groups (IER1–4). J and K, Mean enrichment (log2 gene enrichment score) across strata for TFs of interest: EMT1–5 (J) and IER1–4 (K).
Figure 6.
Figure 6.
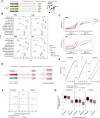
In vivo treatment causes permanent changes to a tumor’s drug response profile. A, Experimental framework of in vivo and ex vivo drug response profiling. B, High-throughput drug screening data of dissociated PDTX cells. AUC plots display the response of each tumor to drugs tested ex vivo. Color indicates the in vivo treatment to which each tumor was previously exposed. C, Dose–response curves of models 1040 (top) and 1141 (bottom) to olaparib and BMN-673. Plots compare the untreated PDTX tumors (black) to those previously treated in vivo with CT (red). D, Experimental framework to test alternative sequencing strategies of CT and olaparib in vivo using model 1040. Untreated PDTX tumors and those previously treated with CT or olaparib were each passaged into three cohorts of mice. These mice were left untreated or subsequently exposed to CT or olaparib. E, Estimated mean tumor growth for each experimental group. Panels display previous treatment groups (first-line treatment), and lines within each panel display the cohort of second-line treatment. F, Estimated log-daily growth rate of PDTX tumors, as predicted by the linear mixed models. Column panels display previous treatment groups (first-line treatment), and lines within each panel display the cohort of second-line treatment. G, Predicted tumor (log) volume at treatment end of each cohort treated sequentially with no treatment, CT, or olaparib based on the linear mixed models. Panels display previous treatment groups (first-line treatment), and boxes within each panel display the cohort of second-line treatment.

References

    1. Perou CM, Sorlie T, Eisen MB, van de Rijn M, Jeffrey SS, Rees CA, et al. . Molecular portraits of human breast tumours. Nature 2000;406:747–52. - PubMed
    1. Sørlie T, Perou CM, Tibshirani R, Aas T, Geisler S, Johnsen H, et al. . Gene expression patterns of breast carcinomas distinguish tumor subclasses with clinical implications. Proc Natl Acad Sci U S A 2001;98:10869–74. - PMC - PubMed
    1. Sorlie T, Tibshirani R, Parker J, Hastie T, Marron JS, Nobel A, et al. . Repeated observation of breast tumor subtypes in independent gene expression data sets. Proc Natl Acad Sci U S A 2003;100:8418–23. - PMC - PubMed
    1. Curtis C, Shah SP, Chin SF, Turashvili G, Rueda OM, Dunning MJ, et al. . The genomic and transcriptomic architecture of 2,000 breast tumours reveals novel subgroups. Nature 2012;486:346–52. - PMC - PubMed
    1. Dvinge H, Git A, Gräf S, Salmon-Divon M, Curtis C, Sottoriva A, et al. . The shaping and functional consequences of the microRNA landscape in breast cancer. Nature 2013;497:378–82. - PubMed

LinkOut - more resources