. 2024 Dec;11(47):e2405705.
doi: 10.1002/advs.202405705. Epub 2024 Nov 8.

Piezo1 Regulates Stiffness-Dependent DRG Axon Regeneration via Modifying Cytoskeletal Dynamics

Affiliations

Piezo1 Regulates Stiffness-Dependent DRG Axon Regeneration via Modifying Cytoskeletal Dynamics

Mengshi Lei et al. Adv Sci (Weinh). 2024 Dec.

Abstract

Despite medical interventions, the regenerative capacity of the peripheral nervous system is limited. Dorsal root ganglion (DRG) neurons possess the capacity to detect mechanical signals from their microenvironment, but the impact and mechanism by which these signals regulate axon regrowth and even regeneration in DRG neurons remain unclear. In this study, DRG neurons from newborn rats are cultured on substrates with varying degrees of stiffness in vitro to investigate the role of mechanical signals in axon regrowth. The findings reveal that substrate stiffness plays a crucial role in regulating axon regrowth, with an optimal stiffness required for this process. In addition, the data demonstrate that Piezo1, a mechanosensitive cation channel, detects substrate stiffness at the growth cone and regulates axon regrowth through activating downstream Ca2+-CaMKII-FAK-actin cascade signaling pathway. Interestingly, knocking down Piezo1 in adult rat DRG neurons leads to enhanced axon regeneration and accelerated recovery of sensory function after sciatic nerve injury. Overall, these findings contribute to the understanding of the role of mechanical signals in axon regeneration and highlight microenvironmental stiffness as a promising therapeutic target for repairing nerve injuries.

Keywords: DRG neurons; Piezo1; axon regeneration; substrate stiffness.


Conflict of interest statement

The authors declare no conflict of interest.

Figures

Figure 1
Figure 1
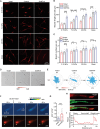
Substrate stiffness‐mediated Ca2+ activities modulates DRG axon regrowth. A) Experimental process of in vitro axon regeneration assay on different stiffness PA gels. B–D) Representative images (B) and quantification of neurite length (C) and branch number (D) per neuron cultured on 0.15, 5.0, and 20 kPa PA gels, and glass slides for 24 h. Each point on the panel represents the average total neurite length and branch number of a neuron per image containing 6–10 DRG neurons. E) Experimental process of in vitro axon guidance assay on gradient stiffness PA gels. F,G) Representative images (F) and angular displacement (G) of DRG axons on gradient stiffness PA gels for 1 day. 0° and 180° represent the soft side and stiff side, respectively. H) Representative real‐time calcium images of DRG neurons cultured on 0.15 kPa PA gels for 24 h, with neurite retraction events indicated by orange and white arrows. The arrows mark the initial positions of the retracted neurite terminals. I,J) Quantification of number of Ca2+‐increased neurite terminal (I) and neurite retraction events per neuron (J) cultured on 0.15, 5.0, and 20 kPa PA gels, and glass slides for 24 h. K) Representative real‐time calcium images of neurite terminal on glass slides for 1 day. The first and second‐row images on the right exhibit the retraction (Re.) terminal and static (St.) terminal, and the third and fourth‐row images exhibit the extension (Ex.) terminal. The first and third‐row images on the right display calcium fluorescence intensity; the second and fourth‐row images on the right display the CV of calcium intensity. The dotted lines indicate the initial morphology of neurite terminals. L,M) Representative traces of Ca2+ activity (L) and quantification of Ca2+ transient events per min (M) at neurite terminals undergoing retraction, extension, and stalling. Error bars denote mean ± SEM; *, p < 0.05; **, p < 0.01; ***, p < 0.001; ****, p < 0.0001, as determined by one‐way ANOVA (C–J) or two‐tailed Student's t‐test (M).
Figure 2
Figure 2
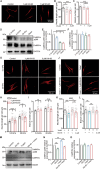
Piezo1‐mediated Ca2+ activities modulate stiffness‐dependent DRG axon regrowth. A–C) Representative images (A) and quantification of neurite length (B) and branch number (C) per neuron cultured on different substrate stiffness and incubated with media (control), 5 µm GsMTx4 or 30 µm Yoda1 for 24 h. D,E) Representative images (D) and angular displacement (E) of DRG axons cultured on gradient stiffness PA gels and incubated with media (control), 5 µm GsMTx4 or 30 µm Yoda1 for 24 h. F) Representative calcium (top) and F‐actin (bottom) images of DRG neurites cultured on glass slides for 24 h and stimulated with 30 µm Yoda1. The initial and real‐time positions of the neurite terminal are indicated by white and yellow arrows, respectively. G) Quantification of Yoda1‐induced calcium ΔF/F at neurite shaft and terminal as ascribed in panel F). ΔF/F, (F Yoda1F basal)/Fbasal, basal (F basal), and Yoda1 stimulated fluorescence intensity (F Yoda1) of neurite was calculated. H,I) Representative immunofluorescence images of Piezo1 and F‐actin (H) and Piezo1 fluorescence intensity along the direction of neuron soma‐axon shaft‐growth cone (I). Error bars denote mean ± SEM; **, p < 0.01; ***, p < 0.001; ****, p < 0.0001, as determined by two‐tailed Student's t‐test.
Figure 3
Figure 3
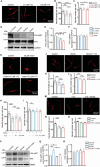
CaMKII serves as a downstream effector of stiffness and Piezo1 regulates DRG axon regrowth. A–C) Representative images (A) and quantification of neurite length (B) and branch number (C) per neuron cultured on glass slides and treated with media (control), 1 µm KN‐93 or 3 µm KN‐93 for 24 h. D–F) Western blots (D) and quantification of CaMKIIα p286 (E), CaMKIIα (F) in whole cell lysis of DRG neurons seeded on different stiffness substrates, GAPDH used as the reference protein. G–I) Representative images (G) and quantification of neurite length (H) and branch number (I) per neuron cultured on 5.0 and 20 kPa PA gels and treated with media (control), 1 µm KN‐93 or 3 µm KN‐93 for 24 h. J–L) Representative images (J) and quantification of neurite length (K) and branch number (L) per neuron cultured on glass slides and treated with media (control), 30 µm Yoda1 and/or 1 µm KN‐93, 3 µm KN‐93 for 24 h. M–O) Western blots (M) and quantification of CaMKIIα p286 (N), CaMKIIα (O) in whole cell lysis of DRG neurons seeded on glass slides and treated with media (control), 3 µm KN‐93 and/or 30 µm Yoda1 for 24 h, GAPDH used as the reference protein. Error bars denote mean ± SEM; *, p < 0.05; **, p < 0.01; ***, p < 0.001; ****, p < 0.0001, as determined by one‐way ANOVA (E–F) or two‐tailed Student's t‐test (B, C, and H–O).
Figure 4
Figure 4
FAK acts as a downstream effector of Piezo1 and CaMKII to regulate DRG axon regrowth. A–C) Representative images (A) and quantification of neurite length (B) and branch number (C) per neuron cultured on glass slides and treated with media (control), 0.1 µm Y15 or 0.2 µm Y15 for 24 h. D–F) Western blots (D) and quantification of FAK p397 (E), FAK (F) in whole cell lysis of DRG neurons seeded on different stiffness substrates, GAPDH used as the reference protein. G–I) Representative images (G) and quantification of neurite length (H) and branch number (I) per neuron cultured on glass slides and treated with media (control), 30 µm Yoda1 and/or 0.1 µm Y15, 0.2 µm Y15 for 24 h. J–L) Representative images (J) and quantification of neurite length (K) and branch number (L) per neuron cultured on glass slides and treated with media (control), 3 µm KN‐93, and/or 0.3 µm Y15 for 24 h. M–O) Representative images (M) and quantification of neurite length (N) and branch number (O) per neuron cultured on glass slides and treated with media (control), 0.3 µm Y15 and/or 3 µm KN‐93 for 24 h. P–R) Western blots (P) and quantification of FAK p397 (Q), FAK (R) in whole cell lysis of DRG neurons seeded on glass slides and treated with media (control), 30 µm Yoda1 and/or 3 µm KN‐93 for 24 h, GAPDH used as the reference protein. Error bars denote mean ± SEM; *, p < 0.05; **, p < 0.01; ***, p < 0.001; ****, p < 0.0001, as determined by one‐way ANOVA (E–F) or two‐tailed Student's t‐test (B, C and H–R).
Figure 5
Figure 5
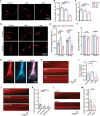
F‐actin retrograde flow controls DRG axon regrowth. A–C) Representative images (A) and quantification of neurite length (B) and branch number (C) per neuron cultured on glass slides and treated with media (control), 0.1 µm LatA or 0.1 µm Jasp for 24 h. D–F) Representative images (D) and quantification of neurite length (E) and branch number (F) per neuron cultured on 5.0 and 20 kPa PA gels and treated with media (control), 0.1 µm LatA or 0.1 µm Jasp for 24 h. G) Representative images of F‐actin in growth cone showing the dynamics of actin over a period of 5 min. H,I) Representative images (H) and quantification of F‐actin retrograde flow velocity (I) in growth cone of DRG cultured on glass slides and treated with media (control), 0.5 µm LatA, or 0.5 µm Jasp before recording. J,K) Representative images (J) and quantification of F‐actin retrograde flow velocity (K) in growth cone of DRG cultured on glass slides and treated with media (control), 5 µm Ionomycin, or 1 µm BAPTA‐AM before recording. L,M) Representative images (L) and quantification of F‐actin retrograde flow velocity (M) in the growth cone of DRG cultured on glass slides and treated with media (control) or 30 µm Yoda1 before recording. Error bars denote mean ± SEM; *, p < 0.05; **, p < 0.01; ***, p < 0.001; ****, p < 0.0001, as determined by two‐tailed Student's t‐test.
Figure 6
Figure 6
Piezo1‐CaMKII‐FAK signaling cascade regulates repair after axon injury in vivo. A) Experimental process of intrathecal injection (ITI) virus and in vitro axon regeneration assay performed in adult rats. B–D) Representative images (B) and quantification of neurite length (C) and branch number (D) per neuron infected with control (Scramble shRNA) or Piezo1 knockdown (Piezo1 shRNA) virus and cultured on 5.0 kPa PA gels for 48 h. E) Experimental process of SNI and ethology assay. F) Relative Piezo1, CaMKIIα, Fak mRNA expression of DRG in control (without injury) or day 3 after SNI rats, Gapdh used as reference gene. G,H) Western blots (G) and quantification (H) of CaMKIIα p286 and CaMKIIα, FAK p397, and FAK at the SNI site with 3 days post‐injury or 30 min post‐injury, α‐tubulin used as the reference protein. I,J) Representative immunofluorescence images of SCG10 at longitudinal sections (I) and quantification of relative SCG10 intensity plotted in function of the distance from the injury site (J) in control and Piezo1 knockdown DRGs. The injury site is indicated by dotted line, n = 4 for each column. K,L) Summary graphs of rat 50% paw withdrawal mechanical threshold (K) and thermal withdrawal latency (L) of DRGs infected with scramble or Piezo1 shRNA. Each point in (K and L) denotes experiments from an individual rat, n = 12 for each column. M,N) Representative immunofluorescence images of SCG10 at longitudinal sections (M) and quantification of relative SCG10 intensity plotted in function of the distance from the injury site (N) in control (corn oil), 300 µm Yoda1, 10 µm KN‐93 or 10 µm Y15 treatment DRGs. The injury site is indicated by a dotted line, n = 4 for each column. Error bars denote mean ± SEM; *, p < 0.05; **, p < 0.01; ***, p < 0.001; ****, p < 0.0001, as determined by two‐tailed Student's t‐test.
Figure 7
Figure 7
Piezo1‐CaMKII‐FAK‐actin signaling cascade regulates DRG axon regeneration in the growth cone. A proposed model for the substrate stiffness‐mediated DRG axon regrowth/regeneration through Piezo1‐CaMKII‐FAK‐actin signaling cascade. The diagram in the top left depicts the relationship between substrate stiffness (orange), Piezo1/ Ca2+ activity (green), CaMKII/FAK activity (purple), F‐actin retrograde flow velocity (red), and DRG axon regeneration ability. We suggest that achieving an optimum condition of substrate stiffness, Piezo1/ Ca2+ activity and CaMKII/FAK activity is essential for optimal F‐actin retrograde flow velocity and ultimately promoting optimal axon regrowth/regeneration.

References

    1. Mahar M., Cavalli V., Nat. Rev. Neurosci. 2018, 19, 323. - PMC - PubMed
    1. Hilton B. J., Husch A., Schaffran B., Lin T. C., Burnside E. R., Dupraz S., Schelski M., Kim J., Muller J. A., Schoch S., Imig C., Brose N., Bradke F., Neuron 2022, 110, 51. - PMC - PubMed
    1. Winter C. C., He Z., Jacobi A., Cold Spring Harb Perspect Biol. 2022, 14, a040923. - PMC - PubMed
    1. Li Y., He X., Kawaguchi R., Zhang Y., Wang Q., Monavarfeshani A., Yang Z., Chen B., Shi Z., Meng H., Zhou S., Zhu J., Jacobi A., Swarup V., Popovich P. G., Geschwind D. H., He Z., Nature 2020, 587, 613. - PMC - PubMed
    1. Pinto‐Costa R., Sousa S. C., Leite S. C., Nogueira‐Rodrigues J., Ferreira da Silva T., Machado D., Marques J., Costa A. C., Liz M. A., Bartolini F., Brites P., Costell M., Fassler R., Sousa M. M., J. Clin. Invest. 2020, 130, 2024. - PMC - PubMed

LinkOut - more resources