. 2024 Nov 8;19(11):e0312104.
doi: 10.1371/journal.pone.0312104. eCollection 2024.

Mechanisms of rapid plant community change from the Miocene Succor Creek flora, Oregon and Idaho (USA)

Affiliations

Mechanisms of rapid plant community change from the Miocene Succor Creek flora, Oregon and Idaho (USA)

Christopher M Schiller et al. PLoS One. .

Abstract

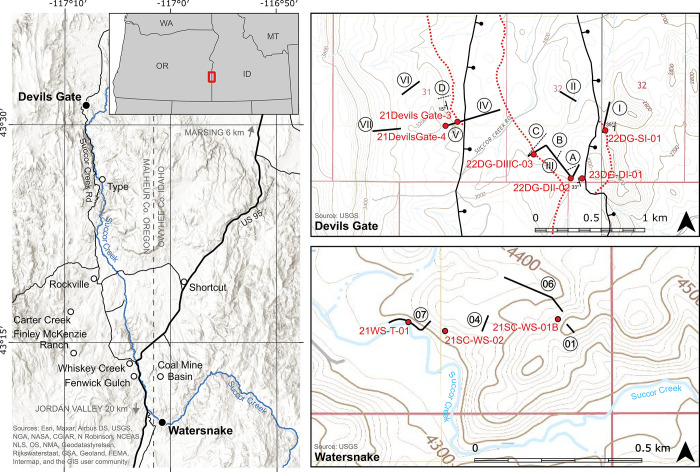
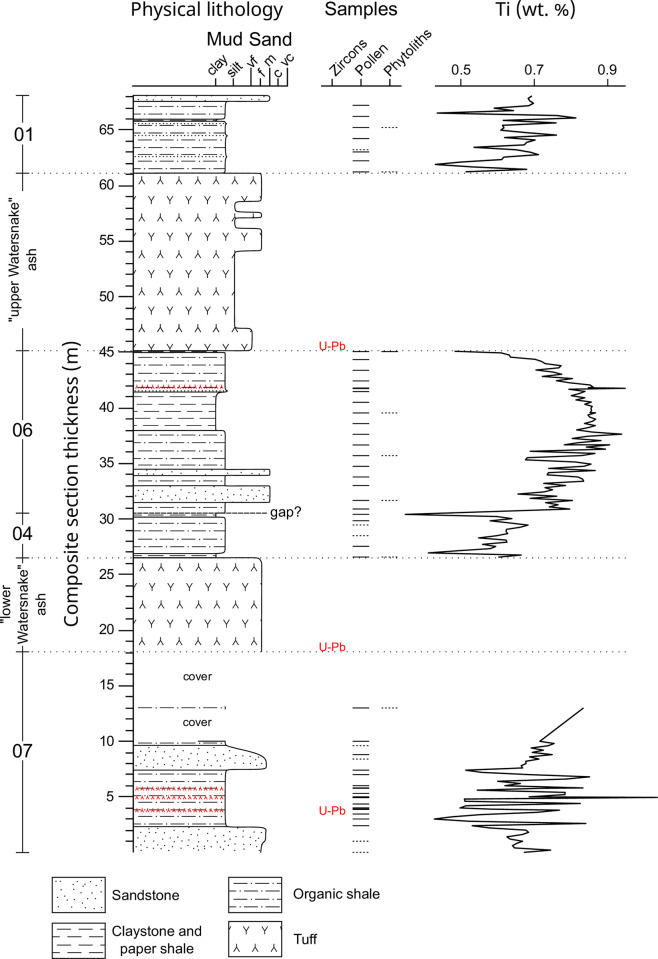
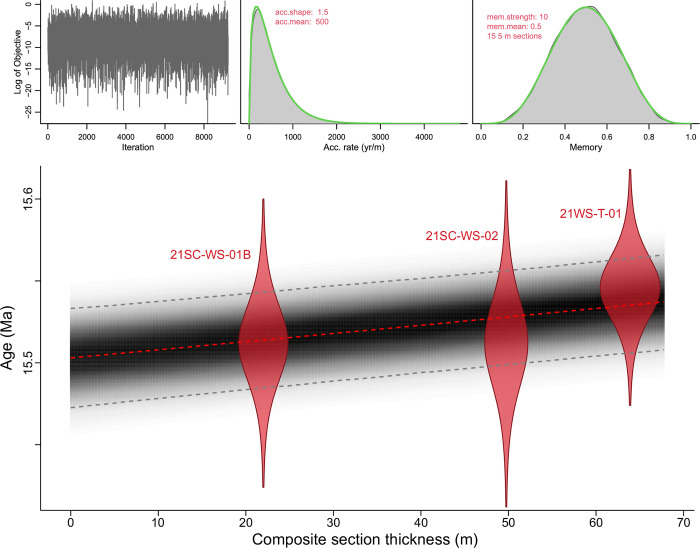
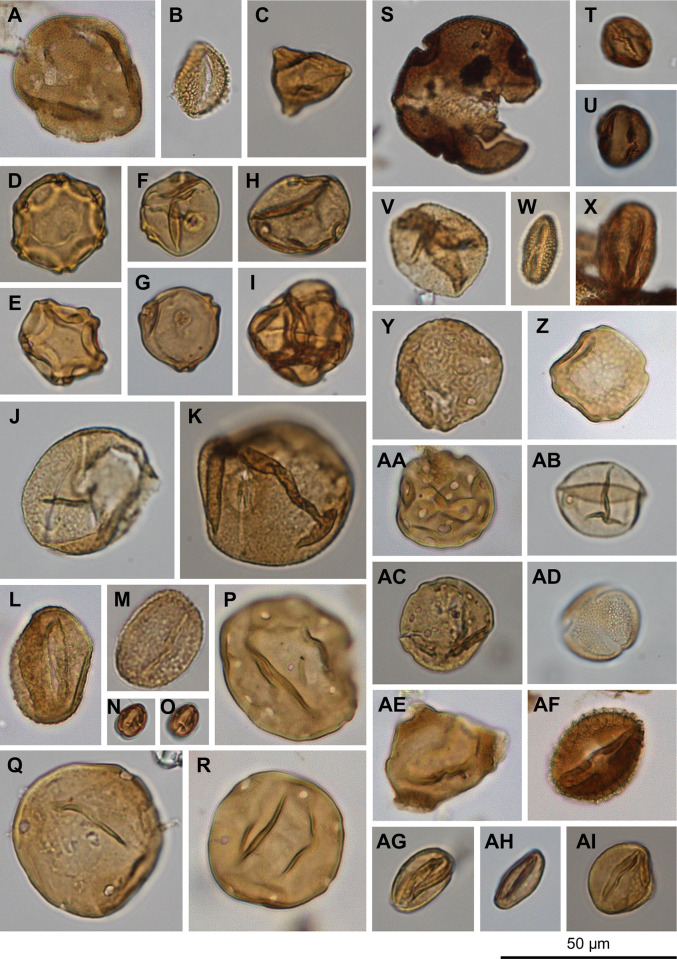
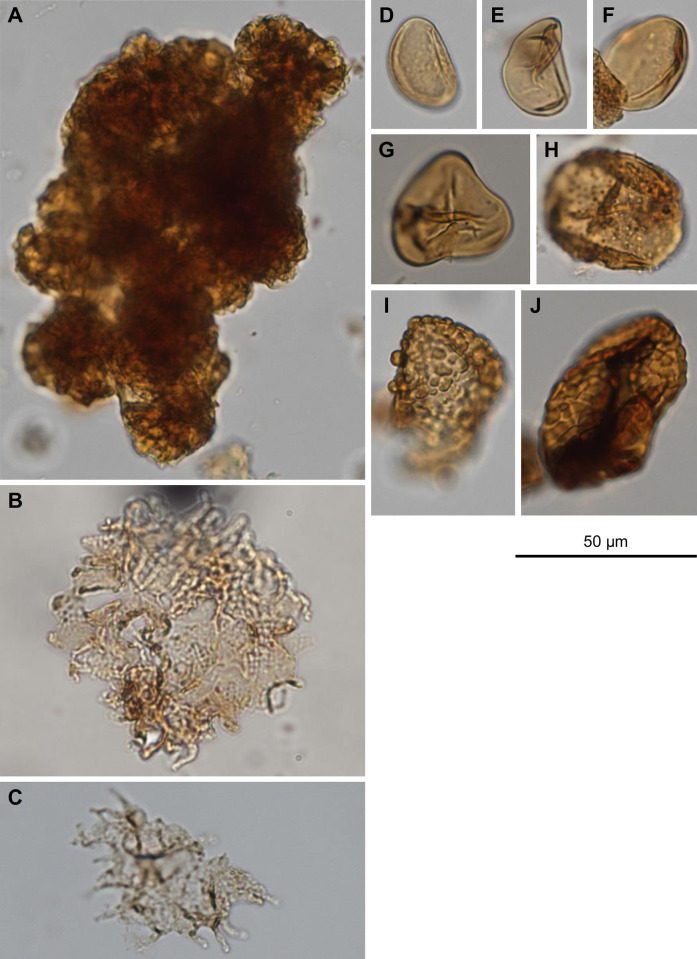
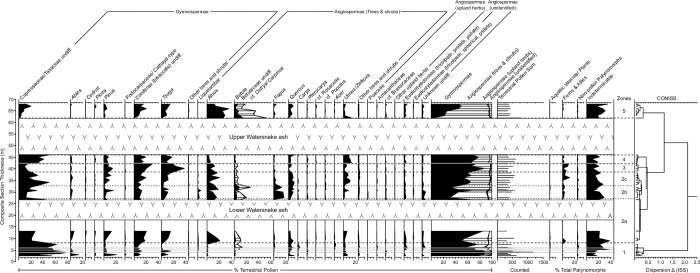
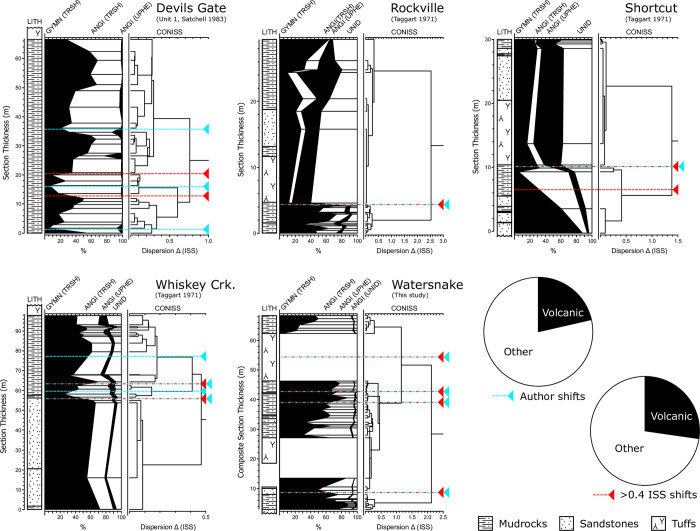
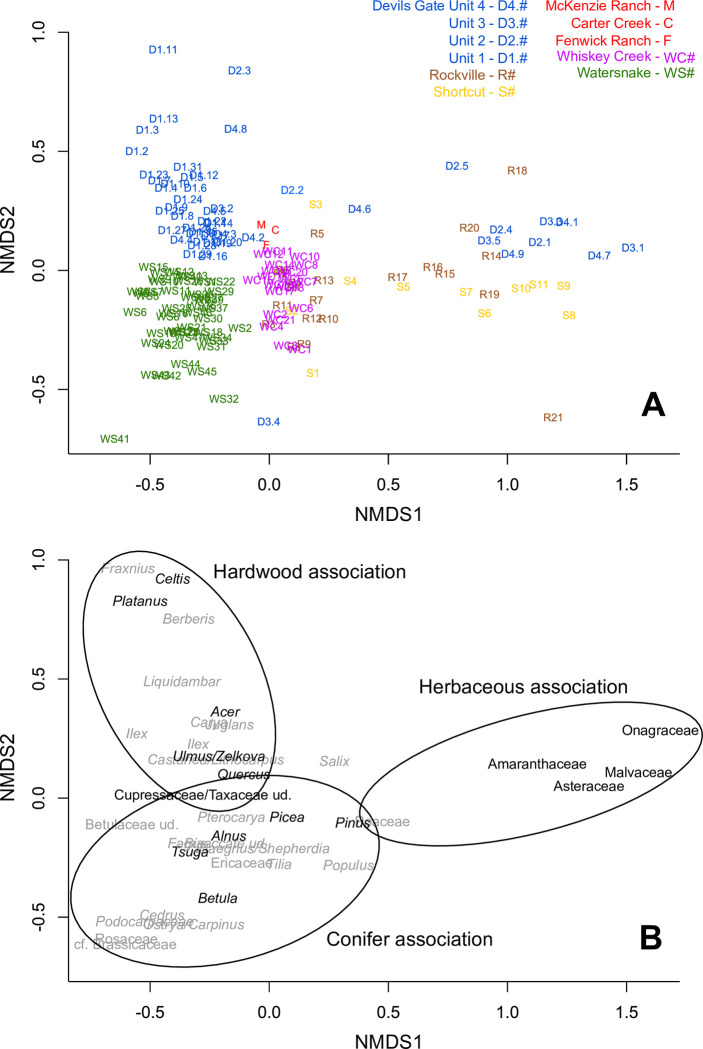
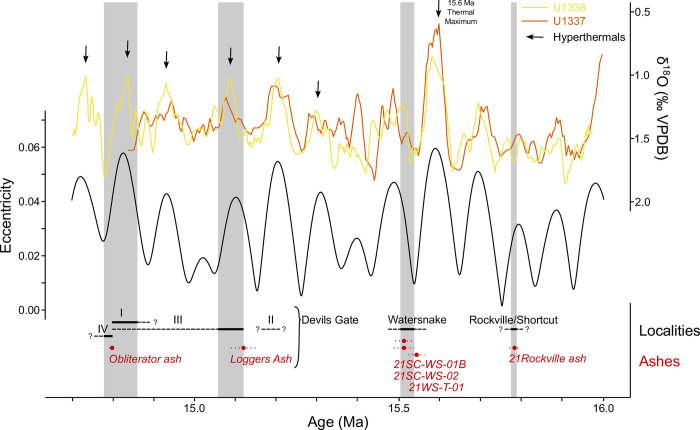
The fossil record of the U.S. Pacific Northwest preserves many Middle Miocene floras with potential for revealing long-term climate-vegetation dynamics during the Miocene Climatic Optimum. However, the possibility of strong, eccentricity-paced climate oscillations and concurrent, intense volcanism may obscure the signature of prevailing, long-term Miocene climate change. To test the hypothesis that volcanic disturbance drove Middle Miocene vegetation dynamics, high-resolution, stratigraphic pollen records and other paleobotanical data from nine localities of the Sucker Creek Formation were combined with sedimentological and geochemical evidence of disturbance within an updated chronostratigraphic framework based on new U-Pb zircon ages from tuffs. The new ages establish a refined, minimum temporal extent of the Sucker Creek Formation, ~15.8 to ~14.8 Ma, and greatly revise the local and regional chronostratigraphic correlations of its dispersed outcrop belt. Our paleoecological analysis at one ~15.52 Ma locality reveals two abrupt shifts in pollen spectra coinciding with the deposition of thick ash-flow tuffs, wherein vegetation dominated by Cupressaceae/Taxaceae, probably representing a Glyptostrobus oregonensis swamp, and upland conifers was supplanted by early-successional forests with abundant Alnus and Betula. Another ephemeral shift from Cupressaceae/Taxaceae swamp taxa in favor of upland conifers Pinus and Tsuga correlates with a shift from low-Ti shale to high-Ti claystone, suggesting a link between altered surface hydrology and vegetation. In total, three rapid vegetation shifts coincide with ash-flow tuffs and are attributed to volcanic disturbance. Longer-term variability between localities, spanning ~1 Myr of the Miocene Climatic Optimum, is chiefly attributed to eccentricity-paced climate change. Overall, Succor Creek plant associations changed frequently over ≤105 years timespans, reminiscent of Quaternary vegetation records. Succor Creek stratigraphic palynology suggests that numerous and extensive collection of stratigraphically controlled samples is necessary to understand broader vegetation trends through time.


Conflict of interest statement

The authors have declared that no competing interests exist.

Figures

Fig 1
Fig 1. Succor Creek flora locality map.
(A) Locations of existing Sucker Creek Formation palynological localities (open dots) and with localities with significant new contributions in this manuscript (black dots). At the Devils Gate locality, stratigraphic sections of Satchell [38] (black, solid) and Downing [37] (black, dotted) are given relative to the locations of tuff samples for U-Pb zircon chronology (red dots) and the location of the Obliterator Ash (red, dotted), used to correlate between fault blocks. At the Watersnake locality, stratigraphic sections (this study, black, solid) are given relative to the location of tuff samples (red dots). Hillshade basemap sourced from Esri and is used herein under license, © Esri, all rights reserved. Topographic basemaps sourced from the U.S. Geological Survey, public domain.
Fig 2
Fig 2. Watersnake locality stratigraphy.
Stratigraphic lithology, sampling horizons (productive—solid lines, poorly preserved—dotted lines), and total sediment titanium content (wt. %) through the Watersnake section. Increased Ti content of sediment suggests increased siliciclastic deposition.
Fig 3
Fig 3. Watersnake locality Bacon age-depth model.
Probability distributions are plotted for each U-Pb age determination (red silhouettes). Red dashed line is the median probability age from all run age-depth iterations, representing the best point estimate of age for any given depth. Gray point cloud represents age model probability and contains a 95% confidence interval (dashed gray lines). Iteration history (left top), prior and posterior densities of the mean accumulation rate (middle top), and prior and posterior of the memory (right top) suggest reasonable adherence of the model to a priori mean accumulation rate and memory assignments.
Fig 4
Fig 4. Selected Acrogymnospermae pollen types.
(A-C) Cupressaceae/Taxaceae undiff., (D) Abies, (E) Cedrus, (F) Picea, (G, H) Pinus undiff., (I) Podocarpaceae/Cathaya-type, (J) Tsuga, (K) Ephedra viridis-type, (L) Larix/Pseudotsuga.
Fig 5
Fig 5. Selected Angiospermae pollen types.
(A) Liquidambar, (B) Ilex, (C) Elaeagnaceae/Shepherdia argentea-type, (D, E) Alnus, (F, G) Betula, (H) Celtis, (I) Ericaceae, (J, K) Fagus, (L, M) Quercus, (N, O) Castanea/Lithocarpus, (P) Juglans, (Q) Carya, (R) Pterocarya, (S) Tilia, (T, U) cf. Rosaceae, (V) cf. Populus, (W) Salix, (X) Acer, (Y, Z) Ulmus/Zelkova, (AA) Sarcobatus, (AB) Poaceae, (AC) Amaranthaceae, (AD) cf. Brassicaceae, (AE) unknown? Onagraceae, (AF) unknown tricolporate, reticulate, (AG-AI) unknown tricolpate, psilate.
Fig 6
Fig 6. Selected non-pollen palynomorphs.
(A) Botryococcus, (B, C) Pediastrum, (D-F) monolete, psilate Polypodiophyta unk., (G) trilete Polypodiophyta unk., (H) cf. Osmunda, (I, J) monolete, coarsely verrucate Polypodiophyta unk.
Fig 7
Fig 7. Percentage diagrams of major (>1%) pollen types and spores.
Plotted zonation, used in discussion of pollen data, is supported by CONISS dendrogram constructed with percentage data from terrestrial pollen. Ashes are plotted, with thin airfall ashes (gray lines) occurring in zones 1 and 4.
Fig 8
Fig 8. Summaries of stratigraphic and pollen data from the Sucker Creek Formation.
Pollen data are broken into gymnosperm (GYMN), angiosperm (ANGI), unidentified (UNID), arboreal (TRSH), and/or nonarboreal (UPHE) components. Major shifts in pollen spectra where qualitatively indicated by the original author (blue) and quantitatively indicated by an increase in dispersion (increase in sum of squares) between CONISS clusters greater than 0.4 are plotted. 3 of 13 author-indicated shifts and 3 of 11 of CONISS-indicated shifts correlate with the deposition of thick tuffs.
Fig 9
Fig 9. NMDS ordination of Succor Creek pollen spectra.
(A) Ordination plotted by sample number, labelled by their locality and their sequential number from the base of the section, except for Devils Gate localities which are additionally labelled by their unit from Satchell [38]. (B) Ordination plotted by pollen type with taxa significant to the discussion in black.
Fig 10
Fig 10. Timing of Sucker Creek stratigraphic palynological sections relative to climate and eccentricity reconstructions.
Eccentricity quantities based on Laskar [93] solution. Tropical, eastern Pacific benthic foraminifera δ18O records from Integrated Ocean Drilling Program Sites U1337 [94] and U1338 [7] smoothed with a 5 observation rolling mean to emphasize long-term trends. Devils Gate unit 1 distinctly occurs during a cooling interval. Temporal extent of pollen-bearing sections (black lines with thin black lines showing uncertainty) and individual U-Pb dates (red dots are median probability ages, red dotted lines show uncertainty) are plotted.

References

    1. Steinthorsdottir M, Coxall HK, de Boer AM, Huber M, Barbolini N, Bradshaw CD, et al.. The Miocene: The Future of the Past. Paleoceanogr Paleoclimatology. 2021;36(4):e2020PA004037.
    1. Goldner A, Herold N, Huber M. The challenge of simulating the warmth of the mid-Miocene climatic optimum in CESM1. Clim Past. 2014. Mar 13;10(2):523–36.
    1. Burls NJ, Bradshaw CD, De Boer AM, Herold N, Huber M, Pound M, et al.. Simulating Miocene Warmth: Insights From an Opportunistic Multi-Model Ensemble (MioMIP1). Paleoceanogr Paleoclimatology. 2021;36(5):e2020PA004054.
    1. Wolfe JA. Distribution of Major Vegetational Types During the Tertiary. In: Sundquist ET, Broecker WS, editors. The Carbon Cycle and Atmospheric CO2: Natural Variations Archean to Present [Internet]. Washington, D. C.: American Geophysical Union; 1985. [cited 2023 Feb 15]. p. 357–75. (Geophysical Monograph Series; vol. 32). Available from: http://doi.wiley.com/10.1029/GM032p0357 - DOI
    1. Pound MJ, Haywood AM, Salzmann U, Riding JB. Global vegetation dynamics and latitudinal temperature gradients during the Mid to Late Miocene (15.97–5.33Ma). Earth-Sci Rev. 2012. Apr;112(1–2):1–22.