. 2024 Nov 8;9(101):eadi7907.
doi: 10.1126/sciimmunol.adi7907. Epub 2024 Nov 8.

Macrophage LRRK2 hyperactivity impairs autophagy and induces Paneth cell dysfunction

Affiliations

Macrophage LRRK2 hyperactivity impairs autophagy and induces Paneth cell dysfunction

Shengxiang Sun et al. Sci Immunol. .

Abstract

LRRK2 polymorphisms (G2019S/N2081D) that increase susceptibility to Parkinson's disease and Crohn's disease (CD) lead to LRRK2 kinase hyperactivity and suppress autophagy. This connection suggests that LRRK2 kinase inhibition, a therapeutic strategy being explored for Parkinson's disease, may also benefit patients with CD. Paneth cell homeostasis is tightly regulated by autophagy, and their dysfunction is a precursor to gut inflammation in CD. Here, we found that patients with CD and mice carrying hyperactive LRRK2 polymorphisms developed Paneth cell dysfunction. We also found that LRRK2 kinase can be activated in the context of interactions between genes (genetic autophagy deficiency) and the environment (cigarette smoking). Unexpectedly, lamina propria immune cells were the main intestinal cell types that express LRRK2, instead of Paneth cells as previously suggested. We showed that LRRK2-mediated pro-inflammatory cytokine release from phagocytes impaired Paneth cell function, which was rescued by LRRK2 kinase inhibition through activation of autophagy. Together, these data suggest that LRRK2 kinase inhibitors maintain Paneth cell homeostasis by restoring autophagy and may represent a therapeutic strategy for CD.


Conflict of interest statement

Competing interests: J.D.V. and A.A.E. have a patent application (WO2017218843) that includes DN-9713. D.P.B.M. owns stock in Prometheus Biosciences Inc. D.P.B.M. has consulted for Gilead, Pfizer, Boehringer Ingelheim, Qu Biologics, Bridge Biotherapeutics, Takeda, and Palatin Technologies, and received grant support from Janssen. T.S.S. consulted for Janssen, Abbvie, and Nxera. T.-C.L. has research contracts with Denali and Interline Therapeutics. All other authors declare that they have no competing interests.

Figures

Fig. 1.
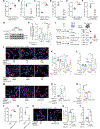
Fig. 1.. Patients with CD harboring LRRK2 SNPs and Lrrk2 G2019S mice are prone to Paneth cell defects.
(A) Paneth cells per crypt and (B) percentages of normal Paneth cells in patients with CD carrying LRRK2 risk alleles (N2081D and G2019S). (C) Representative photomicrographs of Paneth cells by defensin 5 (HD5, green); Blue: DAPI (4′,6-diamidino-2-phenylindole), nuclei. Scale bar, 10 μm. Paneth cells are outlined in white and classified into normal (D0) and five abnormal (D1 to D5) categories. (D) Ileal Paneth cells per crypt and (E) percentages of normal Paneth cells in Lrrk2 G2019S mice (n = 6). (F) Structure of DN-9713, an LRRK2 kinase inhibitor. (G) Ex vivo treatment of healthy human PBMCs with DN-9713 on pS935 LRRK2 and pT73 RAB10 (n = 3 donors). Data are shown as mean ± SEM. Calculated mean unbound IC50 [95% confidence interval (CI)] for pS935 LRRK2, 10.8 nM (6.6 to 17.7 nM); for pT73 RAB10, 9.3 nM (6.8 to 12.6 nM). (H) Dose-response curves of LRRK2 inhibition by DN-9713 measured by pS935 LRRK2 in HEK293T cells overexpressing LRRK2 G2019S. Data shown as mean ± SEM. n = 8 experiments. Mean of IC50 (95% CI): 11.5 nM (10 to 13 nM). (I and J) pS935 LRRK2 and pT73 RAB10 were measured by a Meso Scale Discovery (MSD) assay in the small intestines from Lrrk2 G2019S mice with in-diet dosing of DN-9713 (n = 3). (K) Representative photomicrographs of Paneth cells with lysozyme (red) and CC3 (green and highlighted by arrow) from Lrrk2 G2019S mice treated with DN-9713. Blue: DAPI. Scale bar, 10 μm. (L) Percentages of normal Paneth cells and (M) CC3+ cells/500 crypts in Lrrk2 G2019S mice treated with DN-9713 (n = 3 to 7). Statistical analysis by Mann-Whitney test [(A), (B), (D), and (E)], unpaired t test [(I) and (J)], or two-way ANOVA with Tukey’s multicomparison test [(L) and (M)]. *P < 0.05; **P < 0.01; ***P < 0.001; ****P < 0.0001. Error bars represent SDs unless specially stated.
Fig. 2.
Fig. 2.. LRRK2 is detectable in lamina propria phagocytes but not intestinal epithelial cells.
Representative photomicrographs of in situ hybridization of Lrrk2 in ilea from (A) WT and (B) Lrrk2/ mice. Arrowheads represent Lrrk2 RNA. Scale bars, 20 μm. (C) Representative photomicrographs of LRRK2 IHC in the ilea from patients with CD. Arrows represent LRRK2 protein. Scale bars, 20 μm. [(A) to (C)] The dashed lines represent the borders for intestinal epithelial cells, villi, and crypts in ileum. Asterisks represent Paneth cells. (D) Reanalysis of a previously generated scRNA-seq dataset (23) showed lack of Lrrk2 expression in small intestinal epithelial cells. (E) Reanalysis of a previously generated human intestinal myeloid cell scRNA-seq dataset (26) showed robust LRRK2 expression in monocytes and macrophages. (F) LRRK2 immunoblot in BMDMs and ileal organoids from WT mice. (G) Ileal organoids from WT mice used in (F) showed lysozyme expression by immunofluorescence (red/arrows). Blue: DAPI. Scale bars, 20 μm. Representative photomicrographs of in situ hybridization of Lrrk2 in (H) BMDM and (I) ileal organoid from WT mice. Scale bars, 10 μm.
Fig. 3.
Fig. 3.. LRRK2 inhibitor rescued Paneth cell defects in Atg16l1 T300A smoke-exposed mice.
(A) Top: pS106 RAB12 immunoblot in ilea from Atg16l1 T300A smoke-exposed and nonexposed mice. Bottom: Quantification of pS106 RAB12 expression (n = 3). (B) Schematic illustration of experimental design. Atg16l1 T300A mice and littermates were exposed to cigarette smoke and treated with DN-9713. (C) Percentages of normal Paneth cells and (D) CC3+ cells per 500 crypts from Atg16l1 T300A smoke-exposed mice treated with DN-9713 (n = 9 to 11). (E) Percentages of normal Paneth cells and (F) crypt base CC3+ cells per 500 crypts from Atg16l1 T300A and Atg16l1 T300A/Lrrk2/ mice exposed to cigarette smoke (n = 5 to 11). Statistical analysis by unpaired t test (A) or two-way ANOVA followed with Tukey’s multicomparison test [(C) to (F)]. **P < 0.01; ***P < 0.001; ****P < 0.0001. Error bars represent SDs.
Fig. 4.
Fig. 4.. Atg16l1 T300A macrophages treated with cigarette smoke condensate induced Paneth cell defects in organoids.
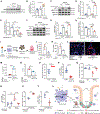
(A, C, and E) Percentages of normal Paneth cells and (B, D, and F) CC3+ cells per 500 crypts in the Atg16l1 T300A smoke-exposed and Lrrk2 G2019S mice treated with clodronate liposomes or anti-CSF1R antibody (n = 3 to 6). (G) pS106 RAB12 immunoblots in WT and Atg16l1 T300A BMDMs treated with CSC/poly(I:C) ± DN-9713. (H) Quantification of pS106 RAB12 expression (n = 3). (I) Schematic illustration of experimental designs. (J) Representative immunofluorescence of lysozyme (red), CC3 (green and highlighted by arrows), and DAPI (blue) in organoids. Scale bars, 20 μm. Quantification of (K) Paneth cells and (L) CC3+ cells in WT and Atg16l1 T300A organoids with medium transferred from WT and Atg16l1 T300A BMDMs. (M) Representative immunofluorescence of lysozyme (red), CC3 (green and highlighted by arrows), and DAPI (blue) in Atg16l1 T300A organoids. Scale bars, 20 μm. Quantification of (N) Paneth cells and (O) CC3+ cells in Atg16l1 T300A organoids with medium transferred from Atg16l1 T300A BMDMs treated with CSC/poly(I:C) ± DN-9713 or from Atg16l1 T300A/Lrrk2/ BMDMs treated with CSC/poly(I:C) (n = 3). (P) Percentages of normal Paneth cells and (Q) crypt base CC3+ cells/500 crypts from Atg16l1 T300A smoke-exposed and Atg16l1 T300A/Lrrk2Δphg smoke-exposed mice (n = 4 to 6). (R) Representative immunofluorescence of lysozyme (red), CC3 (green and highlighted by arrows), and DAPI (blue) in WT organoids. Scale bars, 20 μm. Quantification of (S) Paneth cells and (T) CC3+ cells in WT organoids with medium transferred from WT or Lrrk2 G2019S BMDMs treated with poly(I:C) (n = 3). Statistical analysis by unpaired t test [(A) to (F), (P), (Q), (S), and (T)], two-way ANOVA [(H), (K),and (L)], or one-way ANOVA followed by Tukey’s multicomparison test [(N) and (O)]. *P < 0.05; **P < 0.01; ***P < 0.001; ****P < 0.0001. Error bars represent SDs.
Fig. 5.
Fig. 5.. TNF and PAI-1 are macrophage-secreted factors that induce Paneth cell defects.
(A) Detection of cytokines/chemokines produced from WT BMDMs treated with CSC/poly(I:C) and Atg16l1 T300A BMDMs treated with CSC/poly(I:C) ± DN-9713. Concentrations of (B) PAI-1 and (C) TNF in BMDM medium (n = 3). (D) Protein expression of PAI-1 and TNF receptors LRP1 and TNFR1 by immunoblot in WT BMDMs and ileal organoids. Concentrations of (E) PAI-1 and (F) TNF by ELISA in medium from WT and Lrrk2 G2019S BMDMs (n = 3). (G) Experimental scheme to define the roles of TNF and PAI-1 in mediating Paneth cell defects. (H) Representative immunofluorescence of lysozyme (red), CC3 (green and highlighted by arrows), and DAPI (blue) in Atg16l1 T300A organoids. Scale bars, 20 μm. Quantification of (I) Paneth cells and (J) CC3+ cells in Atg16l1 T300A organoids with medium transferred from Atg16l1 T300A BMDMs treated with either PAI-1 inhibitor MDI-2268 or anti-TNF (n = 3). (K) Percentages of normal Paneth cells and (L) crypt base CC3+ cells/500 crypts from Atg16l1 T300A smoke-exposed mice treated with PAI-1 inhibitor (n = 7). (M) Percentages of normal Paneth cells and (N) crypt base CC3+ cells/500 crypts from Lrrk2 G2019S mice administrated with either PAI-1 inhibitor or anti-TNF (n = 5 or 6). (O) Percentages of normal Paneth cells in Atg16l1Δphg smoke-exposed mice (n = 7 to 12). (P) Percentages of normal Paneth cells and (Q) crypt base CC3+ cells/500 crypts from Atg16l1fl/fl and Atg16l1Δphg smoke-exposed mice treated with DN-9713 (n = 4 or 5). Statistical analysis by two-way ANOVA followed by Tukey’s multicomparison test [(B), (C), (E), (F), (P), and (Q)], one-way ANOVA followed by Tukey’s multicomparison test [(I), (J), (M), and (N)], or unpaired t test [(K), (L), and (O)]. *P < 0.05; **P < 0.01; ***P < 0.001; ****P < 0.0001. Error bars represent SDs.
Fig. 6.
Fig. 6.. Enforced Beclin1 activation prevents Paneth cell defects in Atg16l1 T300A smoke-exposed and Lrrk2 G2019S mice.
(A) p62 immunoblots in ilea from WT, Atg16l1 T300A, and Lrrk2 G2019S mice. (B) Quantification of p62 expression (n = 4). (C) p62 and pS15 Beclin1 immunoblots in WT and Atg16l1 T300A BMDMs treated with CSC/poly(I:C). Quantification of (D) p62 and (E) pS15 Beclin1 expression (n = 3). (F) p62 and pS15 Beclin1 immunoblots in WT and Lrrk2 G2019S BMDMs treated with poly(I:C). Quantification of (G) p62 and (H) pS15 Beclin1 expression (n = 3). (I) Experimental scheme involving BMDM medium transfer to organoid culture. Concentrations of (J) PAI-1 and (K) TNF in BMDM medium (n = 3). (L) Representative immunofluorescence of lysozyme (red), CC3 (green and highlighted by arrows), and DAPI (blue) in Atg16l1 T300A organoids with medium transferred from Atg16l1 T300A or Atg16l1 T300A/Becn1 KI BMDMs. Scale bar, 20 μm. Quantification of (M) Paneth cells and (N) CC3+ cells in Atg16l1 T300A organoids (n = 3). (O) Percentages of normal Paneth cells and (P) crypt base CC3+ cells/500 crypts in smoke-exposed mice (n = 9 to 11). (Q) Percentages of normal Paneth cells and (R) crypt base CC3+ cells/500 crypts from WT and Atg16l1 T300A smoke-exposed mice treated with Tat-Beclin1 peptide (n = 5 or 6). (S) Percentages of normal Paneth cells and (T) crypt base CC3+ cells/500 crypts from Lrrk2 G2019S mice treated with Tat-Beclin1 peptide (n = 5 or 6). (U) Current working model of how genetic factors or gene-environmental interactions trigger Paneth cell defects. Statistical analysis by one-way ANOVA followed by Tukey’s multicomparison test (B), two-way ANOVA followed by Tukey’s multicomparison test [(D), (E), (G), (H), (Q), and (R)], or unpaired t test [(J), (K), (M) to (P), (S), and (T)]. *P < 0.05; **P < 0.01; ***P < 0.001; ****P < 0.0001. Error bars represent SDs.

References

    1. Thaiss CA, Zmora N, Levy M, Elinav E, The microbiome and innate immunity. Nature 535, 65–74 (2016). - PubMed
    1. Adolph TE, Tomczak MF, Niederreiter L, Ko HJ, Böck J, Martinez-Naves E, Glickman JN, Tschurtschenthaler M, Hartwig J, Hosomi S, Flak MB, Cusick JL, Kohno K, Iwawaki T, Billmann-Born S, Raine T, Bharti R, Lucius R, Kweon MN, Marciniak SJ, Choi A, Hagen SJ, Schreiber S, Rosenstiel P, Kaser A, Blumberg RS, Paneth cells as a site of origin for intestinal inflammation. Nature 503, 272–276 (2013). - PMC - PubMed
    1. Clevers HC, Bevins CL, Paneth cells: Maestros of the small intestinal crypts. Annu. Rev. Physiol. 75, 289–311 (2013). - PubMed
    1. Liu TC, Stappenbeck TS, Genetics and pathogenesis of inflammatory bowel disease. Annu. Rev. Pathol. 11, 127–148 (2016). - PMC - PubMed
    1. Yu S, Tong K, Zhao Y, Balasubramanian I, Yap GS, Ferraris RP, Bonder EM, Verzi MP, Gao N, Paneth cell multipotency induced by notch activation following injury. Cell Stem Cell 23, 46–59.e5 (2018). - PMC - PubMed

Publication types

Substances