. 2024 Nov 8;10(45):eado3712.
doi: 10.1126/sciadv.ado3712. Epub 2024 Nov 8.

Global record-breaking recurrence rates indicate more widespread and intense surface air temperature and precipitation extremes

Affiliations

Global record-breaking recurrence rates indicate more widespread and intense surface air temperature and precipitation extremes

Rasmus E Benestad et al. Sci Adv. .

Abstract

We analyzed the evolution of extreme annual surface air temperature and rainfall on Earth, based on the recurrence rate of record-breaking events, and found the highest recurrence rates for record-high annual temperatures in the tropics, as opposed to the polar regions with the fastest warming. Both recurrence rates and the global surface area fraction with daily mean surface air temperatures exceeding 30° and 40°C provide further evidence for extremely hot years becoming more common and widespread. A similar analysis for precipitation highlighted some regions with more record-high annual total precipitation and others with record-low annual precipitation typically associated with drought. A multimodel ensemble of 306 runs with global climate models [Coupled Model Intercomparison Project phase 6 (CMIP) Shared Socioeconomic Pathways 2-45 (SSP2-45)] reproduced the statistics of record-breaking high temperatures, but there were some differences for the reanalysis precipitation record-breaking recurrence rates. The global climate model simulations suggested a slightly altered geographical pattern for record-breaking annual precipitation recurrence rates.


Figures
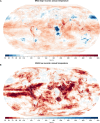
Fig. 1.
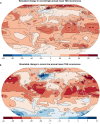
Fig. 1.. The maps show higher recurrences of record-breaking high annual surface air temperatures over most of the world compared to a stable climate.
(A) Recurrence rate of the record-high annual mean surface air temperature ζ = 100 × nobs/niid from the ERA5 reanalysis over the period of 1950 to 2023. The number for record-high annual mean surface air temperatures tends to be higher than for an iid process. (B) Recurrence rate of the record-low annual mean surface air temperature. The area-weighted global mean 〈ζ〉 was 136 (A) for record-high and 88 for record-low (B) record recurrence rates.
Fig. 2.
Fig. 2.. The fraction of Earth’s surface area with extremely hot days has increased since 1950.
The red curves show the annual mean of relative fractional global surface area with ERA5 daily mean surface air temperatures exceeding 30° and 40°C: 100×Ahot(t)/Aref¯, where Aref refers to the area over the period of 1951 to 1980 and was estimated to be 7,565,377 km2 for days hotter than 30°C and 4636 km2 for days hotter than 40°C. The blue curves mark the corresponding relative fractional global surface area with daily mean surface air temperatures of −30° and −40°C.
Fig. 3.
Fig. 3.. Global climate projections indicate that future rates of record-breaking warm years will increase further with continued global warming, except over the northern North Atlantic.
(A) Simulated change in the recurrence rate for the record-high annual mean surface air temperature (TAS) from 306 (CMIP6 SSP2-45) simulations in terms of the difference in the record-recurrence rate for the future (2025 to 2100) and that for the past (1950 to 2023). (B) Corresponding simulated change in the recurrence rate for the record-low annual mean surface air temperature.
Fig. 4.
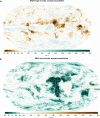
Fig. 4.. The maps show not only higher recurrences of record-breaking high annual total precipitation over parts of the tropics compared to a stable climate but also lower recurrences over parts of the subtropics.
Same as Fig. 1 but for annual total precipitation, where (A) shows record-high and (B) record-low annual precipitation. Green regions mark wetter conditions, whereas brown indicate regions with drier conditions.
Fig. 5.
Fig. 5.. The fraction of the global surface area receiving heavy daily rainfall has increased.
Annual mean of relative fractional global surface area with ERA5 daily total precipitation exceeding 50 and 90 mm: 100×Awet(t)/Aref¯, where Aref refers to the area over the period of 1951 to 1980 and was estimated to be 1,112,354 km2 for daily total precipitation exceeding 50 mm and 206,213 km2 for exceeding 90 mm.

References

    1. Copernicus Climate Change Service, “European State of the Climate Summary 2022” (Tech. Rep., ECMWF, 2023).
    1. Blunden J., Boyer T., Bartow-Gillies E., State of the climate in 2022. Bull. Am. Meteorol. Soc. 104, S1–S516 (2023).
    1. World Meteorological Organization (WMO), State of the Global Climate 2022 (WMO, 2023); https://library.wmo.int/records/item/66214-state-of-the-global-climate-2022.
    1. Qin P., Xie Z., Jia B., Sun S., Characteristics of population exposure to climate extremes from regional to global 1.5°C and 2.0°C warming in CMIP6 models. Environ. Res. Lett. 19, 014018 (2024).
    1. Hu Y., Jia G., Gao H., Li Y., Hou M., Li J., Miao C., Spatial characterization of global heat waves using satellite-based land surface temperature. Int. J. Appl. Earth Obs. Geoinf. 125, 103604 (2023).

LinkOut - more resources