. 2024 Nov;132(11):117003.
doi: 10.1289/EHP14634. Epub 2024 Nov 8.

Organophosphorus Flame Retardants and Metabolic Disruption: An in Silico, in Vitro, and in Vivo Study Focusing on Adiponectin Receptors

Affiliations

Organophosphorus Flame Retardants and Metabolic Disruption: An in Silico, in Vitro, and in Vivo Study Focusing on Adiponectin Receptors

Ying Liu et al. Environ Health Perspect. 2024 Nov.

Abstract

Background: Environmental chemical exposures have been associated with metabolic outcomes, and typically, their binding to nuclear hormone receptors is considered the molecular initiating event (MIE) for a number of outcomes. However, more studies are needed to understand the influence of such exposures on cell membrane-bound adiponectin receptors (AdipoRs), which are critical metabolic regulators.

Objective: We aimed to clarify the potential interactions between AdipoRs and environmental chemicals, specifically organophosphorus flame retardants (OPFRs), and the resultant effects.

Methods: Employing in silico simulation, cell thermal shift, and noncompetitive binding assays, we screened eight OPFRs for interactions with AdipoR1 and AdipoR2. We tested two key events underlying AdipoR modulation upon OPFR exposure in a liver cell model. The Toxicological Prioritization Index (ToxPi)scoring scheme was used to rank OPFRs according to their potential to disrupt AdipoR-associated metabolism. We further examined the inhibitory effect of OPFRs on AdipoR signaling activation in mouse models.

Results: Analyses identified pi-pi stacking and pi-sulfur interactions between the aryl-OPFRs 2-ethylhexyl diphenyl phosphate (EHDPP), triphenyl phosphate (TPhP), and tricresyl phosphate (TCP) and the transmembrane cavities of AdipoR1 and AdipoR2. Cell thermal shift assays showed a >3°C rightward shift in the AdipoR proteins' melting curves upon exposure to these three compounds. Although the binding sites differed from adiponectin, results suggest that aryl-OPFRs noncompetitively inhibited the binding of the endogenous peptide ligand ADP355 to the receptors. Analyses of key events underlying AdipoR modulation revealed that glucose uptake was notably lower, whereas lipid content was higher in cells exposed to aryl-OPFRs. EHDPP, TCP, and TPhP were ranked as the top three disruptors according to the ToxPi scores. A noncompetitive binding between these aryl-OPFRs and AdipoRs was also observed in wild-type (WT) mice. In db/db mice, the finding of lower blood glucose levels after ADP355 injection was diminished in the presence of a typical aryl-OPFR (TCP). WT mice exposed to TCP demonstrated lower AdipoR1 signaling, which was marked by lower phosphorylated AMP-activated protein kinase (pAMPK) and a higher expression of gluconeogenesis-related genes. Moreover, WT mice exposed to ADP355 demonstrated higher levels of pAMPK protein and peroxisome proliferator-activated receptor-α messenger RNA. This was accompanied by higher glucose disposal and by lower levels of long-chain fatty acids and hepatic triglycerides; these metabolic improvements were negated upon TCP co-treatment.

Conclusions: In silico, in vitro, and in vivo assays suggest that aryl-OPFRs act as noncompetitive inhibitors of AdipoRs, preventing their activation by adiponectin, and thus function as antagonists to these receptors. Our study describes a novel MIE for chemical-induced metabolic disturbances and highlights a new pathway for environmental impact on metabolic health. https://doi.org/10.1289/EHP14634.


Figures

Figure 1A is a set of two illustrations. A scientific representation of the protein 6KS0’s crystal structure is displayed at the top: Highlighting adiponectin receptor 1: extracellular; lipid bilayer region (also the cell membrane), including central cavity, lipid bilayer opening, transmembrane 1, transmembrane 2, transmembrane 6, transmembrane 7, transmembrane 3, transmembrane 4, transmembrane 5; and cytoplamic region (intracellular), including intracellular loop 2. Below is a collection of three crystal formations, each having its own chemical structure. On top, the crystal structure of 2-ethylhexyl diphenyl phosphate-adiponectin receptor 1 is displayed. On the right, a zoomed-in chemical structure with highlighted interactions is depicted. In the center, the crystal structure of triphenyl phosphate-adiponectin receptor 1 is displayed. On the right, a zoomed-in chemical structure with highlighted interactions is depicted. At the bottom, the crystal structure of tricresyl phosphate-adiponectin receptor 1 is displayed. On the right, a zoomed-in chemical structure with highlighted interactions is depicted. Figure 1B is a set of two illustrations. A scientific representation of the protein 6KS1’s crystal structure is displayed at the top: Highlighting adiponectin receptor 2: extracellular; lipid bilayer region, including central cavity, lipid bilayer opening, transmembrane 1, transmembrane 2, transmembrane 6, transmembrane 7; cytoplasmic region; cell membrane, including transmembrane 3, transmembrane 4, transmembrane 5; and intracellular, including intracellular loop 2. Below is a collection of three crystal formations, each having its own chemical structure. On top, the crystal structure of 2-ethylhexyl diphenyl phosphate-adiponectin receptor 2 is displayed. On the right, a zoomed-in chemical structure with highlighted interactions is depicted. In the center, the crystal structure of triphenyl phosphate-adiponectin receptor 2 is displayed. On the right, a zoomed-in chemical structure with highlighted interactions is depicted. At the bottom, the crystal structure of tricresyl phosphate-adiponectin receptor 2 is displayed. On the right, a zoomed-in chemical structure with highlighted interactions is depicted. Figure 1C is a set of four line graphs, plotting C lowercase alpha root mean-square deviation (Angstroms), ranging from 0 to 7 in unit increments; root mean-square deviation of ligands (Angstroms), ranging from 0 to 7 in unit increments; C lowercase alpha root mean-square deviation (Angstroms), ranging from 0 to 7 in unit increments; and root mean-square deviation of ligands (Angstroms), ranging from 0 to 7 in unit increments (y-axis) across nanoseconds, ranging from 0 to 20 in increments of 5 (x-axis) for adiponectin receptor 1, 2-ethylhexyl diphenyl phosphate, triphenyl phosphate, tricresyl phosphate; and adiponectin receptor 2, 2-ethylhexyl diphenyl phosphate, triphenyl phosphate, tricresyl phosphate, respectively.
Figure 1.
Molecular docking and molecular dynamics simulation of AdipoRs with three aryl-OPFRs. The crystal structures of AdipoRs are displayed as seven helices in the cartoon model. The boxed insets demonstrate the position of the ligand in the cavities of (A) AdipoR1 and (B) AdipoR2. The hydrogen bond, pi–pi stacking, salt bridge, halogen bond, and hydrophobic interaction, among other characteristics, are displayed in colored dotted lines. Molecular dynamics simulation of interactions of AdipoR1 (A) and AdipoR2 (B) with three aryl-OPFRs, and (C) changes in the root mean-square deviation (RMSD) of the ligands for AdipoRs in 20-ns molecular dynamics simulation. The corresponding data are presented in Excel Table S1. The 3D structures of AdipoR1 and AdipoR2 used for molecular docking were obtained from the Protein Data Bank (PDB)., Using AutoDock Vina software, (version 1.1.2), we converted these 3D structures into 2D representations, adjusted the coloring, and labeled different parts of the AdipoRs to generate (A) and (B). Note: 2D, two dimensional; 3D, three dimensional; AdipoR1, adiponectin receptor 1; AdipoR2, adiponectin receptor 2; CP, cytoplasmic region; EHDPP, 2-ethylhexyl diphenyl phosphate; ICL, intracellular loop; LB, lipid bilayer; OPFR, organophosphorus flame retardant; TCP, tricresyl phosphate; TM, transmembrane; TPhP, triphenyl phosphate.
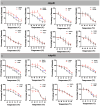
Figure 2A is a set of eight line graphs under, Adiponectin receptor 1, plotting percentage of intensity, ranging from 0 to 150 in increments of 50 (y-axis) across temperature (degrees Celsius), ranging from 45 to 60 in increments of 3 (x-axis) for dimethyl sulfoxide and triphenyl phosphate; dimethyl sulfoxide and 2-ethylhexyl diphenyl phosphate; dimethyl sulfoxide and tricresyl phosphate; dimethyl sulfoxide and tris (1,3-dichloro-2-propyl) phosphate; dimethyl sulfoxide and tris(1-chloro-2-propyl) phosphate; dimethyl sulfoxide and tris(2-chloroethyl) phosphate; dimethyl sulfoxide and tri-n-butyl phosphate; dimethyl sulfoxide and tris(2-butoxyethyl) phosphate. Figure 2B is a set of eight line graphs under, Adiponectin receptor 2, plotting percentage of intensity, ranging from 0 to 150 in increments of 50 (y-axis) across temperature (degrees Celsius), ranging from 45 to 66  in increments of 3 (x-axis) for dimethyl sulfoxide and triphenyl phosphate; ranging from 45 to 60 in increments of 3 (x-axis) for dimethyl sulfoxide and 2-ethylhexyl diphenyl phosphate; dimethyl sulfoxide and tricresyl phosphate; dimethyl sulfoxide and tris (1,3-dichloro-2-propyl) phosphate; dimethyl sulfoxide and tris(1-chloro-2-propyl) phosphate; dimethyl sulfoxide and tris(2-chloroethyl) phosphate; dimethyl sulfoxide and tri-n-butyl phosphate; dimethyl sulfoxide and tris(2-butoxyethyl) phosphate.
Figure 2.
Thermal shift assays in cell lysate after treatment with OPFRs. The cell lysate was incubated with the compounds and heated under a panel of temperatures (43°C, 46°C, 49°C, 52°C, 55°C, 58°C, and 61°C). The supernatant was evaluated via Western blot (n=3/group). After quantifying the density of the protein bands, the density at 43°C was established as the 100% reference point. The melting curves for (A) AdipoR1 and (B) AdipoR2 were then prepared by fitting to a Boltzmann sigmoidal curve. Data are presented as mean±SD. The dashed arrow represents a rightward shift at 50% protein aggregation (ΔTagg). Data in (A) and (B) are presented in Excel Table S2. Note: AdipoR1, adiponectin receptor 1; AdipoR2, adiponectin receptor 2; DMSO, dimethyl sulfoxide; EHDPP, 2-ethylhexyl diphenyl phosphate; OPFR, organophosphorus flame retardant; SD, standard deviation; TBEP, tris(2-butoxyethyl) phosphate; TBP, tri-n-butyl phosphate; TCEP, tris(2-chloroethyl) phosphate; TCP, tricresyl phosphate; TCPP, tris(1-chloro-2-propyl) phosphate; TDCPP, tris (1,3-dichloro-2-propyl) phosphate; TPhP, triphenyl phosphate.
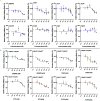
Figure 3A is a set of eight line graphs titled 2-ethylhexyl diphenyl phosphate, triphenyl phosphate, tricresyl phosphate, tris(1-chloro-2-propyl) phosphate, tris (1,3-dichloro-2-propyl) phosphate, tris(2-chloroethyl) phosphate, tri-n-butyl phosphate, and tris(2-butoxyethyl) phosphate, plotting relative blinding affinity (percentage), ranging from 0 to 150 in increments of 50; 0 to 150 in increments of 50; 0 to 150 in increments of 50; 0 to 150 in increments of 50; 0 to 200 in increments of 50; 0 to 150 in increments of 50; 0 to 150 in increments of 50; 0 to 150 in increments of 50 (y-axis) across concentrations (nanomolar), ranging from 0.1 and 10 begin superscript 0 end superscript, 10 begin superscript 1 end superscript, 10 begin superscript 2 end superscript, 10 begin superscript 3 end superscript, 10 begin superscript 4 end superscript, 10 begin superscript 5 end superscript; 0.1 and 10 begin superscript 0 end superscript, 10 begin superscript 1 end superscript, 10 begin superscript 2 end superscript, 10 begin superscript 3 end superscript, 10 begin superscript 4 end superscript, 10 begin superscript 5 end superscript; 0.1 and 10 begin superscript 0 end superscript, 10 begin superscript 1 end superscript, 10 begin superscript 2 end superscript, 10 begin superscript 3 end superscript, 10 begin superscript 4 end superscript, 10 begin superscript 5 end superscript; 10 begin superscript negative 1 end superscript and 10 begin superscript 0 end superscript, 10 begin superscript 1 end superscript, 10 begin superscript 2 end superscript, 10 begin superscript 3 end superscript, 10 begin superscript 4 end superscript, 10 begin superscript 5 end superscript; 10 begin superscript negative 1 end superscript and 10 begin superscript 0 end superscript, 10 begin superscript 1 end superscript, 10 begin superscript 2 end superscript, 10 begin superscript 3 end superscript, 10 begin superscript 4 end superscript, 10 begin superscript 5 end superscript; 10 begin superscript negative 1 end superscript and 10 begin superscript 0 end superscript, 10 begin superscript 1 end superscript, 10 begin superscript 2 end superscript, 10 begin superscript 3 end superscript, 10 begin superscript 4 end superscript, 10 begin superscript 5 end superscript; 10 begin superscript negative 1 end superscript and 10 begin superscript 0 end superscript, 10 begin superscript 1 end superscript, 10 begin superscript 2 end superscript, 10 begin superscript 3 end superscript, 10 begin superscript 4 end superscript, 10 begin superscript 5 end superscript; and 10 begin superscript negative 1 end superscript and 10 begin superscript 0 end superscript, 10 begin superscript 1 end superscript, 10 begin superscript 2 end superscript, 10 begin superscript 3 end superscript, 10 begin superscript 4 end superscript, 10 begin superscript 5 end superscript (x-axis), respectively. Figure 3B is a set of eight line graphs, plotting relative binding affinity (percentage), ranging from 0 to 150 in increments of 50 (y-axis) across 2-ethylhexyl diphenyl phosphate (nanomolar), ranging from 0.1 and 10 begin superscript 0 end superscript, 10 begin superscript 1 end superscript, 10 begin superscript 2 end superscript, 10 begin superscript 3 end superscript, 10 begin superscript 4 end superscript, 10 begin superscript 5 end superscript; 2-ethylhexyl diphenyl phosphate (nanomolar), ranging from 0.1 and 10 begin superscript 0 end superscript, 10 begin superscript 1 end superscript, 10 begin superscript 2 end superscript, 10 begin superscript 3 end superscript, 10 begin superscript 4 end superscript, 10 begin superscript 5 end superscript; triphenyl phosphate (nanomolar), ranging from 0.1 and 10 begin superscript 0 end superscript, 10 begin superscript 1 end superscript, 10 begin superscript 2 end superscript, 10 begin superscript 3 end superscript, 10 begin superscript 4 end superscript, 10 begin superscript 5 end superscript; triphenyl phosphate (nanomolar), ranging from 0.1 and 10 begin superscript 0 end superscript, 10 begin superscript 1 end superscript, 10 begin superscript 2 end superscript, 10 begin superscript 3 end superscript, 10 begin superscript 4 end superscript, 10 begin superscript 5 end superscript; tricresyl phosphate (nanomolar), ranging from 0.1 and 10 begin superscript 0 end superscript, 10 begin superscript 1 end superscript, 10 begin superscript 2 end superscript, 10 begin superscript 3 end superscript, 10 begin superscript 4 end superscript, 10 begin superscript 5 end superscript; tricresyl phosphate (nanomolar), ranging from 0.1 and 10 begin superscript 0 end superscript, 10 begin superscript 1 end superscript, 10 begin superscript 2 end superscript, 10 begin superscript 3 end superscript, 10 begin superscript 4 end superscript, 10 begin superscript 5 end superscript; tris(1-chloro-2-propyl) phosphate (nanomolar), ranging from 0.1 and 10 begin superscript 0 end superscript, 10 begin superscript 1 end superscript, 10 begin superscript 2 end superscript, 10 begin superscript 3 end superscript, 10 begin superscript 4 end superscript, 10 begin superscript 5 end superscript; and; tris(1-chloro-2-propyl) phosphate (nanomolar), ranging from 0.1 and 10 begin superscript 0 end superscript, 10 begin superscript 1 end superscript, 10 begin superscript 2 end superscript, 10 begin superscript 3 end superscript, 10 begin superscript 4 end superscript, 10 begin superscript 5 end superscript (x-axis) for adiponectin receptor 1 positive per adiponectin receptor 2 negative; adiponectin receptor 1 negative per adiponectin receptor 2 positive; adiponectin receptor 1 positive per adiponectin receptor 2 negative; adiponectin receptor 1 negative per adiponectin receptor 2 positive; adiponectin receptor 1 positive per adiponectin receptor 2 negative; adiponectin receptor 1 negative per adiponectin receptor 2 positive; adiponectin receptor 1 positive per adiponectin receptor 2 negative; adiponectin receptor 1 negative per adiponectin receptor 2 positive.
Figure 3.
The noncompetitive binding assay between OPFRs and FITC-labeled endogenous ligand ADP355 to AdipoRs. WT AML 12 cells were pretreated with serial concentrations of OPFRs for 4 h followed by 2-h incubation with FITC-ADP355. The fluorescence intensity in the control group was set at 100% as the reference point. Data are presented as mean±SD. (A) The decline in relative fluorescence intensity at serial concentrations of OPFRs was fitted to an [inhibitor] vs. response three-parameters curve (n=4/group). (B) The positive compounds were further chosen to perform the noncompetitive assays in AdipoR1- or AdipoR2-knockdown cells (n=4/group). AdipoR1/AdipoR2+ represents the siRNA knockdown of AdipoR1; AdipoR1+/AdipoR1 represents the siRNA knockdown of AdipoR2. Data in (A) and (B) are presented in Excel Table S3. Note: AdipoR1, adiponectin receptor 1; AdipoR2, adiponectin receptor 2; ADP355, adiponectin-based peptide; AML 12, alpha mouse liver 12 (cell line); EHDPP, 2-ethylhexyl diphenyl phosphate; FITC, fluorescein isothiocyanate; OPFR, organophosphorus flame retardant; SD, standard deviation; siRNA, small interfering RNA; TBEP, tris(2-butoxyethyl) phosphate; TBP, tri-n-butyl phosphate; TCEP, tris(2-chloroethyl) phosphate; TCP, tricresyl phosphate; TCPP, tris(1-chloro-2-propyl) phosphate; TDCPP, tris (1,3-dichloro-2-propyl) phosphate; TPhP, triphenyl phosphate; WT, wild type.
Figure 4A is a dot plot, plotting 2-ethylhexyl diphenyl phosphate for 12 hours, 2-ethylhexyl diphenyl phosphate for 24 hours, triphenyl phosphate for 12 hours, triphenyl phosphate for 24 hours, tricresyl phosphate for 12 hours, tricresyl phosphate for 24 hours, tri-n-butyl phosphate for 12 hours, tri-n-butyl phosphate for 24 hours, tris (1,3-dichloro-2-propyl) phosphate for 12 hours, tris (1,3-dichloro-2-propyl) phosphate for 24 hours, tris(1-chloro-2-propyl) phosphate for 12 hours, tris(1-chloro-2-propyl) phosphate for 24 hours, tris(2-chloroethyl) phosphate for 12 hours, tris(2-chloroethyl) phosphate for 24 hours, tris(2-chloroethyl) phosphate for 12 hours, tris(2-chloroethyl) phosphate for 24 hours, tris(2-butoxyethyl) phosphate for 12 hours, and tris(2-butoxyethyl) phosphate for 24 hours (y-axis) across fold change in lipid area relative to control, ranging from 10 begin superscript negative 9 end superscript, 10 begin superscript negative 8 end superscript, 10 begin superscript negative 7 end superscript, 10 begin superscript negative 6 end superscript, and 10 begin superscript negative 5 end superscript (x-axis) for m value, ranging from 0.5 to 1 in increments of 0.5, 1 to 2 in unit increments, and 2 to 5 in increments of 3. A scale depicts the p value ranging from 0.2 to 0.8 in increments of 0.2. Figure 4B is a set of two error bar graphs titled Twelfth and Twenty-fourth, plotting glucose uptake (relative fluorescence intensity per area), ranging from 0.5 to 1.5 in increments of 0.5 and 0.8 to 1.6 in increments of 0.2 (y-axis) across 2-ethylhexyl diphenyl phosphate, triphenyl phosphate, tricresyl phosphate, tri-n-butyl phosphate, tris(2-butoxyethyl) phosphate, tris(1-chloro-2-propyl) phosphate, tris (1,3-dichloro-2-propyl) phosphate, tris(2-chloroethyl) phosphate, AdipoRon, and ADP355 (x-axis) for 0, 10 begin superscript negative 9 end superscript, 10 begin superscript negative 9 end superscript, 10 begin superscript negative 8 end superscript, 10 begin superscript negative 7 end superscript, 10 begin superscript negative 6 end superscript, 10 begin superscript negative 5 end superscript, 25 micromolar, and 0.2 millimolar, respectively.
Figure 4.
Lipid accumulation and glucose uptake in AML 12 cells with exposure to OPFRs. (A) Effect of OPFRs on the lipogenesis (n=3/group) and (B) glucose uptake (n=4/group) at different treatment times. Cells were treated with different concentrations of OPFRs for 12 h or 24 h. Cells were double stained with BODIPY 493/503 (1μM) and Hoechst 33324 (1μM). The color of the circle represents the p-value, and the size of the circle represents the relative lipid area when compared with vehicle control (set at 1.0). Glucose uptake was performed using the Glucose Uptake Assay Kit (DOJINDO). The corresponding data are presented in Excel Table S4 and displayed as mean±SD. Note: AdipoRon, agonist of the adiponectin receptor 1 and adiponectin receptor 2; ADP355, adiponectin-based peptide; AML 12, alpha mouse liver 12 (cell line); ANOVA, analysis of variance; DMSO, dimethyl sulfoxide; EHDPP, 2-ethylhexyl diphenyl phosphate; OPFR, organophosphorus flame retardant; SD, standard deviation; TBEP, tris(2-butoxyethyl) phosphate; TBP, tri-n-butyl phosphate; TCEP, tris(2-chloroethyl) phosphate; TCP, tricresyl phosphate; TCPP, tris(1-chloro-2-propyl) phosphate; TDCPP, tris (1,3-dichloro-2-propyl) phosphate; TPhP, triphenyl phosphate. Statistical comparisons were performed using a one-way ANOVA with Dunnett’s multiple comparisons test: *p<0.05, **p<0.01 compared with vehicle control (0.1% DMSO).
Figure 5A is a set of nine pie charts and two graphs. On the top row, there are six pie charts and at the bottom, there are three pie charts. On the top-left, the first pie chart displays the following information: 2-ethylhexyl diphenyl phosphate score equals 1.0000, rank equals 8 (out of 8). Slice 1 to 5, each score 1.0000. The second pie chart displays the following information: tricresyl phosphate score equals 0.8798, rank equals 7 (out of 8). Slice 1 score is 0.9206, slice 2 score is 0.9686, slice 3 score is 0.5382, slice 4 score is 1.0000, and slice 5 score is 0.9812. The third pie chart displays the following information: triphenyl phosphate score equals 0.7771, rank equals 6 (out of 8). Slice 1 score is 0.8271, slice 2 score is 0.9846, slice 3 score is 0.9948, slice 4 score is 0.6898, and slice 5 score is 0.4010. The fourth pie chart displays the following information: tris (1,3-dichloro-2-propyl) phosphate score is 0.2572, rank equals 5 (out of 8). Slice 1 score is 0.7124, slice 2 score is 0.0000, slice 3 score is 0.0000, slice 4 score is 0.3102, and slice 5 score is 0.3720. The fifth pie chart displays the following information: tris(1-chloro-2-propyl) phosphate score is 0.2228, rank equals 4 (out of 8). Slice 1 score is 0.0000, slice 2 score is 0.0000, slice 3 score is 0.9534, slice 4 score is 0.0000, and slice 5 score is 0.1077. The sixth pie chart displays the following information: tris(2-butoxyethyl) phosphate score is 0.1910, rank equals 3 (out of 8). Slice 1 score is 0.7124, slice 2 score is 0.0000, slice 3 score is 0.0000, slice 4 score is 0.3102, and slice 5 score is 0.0565. At the bottom, the first pie chart displays the following information: tri-n-butyl phosphate score is 0.1707, rank equals 2 (out of 8). Slice 1 score is 0.7124, slice 2 score is 0.0000, slice 3 score is 0.0000, slice 4 score is 0.1622, and slice 5 score is 0.1077. The second pie chart displays the following information: tris(2-chloroethyl) phosphate score equals 0.0910, rank equals 1 (out of 8). Slice 1 score is 0.3562, slice 2 score is 0.0000, slice 3 score is 0.0000, slice 4 score is 0.1622, and slice 5 score is 0.0000. The third pie chart displays the following information: Slice 1 equals binding energy, slice 2 equals thermal stability, slice 3 equals competitive binding, slice 4 equals glucose uptake, and slice 5 equals lipid deposition. A dot plot, plotting ToxPi Score, ranging from 0 to 1 in increments of 0.1 (y-axis) across ToxPi Rank, ranging from 1 to 8 in unit increments (x-axis). A horizontal bar graph, plotting ToxPi score, ranging from 0 to 1 in unit increments (y-axis) across frequency, ranging from 0.0 to 0.7 in increments of 0.1 (x-axis). Figure 5B is a set of nine pie charts and two graphs. On the top row, there are six pie charts and at the bottom, there are three pie charts. On the top-left, the first pie chart displays the following information: 2-ethylhexyl diphenyl phosphate score equals 0.9966, rank equals 8 (out of 8). Slice 1 score is 1.0000, slice 2 score is 0.9840, slice 3 score is 1.0000, slice 4 score is 1.0000, and slice 5 score is 1.0000. The second pie chart displays the following information: tricresyl phosphate score equals 0.8860, rank equals 7 (out of 8). Slice 1 score is 0.9208, slice 2 score is 0.9797, slice 3 score is 0.5568, slice 4 score is 1.0000, and slice 5 score is 0.9812. The third pie chart displays the following information: triphenyl phosphate score equals 0.7080, rank equals 6 (out of 8). Slice 1 score is 0.5646, slice 2 score is 1.0000, slice 3 score is 0.8503, slice 4 score is 0.6898, and slice 5 score is 0.4010. The fourth pie chart displays the following information: tris (1,3-dichloro-2-propyl) phosphate score is 0.4244, rank equals 5 (out of 8). Slice 1 score is 1.0000, slice 2 score is 0.8923, slice 3 score is 0.0000, slice 4 score is 0.3102, and slice 5 score is 0.3720. The fifth pie chart displays the following information: tris(1-chloro-2-propyl) phosphate score is 0.3970, rank equals 4 (out of 8). Slice 1 score is 0.3562, slice 2 score is 0.9367, slice 3 score is 0.0000, slice 4 score is 0.3102, and slice 5 score is 0.3720. The sixth pie chart displays the following information: tris(2-butoxyethyl) phosphate score is 0.3027, rank equals 3 (out of 8). Slice 1 score is 0.0000, slice 2 score is 0.9163, slice 3 score is 0.4175, slice 4 score is 0.0000, and slice 5 score is 0.1077. At the bottom, the first pie chart displays the following information: tri-n-butyl phosphate score is 0.1470, rank equals 2 (out of 8). Slice 1 score is 0.5646, slice 2 score is 0.0000, slice 3 score is 0.0000, slice 4 score is 0.1622, and slice 5 score is 0.1077. The second pie chart displays the following information: tris(2-chloroethyl) phosphate score equals 0.1244, rank equals 1 (out of 8). Slice 1 score is 0.5646, slice 2 score is 0.0000, slice 3 score is 0.0000, slice 4 score is 0.1622, and slice 5 score is 0.0000. The third pie chart displays the following information: Slice 1 equals binding energy, slice 2 equals thermal stability, slice 3 equals competitive binding, slice 4 equals glucose uptake, and slice 5 equals lipid deposition. A dot plot, plotting ToxPi Score, ranging from 0 to 1 in increments of 0.1 (y-axis) across ToxPi Rank, ranging from 1 to 8 in unit increments (x-axis). A horizontal bar graph, plotting ToxPi score, ranging from 0 to 1 in unit increments (y-axis) across frequency, ranging from 0.00 to 0.40 in increments of 0.05 (x-axis).
Figure 5.
ToxPi scores of OPFRs for ranking potency of interference with AdipoRs. Nightingale Rose diagram of scoring categories in interactions of OPFRs with (A) AdipoR1 and (B) AdipoR2. Each colored slice represents its corresponding assay. Slice 1 (tangerine sector) represents binding affinity; slice 2 (green sector) represents thermal stability; slice 3 (purple sector) represents noncompetitive binding ability; slice 4 (yellow sector) represents glucose uptake; and slice 5 (blue sector) represents lipid deposition. The size of the slice reflects the ToxPi score from a series of calculations that build in the ToxPi Graphical User Interface. Low-scoring slices indicate low active, and negative-scoring slices indicate inactive in the corresponding assays. The circle plot represents of the ToxPi rank for OPFRs. The circle represents different chemicals. Note: AdipoR1, adiponectin receptor 1; AdipoR2, adiponectin receptor 2; EHDPP, 2-ethylhexyl diphenyl phosphate; OPFR, organophosphorus flame retardant; TBEP, tris(2-butoxyethyl) phosphate; TBP, tri-n-butyl phosphate; TCEP, tris(2-chloroethyl) phosphate; TCP, tricresyl phosphate; TCPP, tris(1-chloro-2-propyl) phosphate; TDCPP, tris (1,3-dichloro-2-propyl) phosphate; ToxPi, Toxicological Prioritization Index; TPhP, triphenyl phosphate.
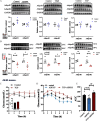
Figure 6A is a set of three Western blots, and three error bar graphs. On the left, the Western blot displays two columns, namely, control and 2-ethylhexyl diphenyl phosphate, and three rows, namely, adiponectin receptor 1, adiponectin receptor 2, and glyceraldehyde-3-phosphate dehydrogenase. At the center, the Western blot displays two columns, namely, control and triphenyl phosphate, and three rows, namely, adiponectin receptor 1, adiponectin receptor 2, and glyceraldehyde-3-phosphate dehydrogenase. On the right, the Western blot displays two columns, namely, control and tricresyl phosphate, and three rows, namely, adiponectin receptor 1, adiponectin receptor 2, and glyceraldehyde-3-phosphate dehydrogenase. The three error bar graphs are plotting relative content, ranging from 0.0 to 1.6 in increments of 0.2 (y-axis) across adiponectin receptor 1 and adiponectin receptor 2 (x-axis) for control and 2-ethylhexyl diphenyl phosphate; control and triphenyl phosphate; and control and triphenyl phosphate. Figure 6B is a set of three Western blots, and three error bar graphs. All three Western blots display two rows, namely, adiponectin receptor 1 with 55 degrees Celsius and adiponectin receptor 2 with 58 degrees Celsius. The three error bar graphs are plotting relative content, ranging from 0.0 to 1.6 in increments of 0.2 (y-axis) across adiponectin receptor 1 and adiponectin receptor 2 (x-axis) for control and 2-ethylhexyl diphenyl phosphate; control and triphenyl phosphate; and control and triphenyl phosphate. Figure 6C is a line graph, plotting glucose (millimoles per liter), ranging from 0 to 35 in increments of 5 (y-axis) across time (hours), ranging from 0 to 5 in unit increments (x-axis) for control and tricresyl phosphate. Inside the line graph, a bar graph is plotting area under the curve, ranging from 0 to 200 in increments of 50 (y-axis) across control and tricresyl phosphate (x-axis). Figure 6D is a line graph, plotting glucose (millimoles per liter), ranging from 0 to 40 in increments of 10 (y-axis) across time (hours), ranging from 0 to 7 in unit increments (x-axis) for control, adiponectin-based peptide, tricresyl phosphate plus adiponectin-based peptide. Figure 6E is a bar graph, plotting area under the curve, ranging from 0 to 250 in increments of 50 (y-axis) across control, adiponectin-based peptide, tricresyl phosphate plus adiponectin-based peptide.
Figure 6.
Thermal shift assay in mouse liver tissue and the impact on glucose disposal in mouse models upon exposure to aryl-OPFRs. (A) Protein levels (n=4/group) of AdipoRs in liver. (B) Thermal stability of AdipoR1 (n=4/group) and AdipoR2 (n=4/group) at 55°C and 58°C, respectively. The liver was collected after intraperitoneal (i.p.) injection with 50mg/kg aryl-OPFRs for 4 h in WT mice. (C) Plasma glucose levels in db/db mice (n=5/group) after i.p. injection with 50mg/kg typical aryl-OPFRs (TCP). One hour after injection, the level of blood glucose from the tail vein was measured over 5 h by glucometer. (D) Plasma glucose levels in db/db mice (n=5/group) after i.p. injection with 50mg/kg typical aryl-OPFRs (TCP) for 4 h, followed by subcutaneous injection with or without ADP355 (6mg/kg). (E) The area under the curve (AUC) for plasma glucose levels in groups described in (D). Results are presented as mean±SEM. Data in (A–E) are presented in Excel Table S5. The “mouse” and “thermometer” in (A) and (B) were generated using Procreate 5.2.1 (Savage Interactive Pty Ltd., Tas, Australia) by the authors. Note: AdipoR1, adiponectin receptor 1; AdipoR2, adiponectin receptor 2; ADP355, adiponectin-based peptide; ANOVA, analysis of variance; EHDPP, 2-ethylhexyl diphenyl phosphate; GAPDH, glyceraldehyde-3-phosphate dehydrogenase; OPFR, organophosphorus flame retardant; SEM, standard error of the mean; TCP, tricresyl phosphate; TPhP, triphenyl phosphate; WT, wild type. In (A) and (B), statistical comparisons were performed using Student’s t-test: *p<0.05, **p<0.01 compared with vehicle control (olive oil). In (C) and (D), statistical comparisons were performed using a two-way ANOVA with Bonferroni’s multiple comparisons test. In (E), statistical comparisons were performed using a one-way ANOVA with Tukey’s multiple comparisons test: ##p<0.01 compared with the ADP355 group.
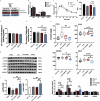
Figure 7A depicts a flowchart with two steps. Step 1: C57BL/6 mice were exposed to olive oil for 4 hours, followed by i.p. saline, then tricresyl phosphate for 4 hours, followed by i.p. saline, then tricresyl phosphate for 4 hours, followed by i.p. adiponectin-based peptide, and then olive oil for 4 hours followed by i.p. adiponectin-based peptide. Step 2: After exposure 10 days, the mice had a glucose tolerance test, and after 16 days, the mice were sacrificed. Figure 7B is a clustered bar graph, plotting blood biochemistry, ranging from 0 to 3 in unit increments (y-axis) across plasma cholesterol, triglyceride, high-density lipid cholesterol, and low-density lipid cholesterol (x-axis) for olive oil, tricresyl phosphate, tricresyl phosphate plus adiponectin-based peptide, and adiponectin-based peptide. Figure 7C is a line graph, plotting glucose (millimoles per liter), ranging from 0 to 30 in increments of 10 (y-axis) across time (minutes), ranging from 0 to 120 in increments of 20 (x-axis) for olive oil, tricresyl phosphate, tricresyl phosphate plus adiponectin-based peptide, and adiponectin-based peptide. Figures 7D to 7F are bar graphs, plotting area under the curve, ranging from 1,000 to 2,000 in increments of 500; the content of total cholesterol (millimoles per milligram protein), ranging from 0 to 150 in increments of 50; the content of triglyceride (millimoles per milligram protein), ranging from 0 to 80 in increments of 20 (y-axis) across olive oil, tricresyl phosphate, tricresyl phosphate plus adiponectin-based peptide, and adiponectin-based peptide (x-axis). Figure 7G is a set of two box and whiskers plots titled C 12 to 0 and C 18 to 0, plotting content (micrograms per gram), ranging from 0 to 160 in increments of 40 and 0 to 3,200 in increments of 800 (y-axis) across olive oil, tricresyl phosphate, tricresyl phosphate plus adiponectin-based peptide, and adiponectin-based peptide (x-axis), respectively. Figure 7H is a set of one Western blot and two box and whisker plots. The Western blot displays four columns, namely, dimethyl sulfoxide, tricresyl phosphate, tricresyl phosphate plus adiponectin-based peptide, and adiponectin-based peptide, and six rows, namely, pAMPK with 62 kilodalton, AMPK with 62 kilodalton, glyceraldehyde-3-phosphate dehydrogenase with 36 kilodalton, pLKB 1 with 68 kilodalton, LKB 1 with 48 kilodalton, and glyceraldehyde-3-phosphate dehydrogenase with 36 kilodalton. The two box and whisker plots are titled C 20 to 4 n 6 and C 22 to 0, plotting content, ranging from 0 to 3,200 in increments of 800 and 0 to 40 in increments of 10 (y-axis) across olive oil, tricresyl phosphate, tricresyl phosphate plus adiponectin-based peptide, and adiponectin-based peptide (x-axis), respectively. Figure 7I is a set of two bar graphs, plotting, pAMPK per AMPK, ranging from 0.0 to 2.0 in increments of 0.5 and pLKB1 per LKB1, ranging from 0.0 to 1.5 in increments of 0.5 (y-axis) across dimethyl sulfoxide, tricresyl phosphate, tricresyl phosphate plus adiponectin-based peptide, and adiponectin-based peptide (x-axis). Figure 7J is a clustered bar graph, plotting relative fold (messenger ribonucleic acid), ranging from 0 to 5 in unit increments (y-axis) across PCK1, G6PC, peroxisome proliferator-activated receptor lowercase alpha, adiponectin receptor 1, and adiponectin receptor 2 (x-axis) for olive oil, tricresyl phosphate, tricresyl phosphate plus adiponectin-based peptide, and adiponectin-based peptide.
Figure 7.
Glycolipid metabolism and relative signaling of AdipoRs after co-treatment with TCP and ADP355 in a WT mouse model. (A) Flowchart of mouse treatment. (B) Plasma cholesterol (CHOl), triglyceride (TG), high-density lipid cholesterol (HDL-C), and low-density lipid cholesterol (LDL-C). (C) Plasma glucose levels after gavage of TCP at 50mg/kg for 10 d with or without ADP355 injection (1mg/kg). (D) the area under the curve (AUC) for plasma glucose levels in the groups described in (C). (E–F) The content of TG and total cholesterol in the liver. (G) The content of fatty acids, including C12:0, C18:0, C20:4n6, and C22:0. (H) Protein band (n=3/group) of AdipoR1 downstream (pAMPK and pLKB1) in the liver and (I) their quantification. (J) mRNA levels of genes involved in AdipoR1, AdipoR2, and gluconeogenesis (G6PC and PCK1) and downstream of AdipoR2 (PPARα) in the liver. Results are presented as mean±SEM. Data in (B–J) are presented in Excel Table S6. Olive oil group (n=7/group), TCP group (n=8/group), TCP+ADP355 group (n=8/group) and ADP355 group (n=7/group). For the fatty acid detection (n=6/group). The “mouse” in (A) was generated using Procreate 5.2.1 (Savage Interactive Pty Ltd., Tas, Australia) by the authors. Note: AdipoR1, adiponectin receptor 1; AdipoR2, adiponectin receptor 2; ADP355, adiponectin-based peptide; AMPK, adenosine monophosphate (AMP)-activated protein kinase; ANOVA, analysis of variance; G6PC, glucose-6-phosphatase; GAPDH, glyceraldehyde-3-phosphate dehydrogenase; GTT, glucose tolerance test; i.p., intraperitoneal; LKB1, liver kinase B1; pAMPK, phosphorylated AMP-activated protein kinase; PCK1, phosphoenolpyruvate carboxykinase; pLKB1, phosphorylated liver kinase B1; PPARα, peroxisome proliferator-activated receptor α; SEM, standard error of mean; TCP, tricresyl phosphate; WT, wild type. Statistical comparisons were performed using one-way ANOVA with Tukey’s multiple comparisons test: *p<0.05, ** p<0.01 compared with the olive oil group: #p<0.05, ##p<0.01 compared with the ADP355 group.

Similar articles

Cited by

References

    1. Casals-Casas C, Desvergne B. 2011. Endocrine disruptors: from endocrine to metabolic disruption. Annu Rev Physiol 73:135–162, PMID: 21054169, 10.1146/annurev-physiol-012110-142200. - DOI - PubMed
    1. Gore AC, Chappell VA, Fenton SE, Flaws JA, Nadal A, Prins GS, et al. . 2015. EDC-2: the Endocrine Society’s second Scientific Statement on endocrine-disrupting chemicals. Endocr Rev 36(6):E1–E150, PMID: 26544531, 10.1210/er.2015-1010. - DOI - PMC - PubMed
    1. A O P Wiki. n.d. Welcome to the Collaborative Adverse Outcome Pathway Wiki (AOP-Wiki). https://aopwiki.org [accessed 9 July 2023].
    1. Zhu L, Hajeb P, Fauser P, Vorkamp K. 2023. Endocrine disrupting chemicals in indoor dust: a review of temporal and spatial trends, and human exposure. Sci Total Environ 874:162374, PMID: 36828075, 10.1016/j.scitotenv.2023.162374. - DOI - PubMed
    1. Yao C, Yang H, Li Y. 2021. A review on organophosphate flame retardants in the environment: occurrence, accumulation, metabolism and toxicity. Sci Total Environ 795:148837, PMID: 34246143, 10.1016/j.scitotenv.2021.148837. - DOI - PubMed

LinkOut - more resources