. 2025 Jan 28;9(2):321-334.
doi: 10.1182/bloodadvances.2024013968.

Increased exercise tolerance in humanized G6PD-deficient mice

Affiliations

Increased exercise tolerance in humanized G6PD-deficient mice

Francesca I Cendali et al. Blood Adv. .

Abstract

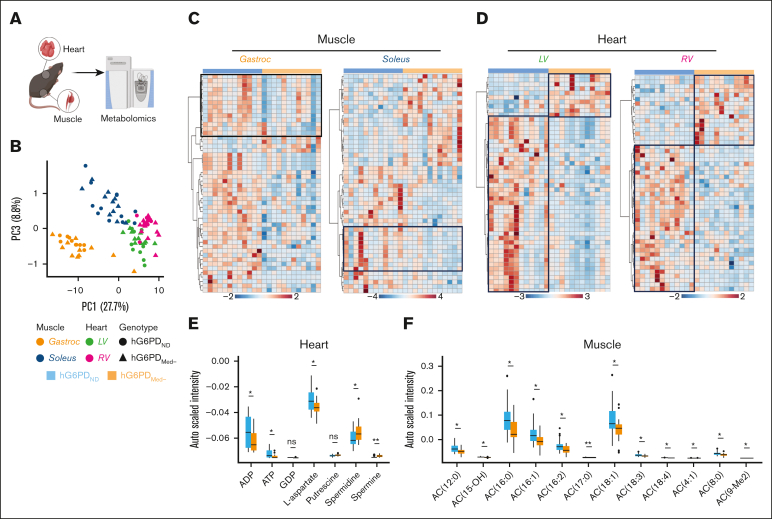
Glucose-6-phosphate dehydrogenase (G6PD) deficiency affects 500 million people globally, affecting red blood cell (RBC) antioxidant pathways and increasing susceptibility to hemolysis under oxidative stress. Despite the systemic generation of reactive oxygen species during exercise, the effects of exercise on individuals with G6PD deficiency remain poorly understood This study used humanized mouse models expressing the G6PD Mediterranean variant (S188F, with 10% enzymatic activity) to investigate exercise performance and molecular outcomes. Surprisingly, despite decreased enzyme activity, G6PD-deficient mice have faster critical speed than mice expressing human canonical G6PD. After exercise, deficient mice did not exhibit differences in RBC morphology or hemolysis, but had improved cardiac function, including cardiac output, stroke volume, sarcomere length, and mitochondrial content. Proteomics analyses of cardiac and skeletal muscles (gastrocnemius, soleus) from G6PD-deficient compared with sufficient mice revealed improvements in mitochondrial function and increased protein turnover via ubiquitination, especially for mitochondrial and structural myofibrillar proteins. Mass spectrometry-based metabolomics revealed alterations in energy metabolism and fatty acid oxidation. These findings challenge the traditional assumptions regarding hemolytic risk during exercise in G6PD deficiency, suggesting a potential metabolic advantage in exercise performance for individuals carrying noncanonical G6PD variants.


Conflict of interest statement

Conflict-of-interest disclosure: A. D'Alessandro, K.C.H., and T.N. are founders of Omix Technologies Inc and Altis Biosciences LLC. A. D'Alessandro is a scientific advisory board member for Hemanext Inc and Macopharma Inc. The remaining authors declare no competing financial interests.

Figures

None
Graphical abstract
Figure 1.
Figure 1.
Characterization of G6PDMed− mice. (A) mQTL analysis of samples from 13 091 blood donors highlights correlation of succinate levels with polymorphic G6PD. (B) Locus zoom identifying G6PD as a target of interest. (C) An overview of glucose metabolism in redox homeostasis in RBCs. (D) Total abundance of 6-phosphogluconate (6P-gluconate) from metabolic tracing (sum of labeled and unlabeled) present in genotypes. (E) G6PD activity assay; (F) PPP activation as judged by relative levels of labeled 6P-gluconate to hexose phosphate. (G-H) CS testing of mice (n = 12) showed that G6PDMed− mice maintained a significantly faster CS (8% increase). Dashed lines indicate CS. (I) G6PDMed− mice have higher anaerobic work capacity (AWC) as measured by the slope, hG6PDND = 1715 and hG6PDMED- = 945.4 (significance, ∗P < .05, ∗∗P < .01, ∗∗∗∗P < .0001).
Figure 2.
Figure 2.
Metabolic alterations detected in the blood before and after exercise. (A) RBC and (B) plasma heat map with hierarchical clustering of the top 25 metabolites significantly different (analysis of variance [ANOVA]) between hG6PDND and hG6PDMed− taken from the before/after exercise fold change. Autoscaled metabolite abundances were compared before and after exercise between hG6PDND and hG6PDMed− genotypes. (C) Glycolysis, PPP, and long-chain FA intermediates before and after CS tests. Metabolite name is color coded according to fraction with plasma (blue) and RBC (red) and genotype is indicated by hG6PDND (blue) and hG6PDMed− (orange). (D) Succinate accumulation after exercise in the plasma and RBCs. (E) Mean corpuscular volumes (MCV) as a function of exercise in RBCs. (F) SEM images of RBC morphology before and after run to exhaustion. (G) Echinocyte-to-discocyte ratios before and after exercise expressed as relative percentages. (H) Before to after changes in markers of hemolysis in plasma (significance ∗P < .05, ∗∗P < .01, ∗∗∗P < .001, ∗∗∗∗P < .0001).
Figure 3.
Figure 3.
Cardiac physiology and protein expression in heart muscle. (A) Hemodynamics measurements. (B) Sarcomere length differences as determined through TEM analysis. (C) Mitochondrial quantification of TEM images. (D) TEM sections at 1 μm (mf, myofibrils; mi, mitochondria). (E) Genotype-specific protein expression was observed in the LV, as measured by t test. Protein abundances were grouped as being significantly increased (red box) or significantly decreased (blue box) in hG6PDMed− mice. (F) Each group was entered for GO enrichment analysis, per LV. Red bars indicate significantly increased and blue bars indicate significantly decreased biological processes in hG6PDMed− mice. (G) Proteomics identification of heart muscle–specific proteins. (H) Significant mitochondrial proteins identified in the heart muscle. (I) Extracellular matrix of LV composition differences identified via proteomics (significance ∗P < .05, ∗∗P < .01, ∗∗∗P < .001, ∗∗∗∗P < .0001).
Figure 4.
Figure 4.
Proteomics analysis of muscle revealed both tissue- and genotype-specific differences. (A) Muscle tissues (soleus and gastrocnemius) were isolated from hG6PDND and hG6PDMed− mice for proteomics analysis. (B) Principal component analysis (PCA) showed tissue-type specific differences. (C) Significant genotype-specific differences were observed for each tissue type, as measured by t test. Protein abundances were clustered as being significantly increased (red box) or significantly decreased (blue box) in hG6PDMed− mice. (D) Network analysis (OmicsNet, GO) of significant proteins in hG6PDMed− muscle tissues illustrating enriched biological pathways. Protein nodes were colored according to their associated enriched biological pathway. Significantly increased mitochondrial proteins in the (E) gastrocnemius and (F) soleus.
Figure 5.
Figure 5.
Metabolomics analysis of muscle and heart revealed both tissue- and genotype-specific differences. (A) Muscle and heart tissues were collected from hG6PDND and hG6PDMed− mice. The gastrocnemius and soleus excised from isolated muscle (as well as the LV and right ventricle), separated from the isolated heart were subjected to metabolomics analysis. (B) PCA showed differences between tissue types. Comparison between hG6PDND and hG6PDMed− genotypes showed significant differences in both (C) muscle and (D) heart tissues, as measured by t test. Genotype-specific differences were observed for (E) energy-related metabolites and polyamines in the heart tissues, as well as (F) acylcarnitines (AC) detected in muscle tissues. Genotype-specific comparisons were made using the t test (significance ∗P < .05, ∗∗P < .01, ∗∗∗P < .001, ∗∗∗∗P < .0001).
Figure 6.
Figure 6.
Protein ubiquitination profiles are tissue and genotype dependent. (A) Summary of protein ubiquitination of the formation of K-GG. (B-D) Top 100 proteins identified through gly-gly searches as measured by t test for the (B) LV, (C) the gastrocnemius, and the (D) soleus. Significant proteins in hG6PDMed− tissues (E) LV, (F) gastrocnemius, and (G) soleus were entered into OmicsNet for network analysis and GO analysis of enriched biological pathways. Protein nodes were colored according to their associated enriched biological pathway.

References

    1. Luzzatto L, Ally M, Notaro R. Glucose-6-phosphate dehydrogenase deficiency. Blood. 2020;136(11):1225–1240. - PubMed
    1. Lee J, Poitras BT. Prevalence of glucose-6-phosphate dehydrogenase deficiency, U.S. Armed Forces, May 2004-September 2018. MSMR. 2019;26(12):14–17. - PubMed
    1. Chen L, Zhang Z, Hoshino A, et al. NADPH production by the oxidative pentose-phosphate pathway supports folate metabolism. Nat Metab. 2019;1:404–415. - PMC - PubMed
    1. Nemkov T, Reisz JA, Xia Y, Zimring JC, D'Alessandro A. Red blood cells as an organ? How deep omics characterization of the most abundant cell in the human body highlights other systemic metabolic functions beyond oxygen transport. Expert Rev Proteomics. 2018;15(11):855–864. - PubMed
    1. Page GP, Kanias T, Guo YJ, et al. Multiple-ancestry genome-wide association study identifies 27 loci associated with measures of hemolysis following blood storage. J Clin Invest. 2021;131(13) - PMC - PubMed

Substances