. 2024 Nov 7;111(11):2542-2560.
doi: 10.1016/j.ajhg.2024.10.001.

An abdominal obesity missense variant in the adipocyte thermogenesis gene TBX15 is implicated in adaptation to cold in Finns

Affiliations

An abdominal obesity missense variant in the adipocyte thermogenesis gene TBX15 is implicated in adaptation to cold in Finns

Milena Deal et al. Am J Hum Genet. .

Abstract

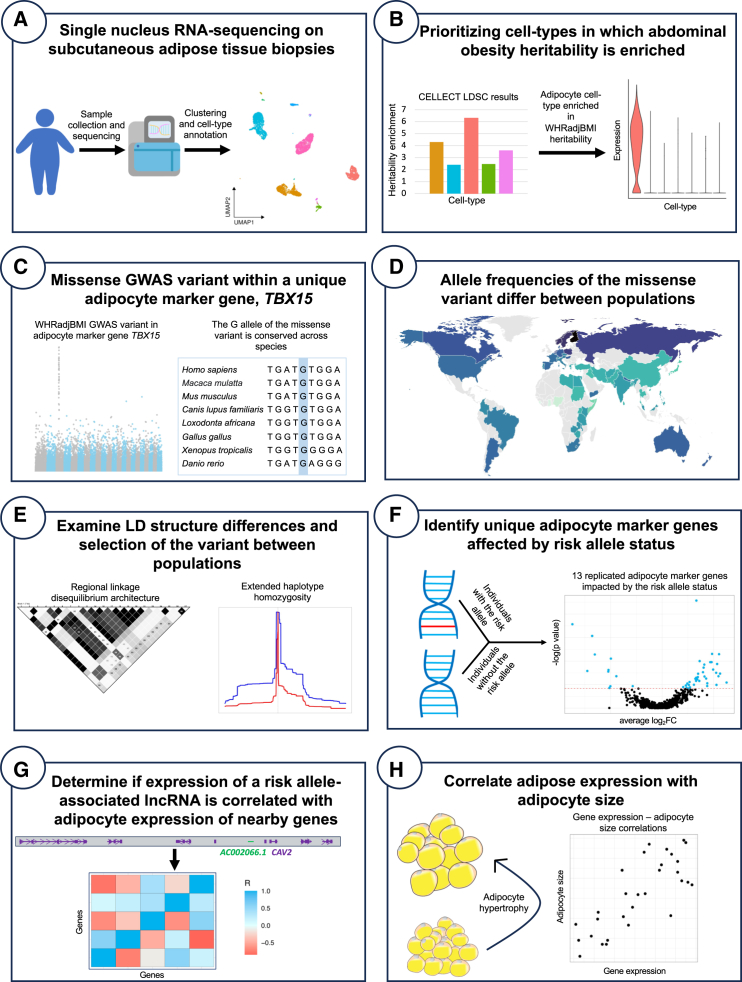
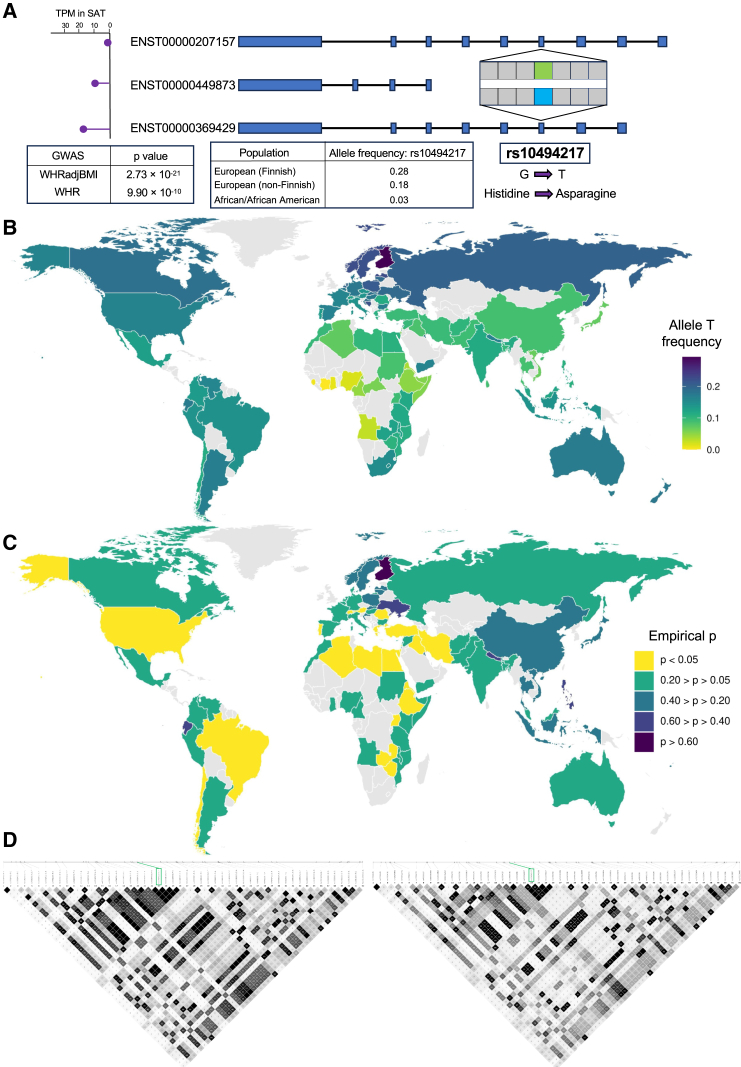
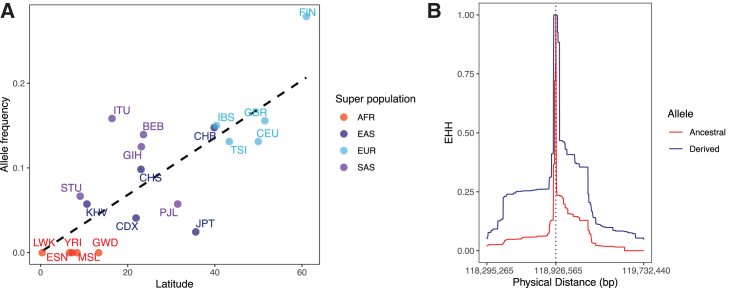
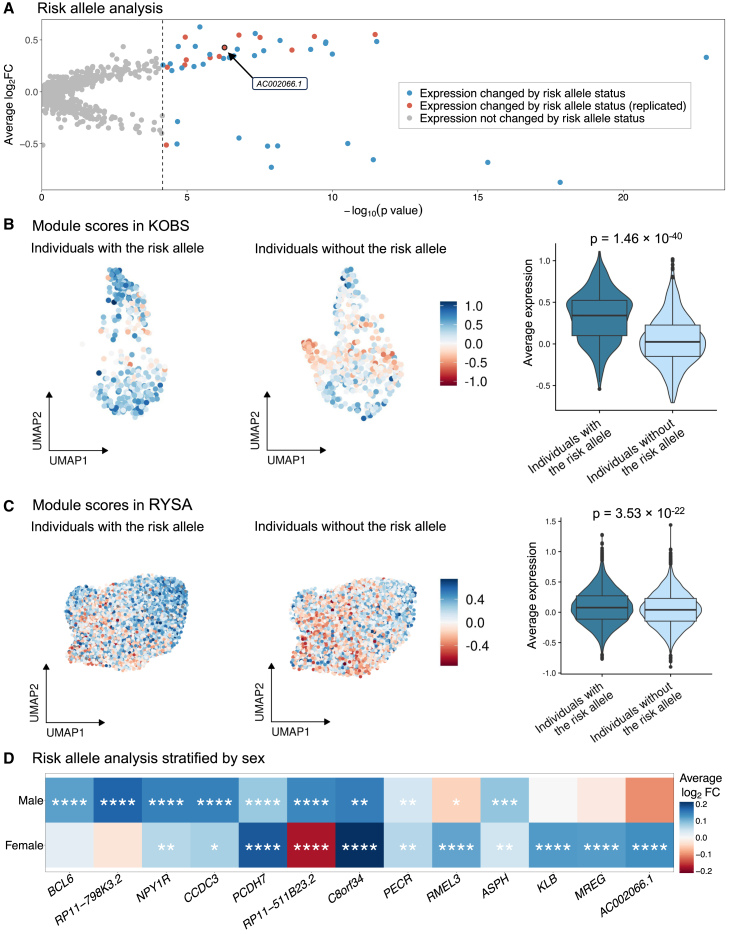
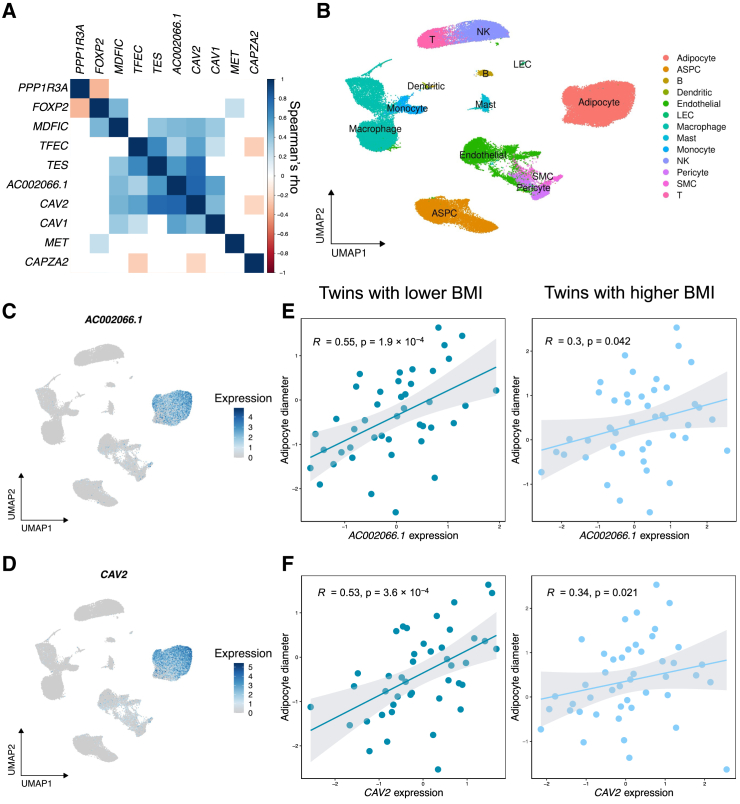
Mechanisms of abdominal obesity GWAS variants have remained largely unknown. To elucidate these mechanisms, we leveraged subcutaneous adipose tissue (SAT) single nucleus RNA-sequencing and genomics data. After discovering that heritability of abdominal obesity is enriched in adipocytes, we focused on a SAT unique adipocyte marker gene, the transcription factor TBX15, and its abdominal obesity-associated deleterious missense variant, rs10494217. The allele frequency of rs10494217 revealed a north-to-south decreasing gradient, with consistent significant FST values observed for 25 different populations when compared to Finns, a population with a history of genetic isolation. Given the role of Tbx15 in mouse thermogenesis, the frequency may have increased as an adaptation to cold in Finns. Our selection analysis provided significant evidence of selection for the abdominal obesity risk allele T of rs10494217 in Finns, with a north-to-south decreasing trend in other populations, and demonstrated that latitude significantly predicts the allele frequency. We also discovered that the risk allele status significantly affects SAT adipocyte expression of multiple adipocyte marker genes in trans in two cohorts. Two of these trans genes have been connected to thermogenesis, supporting the thermogenic effect of the TBX15 missense variant as a possible cause of its selection. Adipose expression of one trans gene, a lncRNA, AC002066.1, was strongly associated with adipocyte size, implicating it in metabolically unhealthy adipocyte hypertrophy. In summary, the abdominal obesity variant rs10494217 was selected in Finns, and individuals with the risk allele have trans effects on adipocyte expression of genes relating to thermogenesis and adipocyte hypertrophy.

Keywords: SAT; T-box transcription factor 15; TBX15; WHRadjBMI; abdominal obesity; adipocyte hypertrophy; population genetics; selection; single nucleus RNA sequencing; subcutaneous adipose tissue; thermogenesis; trans regulation; waist-hip ratio adjusted for body mass index.


Conflict of interest statement

Declaration of interests The authors declare no competing interests.

Figures

Figure 1
Figure 1
A stepwise overview of our study design investigating an abdominal obesity GWAS missense variant in TBX15 for signals of selection and adipose cell-type expression changes (A) We generated subcutaneous adipose tissue (SAT) single nucleus RNA-sequencing (snRNA-seq) data from biopsies from Finnish individuals with obesity undergoing bariatric surgery, then clustered and annotated the cell types. (B) We found the SAT adipocyte cell type to be enriched for the heritability of abdominal obesity. (C) We focused on a specific unique adipocyte marker gene containing an abdominal obesity GWAS missense variant. (D) We found a north-to-south allele frequency gradient for the missense variant. (E) We examined the LD architecture around the variant and investigated the variant for signals of selection. (F) We compared adipocyte expression of unique adipocyte marker genes between the individuals that do and do not harbor the risk allele of the abdominal obesity GWAS missense variant. (G) We investigated whether adipocyte expression of any of the risk allele-associated long non-coding RNAs (lncRNAs) is correlated with expression of nearby genes, suggesting a further downstream regulatory mechanism of TBX15 in trans. (H) We correlated adipose expression of a risk allele-associated lncRNA (and regional genes correlated with it) with adipocyte size in an independent cohort to search for effects on adipocyte hypertrophy.
Figure 2
Figure 2
Allele frequencies and regional linkage disequilibrium differ between Finns and other populations for rs10494217, the missense variant present in two transcripts of TBX15 (A) A schematic overview showing the location of the missense variant, rs10494217, within TBX15 and expression of the three TBX15 transcripts in SAT using GTEx. Allele frequencies shown for rs10494217 are from the gnomAD database. GWAS association p values for the traits are obtained from the GIANT-UKB meta-analysis for both waist-hip ratio (WHR) and abdominal obesity, measured by waist-hip ratio adjusted for body mass index (WHRadjBMI). (B) Allele frequencies of the TBX15 missense variant based on the country of origin among the UK Biobank (UKB) participants. Allele frequency is shown for populations with n > 30. (C) We show empirical p values for the FST of rs10494217, calculated based on the proportion of SNPs with greater FST than rs10494217. A total of 10,000 SNPs were used for the empirical distribution, chosen based on their similar minor allele frequencies to rs10494217 in the METSIM cohort. (D) LD (linkage disequilibrium) architecture surrounding the missense variant rs10494217 (labeled in the green box) in the Finns (left, n = 6,738 in METSIM) and Brits (right, n = 6,738 in UKB) for the region on chromosome 1 between 118,916,565 and 118,942,565 bp in GRCh38. The same SNPs were included for both cohorts. Maps were constructed using HaploView and LD values are shown in R2.
Figure 3
Figure 3
The risk allele T of the abdominal obesity GWAS SNP, rs10494217, differs in frequency on a latitudinal cline and is selected for in the Finns (A) Correlation of the allele frequency of the T risk allele of rs10494217 with latitude using the populations of the 1000 Genomes Project. The trend line depicts the results of the PGLS analysis. Superpopulations based on the classifications by the 1000 Genomes Project are shown as follows: AFR (African), EAS (East Asian), EUR (European), and SAS (South Asian). The populations are represented as follows: BEB (Bengali in Bangladesh), CDX (Chinese Dai in Xishuangbanna, China), CEU (Utah residents, USA, with Northern and Western European ancestry), CHB (Han Chinese in Beijing, China), CHS (Southern Han Chinese), ESN (Esan in Nigeria), FIN (Finnish from Finland), GBR (British from England and Scotland), GIH (Gujarati Indians in Houston, USA), GWD (Gambian [Mandinka] in Western Divisions in Gambia), IBS (Iberian populations in Spain), ITU (Indian Telugu in the UK), JPT (Japanese in Tokyo, Japan), KHV (Kinh in Ho Chi Minh City, Vietnam), LWK (Luhya in Webuye, Kenya), MSL (Mende in Sierra Leone), PJL (Punjabi in Lahore, Pakistan), STU (Sri Lankan Tamil in the UK), TSI (Toscani in Italia), and YRI (Yoruba in Ibadan, Nigeria). (B) Extended haplotype homozygosity (EHH) is shown for rs10494217 in the Finns (n = 6,738 in METSIM). The derived allele indicates the T risk allele for abdominal obesity and the ancestral allele indicates the G allele. The vertical dashed line depicts the genomic location of rs10494217. The genomic coordinates shown refer to the GRCh38 genome build.
Figure 4
Figure 4
The effect of abdominal obesity variant rs10494217 on adipocyte expression replicated for 13 unique adipocyte marker genes (A) Analysis comparing adipocyte expression of unique adipocyte marker genes by the risk allele status of the abdominal obesity GWAS variant rs10494217. Average log-fold change and the Wilcoxon p values are shown for KOBS (n = 8), and we show in red the 13 genes replicated in RYSA (n = 68). (B and C) Module scores based on average adipocyte expression of the 12 genes upregulated in the individuals that harbor the risk allele in adipocytes in KOBS (total n = 8; 4 individuals with the risk allele) (B) and RYSA (total n = 68; 36 individuals with the risk allele) (C). We label the Wilcoxon p value comparing the module scores between the two groups. (D) Adipocyte expression differences by the risk allele status, shown separately in males (total n = 19; 11 individuals with the risk allele) and females (total n = 49; 25 individuals with the risk allele) of the RYSA cohort. Significance thresholds for the Bonferroni adjusted Wilcoxon p values: padj < 0.05, ∗∗padj < 0.01, ∗∗∗padj < 0.001, and ∗∗∗∗padj < 0.0001.
Figure 5
Figure 5
Expression of trans long non-coding RNA, AC002066.1, is correlated with expression of regional genes, including CAV2, and adipocyte size (A) Gene-gene Spearman correlations for the genes in the long non-coding RNA (lncRNA), AC002066.1, region using adipocyte pseudobulk in RYSA (n = 68). The scale shows Spearman’s rho. White boxes indicate the pairwise correlations that are not nominally significant (p > 0.05). (B) Uniform manifold and approximation projection (UMAP) visualization of 67,563 nuclei in the SAT snRNA-seq data from RYSA (n = 68) colored by the cell type. The cell types are as follows: ASPC refers to adipose stem and progenitor cells, B to B cells, LEC to lymphatic endothelial cells, NK to natural killer cells, SMC to smooth muscle cells, and T to T cells. (C) UMAP visualization of AC002066.1 expression in the SAT snRNA-seq data from RYSA (n = 68). (D) UMAP visualization of CAV2 adipocyte expression in the SAT snRNA-seq data from RYSA (n = 68). (E) Spearman correlations and p values of the correlations between adipose expression in TPMs of AC0002066.1 and adipocyte diameter using the Finnish BMI-discordant MZ twin cohort. Each twin pair was divided into the lower BMI (n = 43) and higher BMI (n = 45) groups, and the correlations were performed separately in each group. (F) Spearman correlations and p values of the correlations between adipose expression of CAV2 and adipocyte diameter using the Finnish BMI-discordant MZ twin cohort. Each twin pair was divided into the lower BMI (n = 43) and higher BMI (n = 45) groups, and the correlations were performed separately in each group.

References

    1. Martin S.S., Aday A.W., Almarzooq Z.I., Anderson C.A.M., Arora P., Avery C.L., Baker-Smith C.M., Barone Gibbs B., Beaton A.Z., Boehme A.K., et al. 2024 Heart Disease and Stroke Statistics: A Report of US and Global Data From the American Heart Association. Circulation. 2024;149:e347–e913. doi: 10.1161/CIR.0000000000001209. - DOI - PubMed
    1. Ashwell M., Cole T.J., Dixon A.K. Obesity: new insight into the anthropometric classification of fat distribution shown by computed tomography. BMJ. 1985;290:1692–1694. doi: 10.1136/bmj.290.6483.1692. - DOI - PMC - PubMed
    1. Seidell J.C., Björntorp P., Sjöström L., Sannerstedt R., Krotkiewski M., Kvist H. Regional distribution of muscle and fat mass in men--new insight into the risk of abdominal obesity using computed tomography. Int. J. Obes. 1989;13:289–303. - PubMed
    1. Emdin C.A., Khera A.V., Natarajan P., Klarin D., Zekavat S.M., Hsiao A.J., Kathiresan S. Genetic Association of Waist-to-Hip Ratio With Cardiometabolic Traits, Type 2 Diabetes, and Coronary Heart Disease. JAMA. 2017;317:626–634. doi: 10.1001/jama.2016.21042. - DOI - PMC - PubMed
    1. Meisinger C., Döring A., Thorand B., Heier M., Löwel H. Body fat distribution and risk of type 2 diabetes in the general population: are there differences between men and women? The MONICA/KORA Augsburg Cohort Study. Am. J. Clin. Nutr. 2006;84:483–489. doi: 10.1093/ajcn/84.3.483. - DOI - PubMed