. 2024 Nov 19;5(11):101808.
doi: 10.1016/j.xcrm.2024.101808. Epub 2024 Nov 7.

Cytometry masked autoencoder: An accurate and interpretable automated immunophenotyper

Affiliations

Cytometry masked autoencoder: An accurate and interpretable automated immunophenotyper

Jaesik Kim et al. Cell Rep Med. .

Abstract

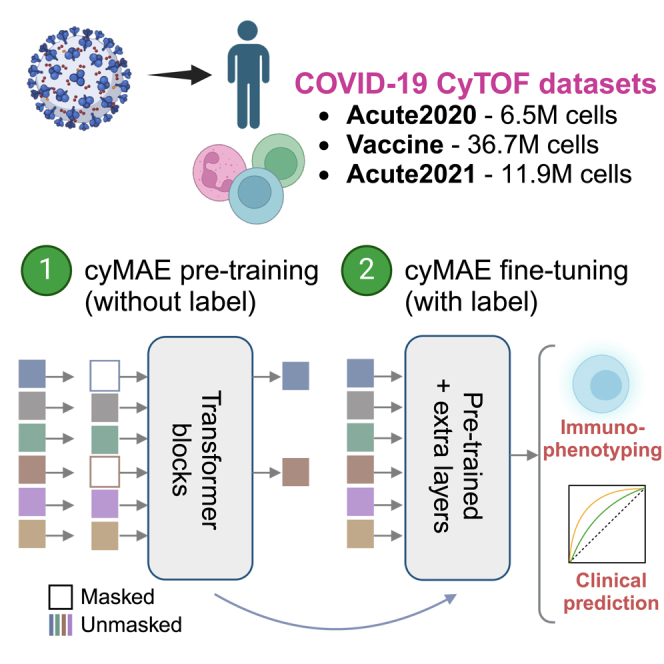
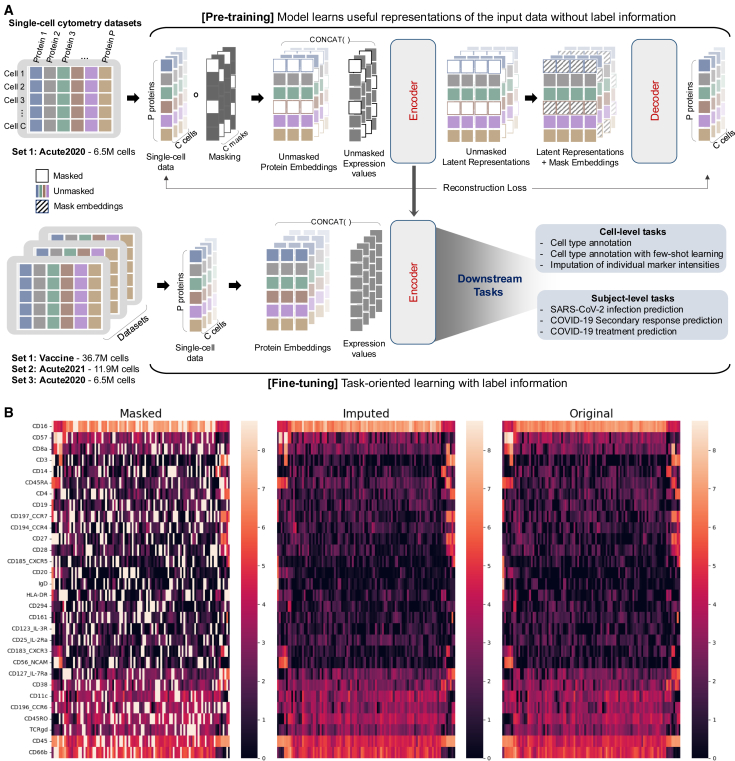
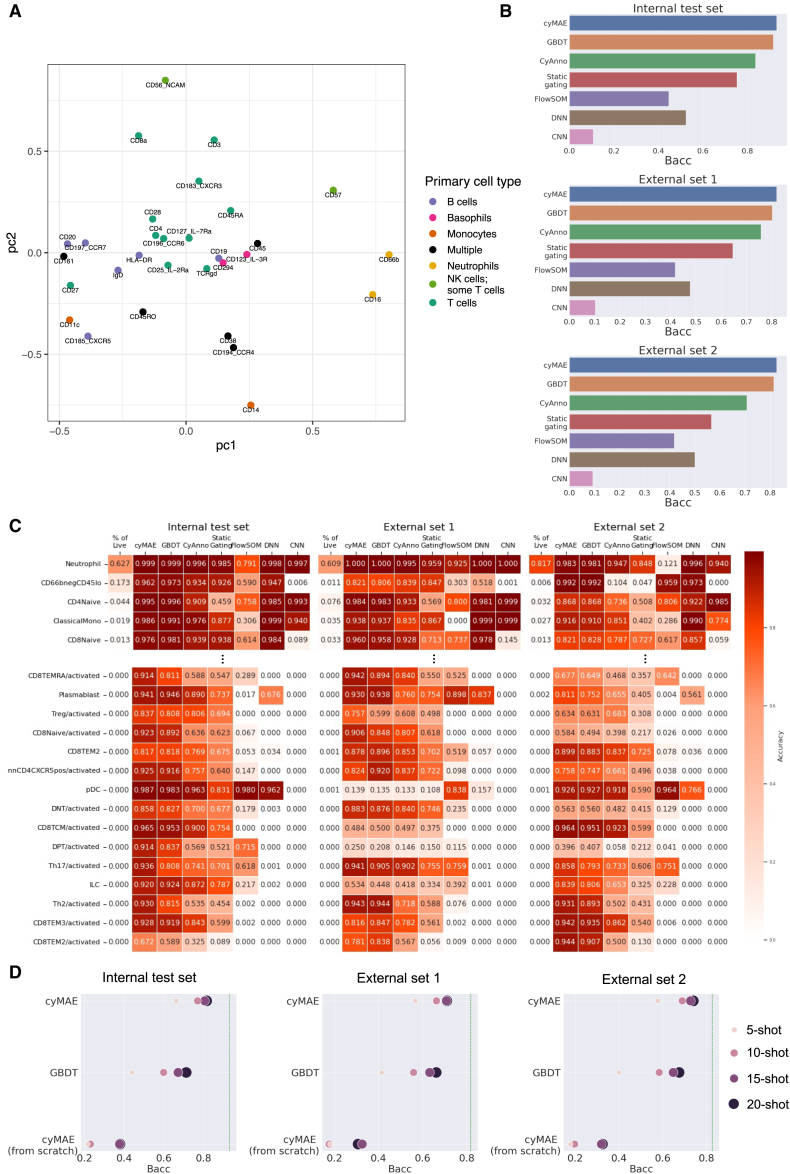
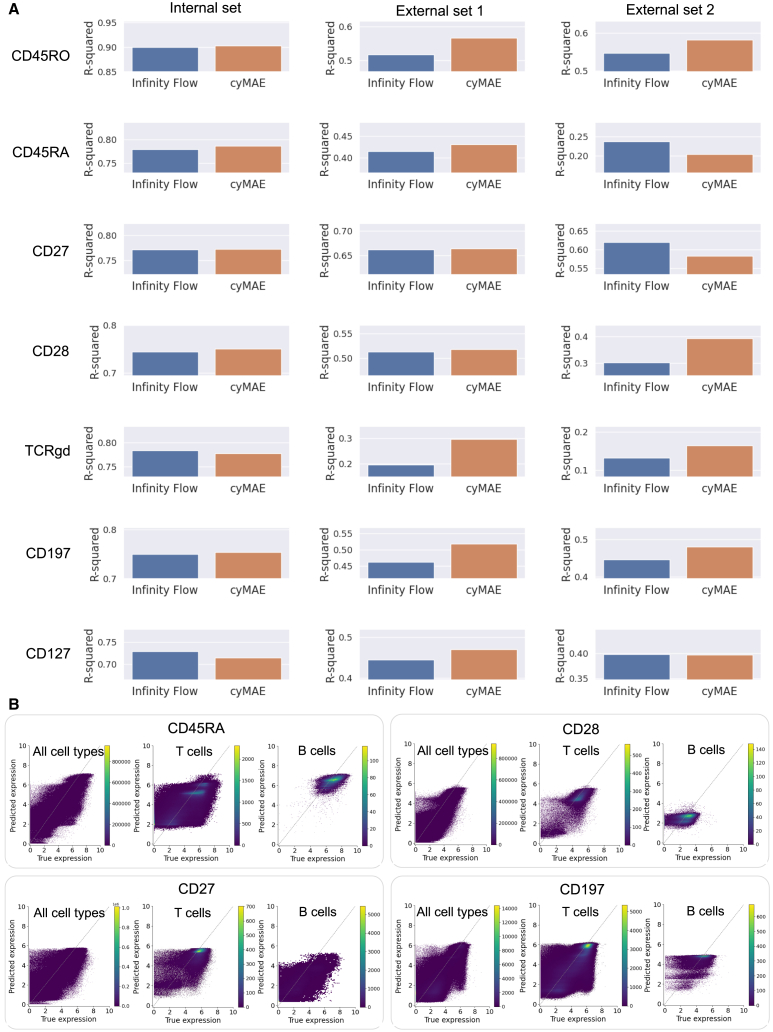
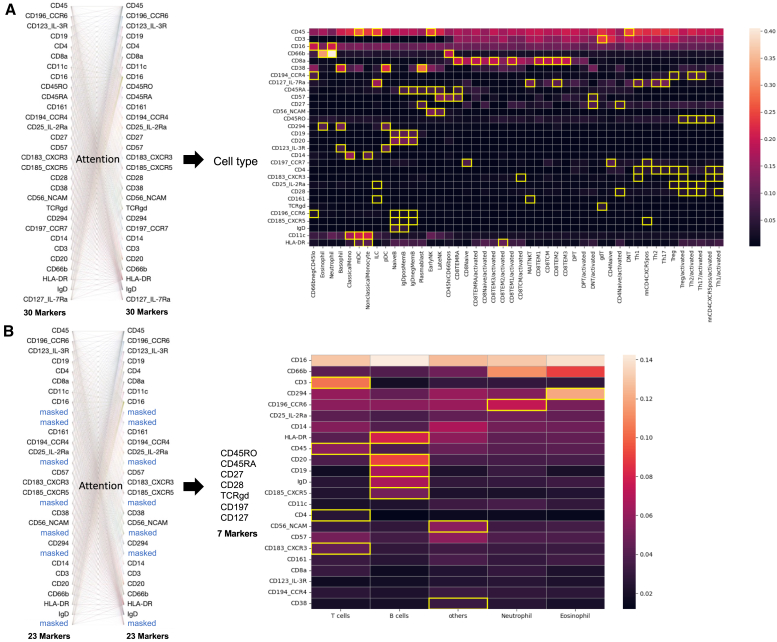
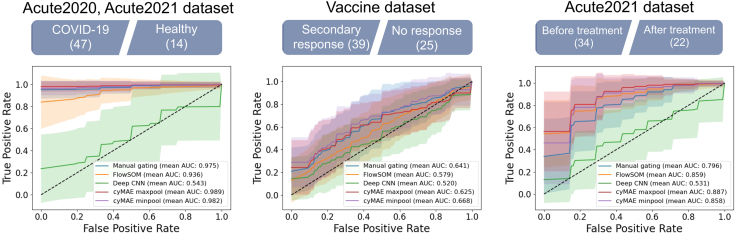
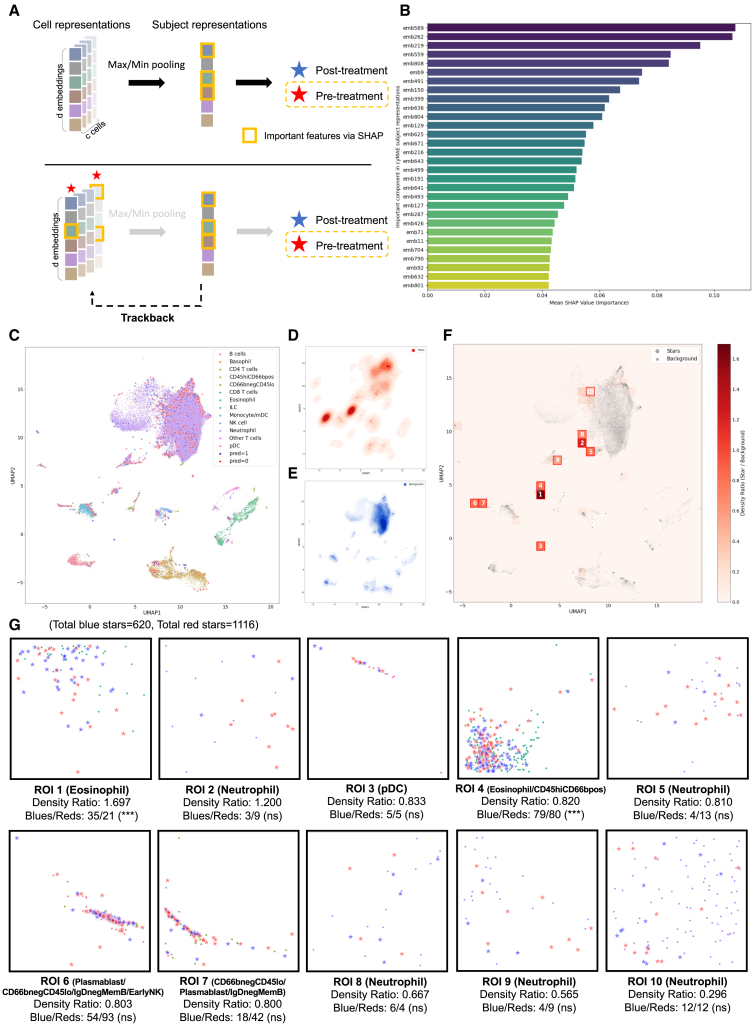
Single-cell cytometry data are crucial for understanding the role of the immune system in diseases and responses to treatment. However, traditional methods for annotating cytometry data face challenges in scalability, robustness, and accuracy. We propose a cytometry masked autoencoder (cyMAE), which automates immunophenotyping tasks including cell type annotation. The model upholds user-defined cell type definitions, facilitating interpretability and cross-study comparisons. The training of cyMAE has a self-supervised phase, which leverages large amounts of unlabeled data, followed by fine-tuning on specialized tasks using smaller amounts of annotated data. The cost of training a new model is amortized over repeated inferences on new datasets using the same panel. Through validation across multiple studies using the same panel, we demonstrate that cyMAE delivers accurate and interpretable cellular immunophenotyping and improves the prediction of subject-level metadata. This proof of concept marks a significant step forward for large-scale immunology studies.

Keywords: automated gating; deep learning; high-dimensional cytometry; immunophenotyping; machine learning; mass cytometry; representation learning.


Conflict of interest statement

Declaration of interests E.J.W. is a member of the Parker Institute for Cancer Immunotherapy, which supports cancer immunotherapy research in his laboratory. E.J.W. is an advisor for Arsenal Biosciences, Coherus, Danger Bio, IpiNovyx, NewLimit, Marengo, Pluto Immunotherapeutics, Related Sciences, Santa Ana Bio, and Synthekine. E.J.W. is a founder of and holds stock in Coherus, Danger Bio, Prox Biosciences, and Arsenal Biosciences.

Figures

None
Graphical abstract
Figure 1
Figure 1
Overview of cyMAE pre-training and fine-tuning process (A) In the pre-training step, protein expression data are randomly masked for each cell. Only the unmasked protein identities undergo dimension expansion to create learnable unmasked protein embeddings. These embeddings are then concatenated with the unmasked protein expressions and fed into the encoder. This encoder generates unmasked latent representations, which are merged with learnable mask embeddings and fed to the decoder for reconstruction of the masked values. In the fine-tuning step, the pre-trained encoder produces latent representations for both cells and subjects, facilitating cell-level and subject-level downstream tasks, respectively. The fine-tuning datasets need to be designed using the exact same panel as the pre-training dataset. (B) From left to right, masked, imputed (reconstructed), and original data. Each row represents a marker protein, and each column represents a randomly sampled cell. Initially, 25% of the original data are randomly masked, shown in white in the masked data visualization. cyMAE effectively reconstructs these masked regions, demonstrating the model’s accuracy.
Figure 2
Figure 2
Evaluation of cyMAE protein embeddings and cell type annotation across various datasets (A) Principal-component analysis plot of the cyMAE protein embeddings, demonstrating how the model, through unsupervised pre-training, effectively learns protein embeddings that represent the spatial closeness of antibody probes. (B) Model comparisons in the 46 cell type annotation with balanced accuracy (Bacc). The internal test set is Vaccine dataset after train-test split, the external set 1 is Acute2021, and the external set 2 is Acute2020. GBDT is a gradient boosting decision tree. Static gating is a method to aggregate into a single consensus gate for each gate in the hierarchy (see STAR Methods). Deep neural network (DNN) denotes a fully connected neural network, used as a cell type annotator in methods like DGCyTOF and DeepCyTOF for cytometry data analysis. Convolutional neural network (CNN) denotes a model that uses the same convolution layers as Deep CNN without pooling layers for the cell-level task. (C) Accuracy of cell type annotation for both 5 abundant and 15 rare cell types. (D) The few-shot learning for cell type annotation. cyMAE (from scratch) refers to the same model architecture as cyMAE but without pre-training. Each green dashed line represents the performance of the full fine-tuned cyMAE from (B).
Figure 3
Figure 3
Comparison of imputation performance between cyMAE and Infinity Flow (A) R-squared comparison between Infinity Flow and cyMAE for the imputation task. A total 7 markers were masked and then predicted by the two models. (B) Plots of actual versus predicted expression levels for each marker in the external set (Vaccine dataset). The dashed line represents the ideal relationship, serving as a reference to assess the performance.
Figure 4
Figure 4
Interpretation in cell type annotation and imputation tasks by the attention scores (A) For the Acute2021 dataset (external set 1), the heatmap shows protein markers with high attention score as bright red for each cell type and highlights the relatively higher scores on each marker in yellow box. (B) From 23 markers to impute the other 7 markers, the attention score measures which input features have high attention from the other features during prediction. For the Vaccine dataset (external set 1), the heatmap shows the protein markers with high attention score as bright white or red for each cell type with highlighting the relatively higher scores on each marker in a yellow box. For the left figure in (A) and (B), we used Bertvis for visualization of attention weights.
Figure 5
Figure 5
Classification and prediction of COVID-19 outcomes using the cyMAE subject representations From left to right, COVID-19 patient and healthy subject classification using the Acute2020 and Acute2021 dataset, secondary immune response against COVID-19 prediction using the Vaccine dataset, and COVID-19 pre- and post-treatment classification using the Acute2021 dataset. The number in parentheses is the sample size. All the experiments are conducted by 5-fold cross-validation repeating 10 times. The shade for each curve represents the variance of these experiments. Green dashed lines stand for performance of a random classifier.
Figure 6
Figure 6
Analysis of cell contributions to subject representations and their impact on COVID-19 pre- and post-treatment classification (A) The process of tracking back from subject representations to cell-level contributions using global maximum or minimum pooling in cyMAE. (B) Identification of key components in the subject representation using SHAP, differentiating post-treatment and pre-treatment predictions. (C) Uniform manifold approximation and projection (UMAP) plots showing the distribution of the starred cells and randomly selected background cells in the cyMAE cell embedding space. Post-treatment associated cells (blue stars) are labeled as “pred = 1,” and pre-treatment associated cells (red cells) are labeled as “pred = 0.” (D) The distribution of the all starred cells. (E) The distribution of the background cells. (F) A heatmap showing the ratios between the starred cells and background cells, with the top 10 ROIs highlighted. (G) For each ROI, predominantly representing one or more specific cell types, the ratio of blue stars to red stars is analyzed using using the Fisher’s exact test, with false discovery rate-corrected p values. (∗∗∗) indicates p value <0.001; (ns) indicates p value >0.05.

References

    1. Maecker H.T., McCoy J.P., Nussenblatt R. Standardizing immunophenotyping for the Human Immunology Project. Nat. Rev. Immunol. 2012;12:191–200. doi: 10.1038/nri3158. - DOI - PMC - PubMed
    1. Mair F., Hartmann F.J., Mrdjen D., Tosevski V., Krieg C., Becher B. The end of gating? An introduction to automated analysis of high dimensional cytometry data. Eur. J. Immunol. 2016;46:34–43. doi: 10.1002/eji.201545774. - DOI - PubMed
    1. Olsen L.R., Leipold M.D., Pedersen C.B., Maecker H.T. The anatomy of single cell mass cytometry data. Cytometry. 2019;95:156–172. doi: 10.1002/cyto.a.23621. - DOI - PubMed
    1. Van Gassen S., Callebaut B., Van Helden M.J., Lambrecht B.N., Demeester P., Dhaene T., Saeys Y. FlowSOM: Using self-organizing maps for visualization and interpretation of cytometry data. Cytometry A. 2015;87:636–645. doi: 10.1002/cyto.a.22625. - DOI - PubMed
    1. Levine J.H., Simonds E.F., Bendall S.C., Davis K.L., Amir E.a.D., Tadmor M.D., Litvin O., Fienberg H.G., Jager A., Zunder E.R., et al. Data-Driven Phenotypic Dissection of AML Reveals Progenitor-like Cells that Correlate with Prognosis. Cell. 2015;162:184–197. doi: 10.1016/j.cell.2015.05.047. - DOI - PMC - PubMed

LinkOut - more resources