. 2024 Nov 9;15(1):9699.
doi: 10.1038/s41467-024-53954-3.

Reconstructing the regulatory programs underlying the phenotypic plasticity of neural cancers

Affiliations

Reconstructing the regulatory programs underlying the phenotypic plasticity of neural cancers

Ida Larsson et al. Nat Commun. .

Abstract

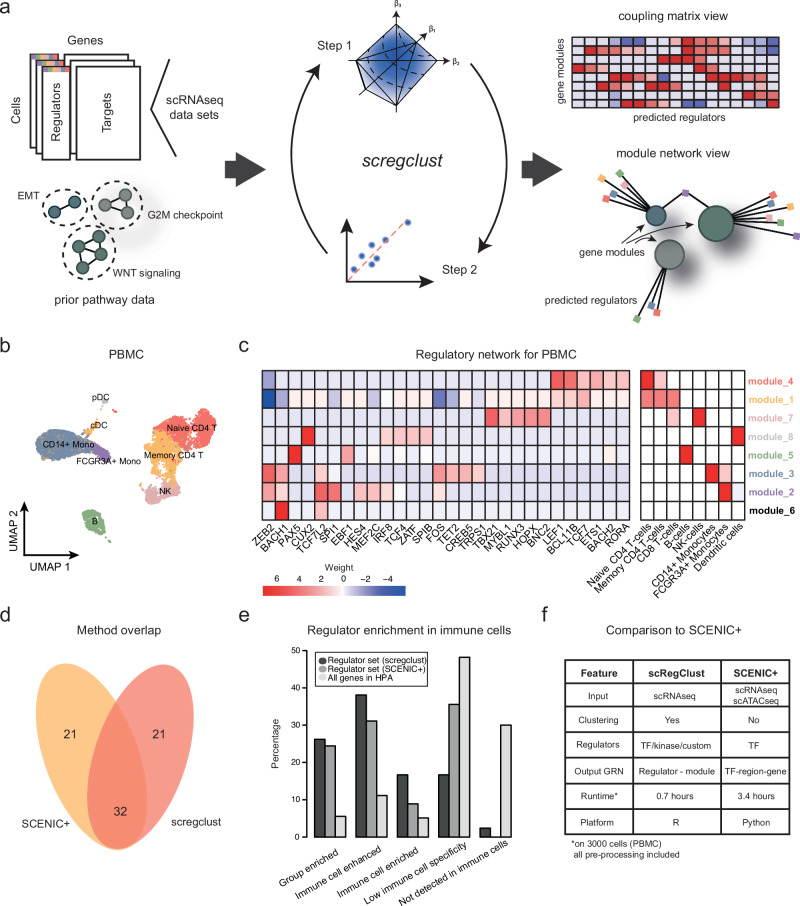
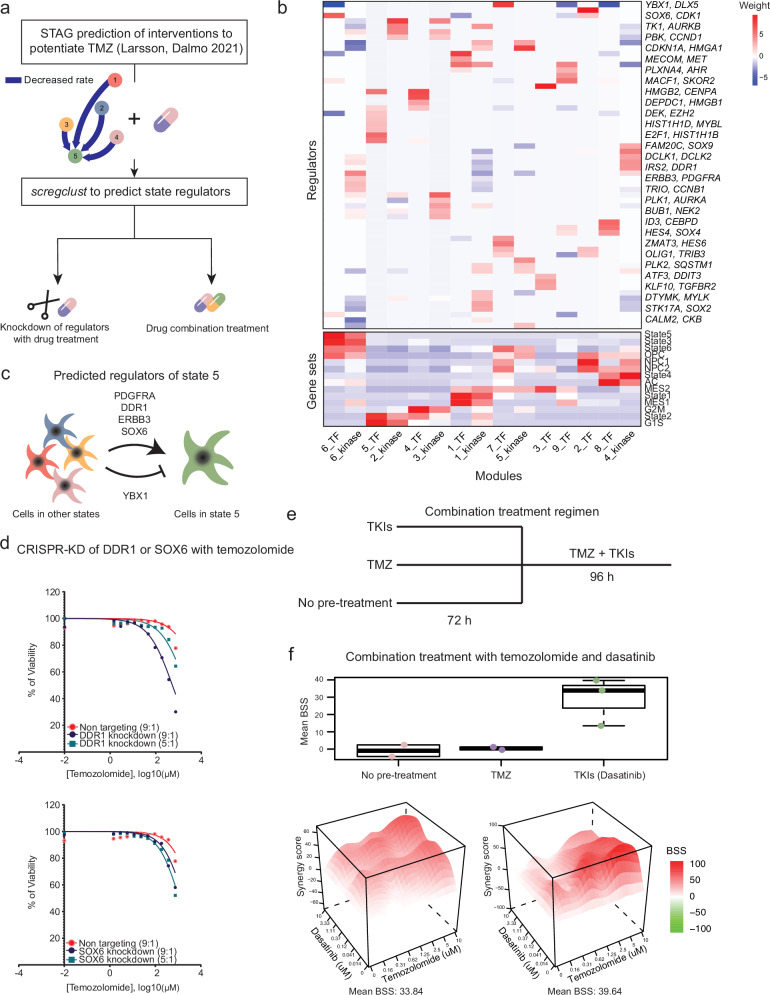
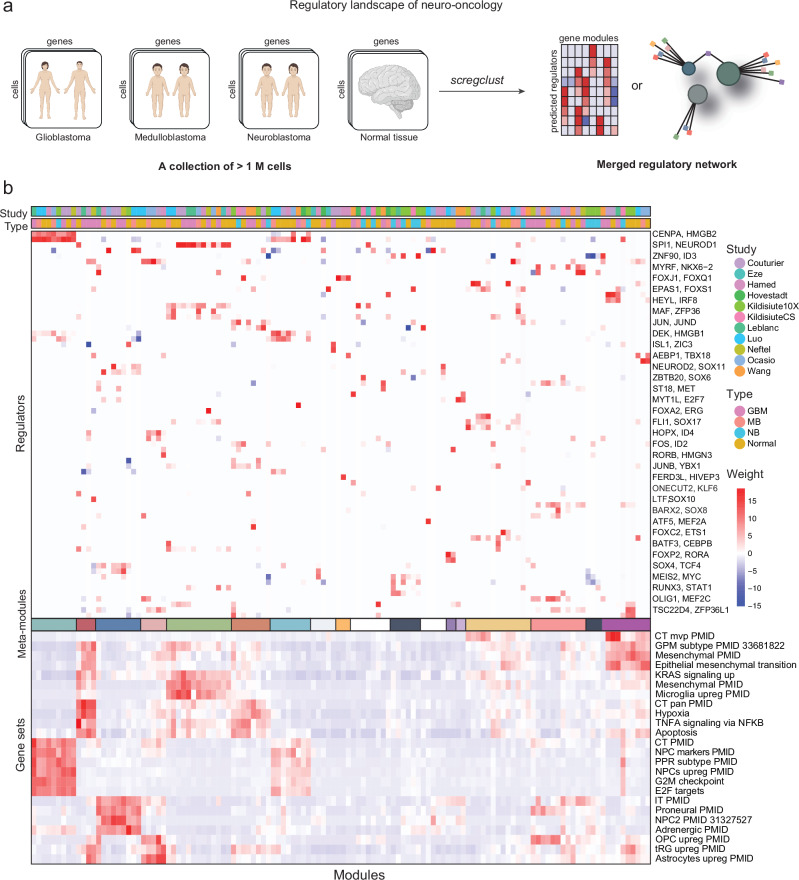
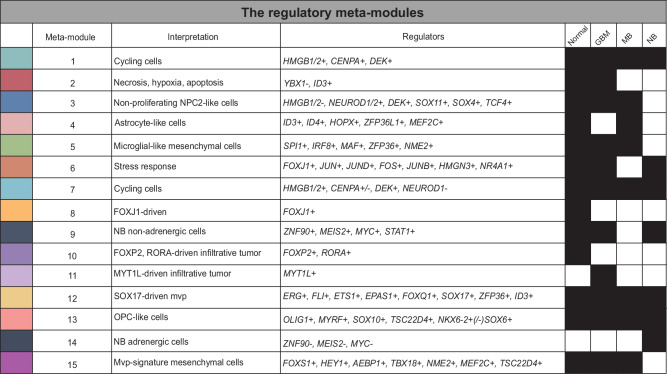
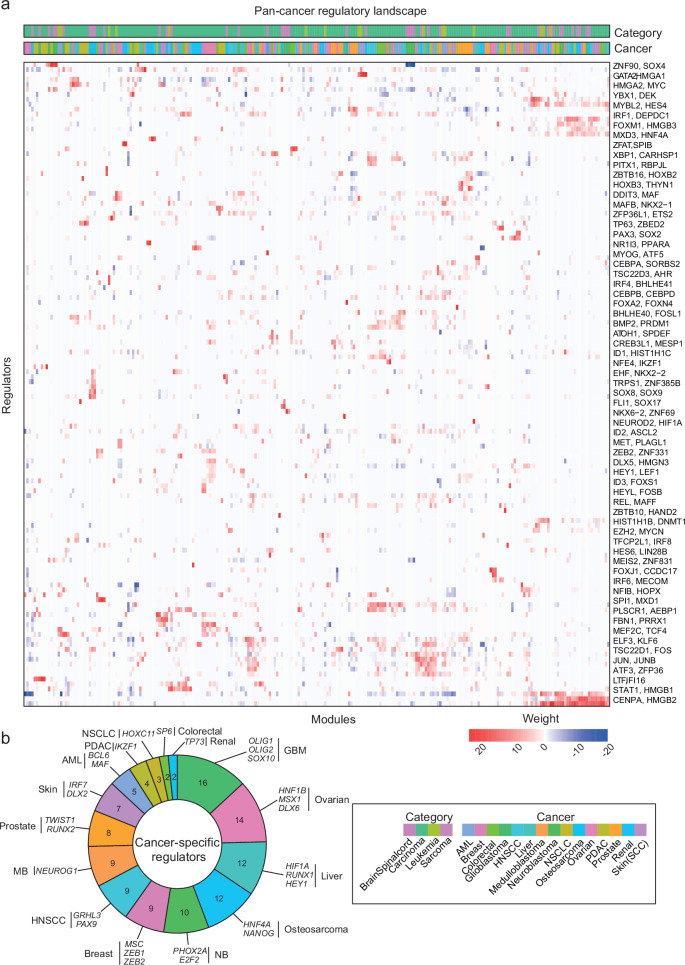
Nervous system cancers exhibit diverse transcriptional cell states influenced by normal development, injury response, and growth. However, the understanding of these states' regulation and pharmacological relevance remains limited. Here we present "single-cell regulatory-driven clustering" (scregclust), a method that reconstructs cellular regulatory programs from extensive collections of single-cell RNA sequencing (scRNA-seq) data from both tumors and developing tissues. The algorithm efficiently divides target genes into modules, predicting key transcription factors and kinases with minimal computational time. Applying this method to adult and childhood brain cancers, we identify critical regulators and suggest interventions that could improve temozolomide treatment in glioblastoma. Additionally, our integrative analysis reveals a meta-module regulated by SPI1 and IRF8 linked to an immune-mediated mesenchymal-like state. Finally, scregclust's flexibility is demonstrated across 15 tumor types, uncovering both pan-cancer and specific regulators. The algorithm is provided as an easy-to-use R package that facilitates the exploration of regulatory programs underlying cell plasticity.


Conflict of interest statement

The authors declare no competing interests.

Figures

Fig. 1
Fig. 1. A regulatory-driven clustering method.
a A schematic overview of the algorithm pipeline from gene expression data to regulatory networks. b UMAP embedding of the PBMC cells colored according to immune cell type assignment. Abbreviations: Mono monocytes, T T-cells, B B-cells, NK natural killer cells, pDC plasmacytoid dendritic cells, cDC classical dendritic cells. c The regulatory table inferred by scregclust. In the left panel, rows correspond to modules and columns to regulators (TFs). The scale in the heatmap goes from strong positive regulation (red) to strong negative regulation (blue), as indicated by the key. In the right panel, rows correspond to modules and columns to immune cell type gene signatures. Heatmap color indicates degree of overlap between module gene content and gene signatures, as quantified by Jaccard Index. Module name color (rows) correspond to colors in (b), indicating the most enriched immune cell type. Source data are provided as a Source Data file. d Venn diagram showing the overlap in identified regulators between SCENIC+ and scregclust. e Annotation of immune cell specificity of the identified regulators by scregclust and SCENIC+ according to the Human Protein Atlas (HPA). Immune enriched/enhanced indicate that a gene’s mRNA level is at least 4-fold higher in an immune cell type compared to all other tissues, as defined by the authors of the HPA. The regulator sets are contrasted to the average annotation of all genes in the HPA (n = 13157). f Comparison between scregclust and SCENIC+.
Fig. 2
Fig. 2. Method tuning and analysis tools.
Results from scregclust run on simulated scRNAseq count data (see the Supplementary Material for details on data generation). a Average true positive rate (TPR) shown against average false positive rate (FPR) in a ROC curve (dashed blue line), illustrating the quality of groundtruth regulator identification. TPR and FPR are computed per target gene and then averaged (n = 268, 270, 271, 271, 271, 80 from smallest to largest penalization). The corresponding penalty parameter is shown with each average. A table of adjusted Rand indices (ARI) between the estimated clustering and the true clustering, the average cluster homogeneity (CH), and the resulting number of modules (N) is shown as an inset. b Boxplots of predictive R2 per non-empty module (n = 6, 7, 6, 4, 4, 4, 2, cfr. N in Part A) and importance per regulator associated with at least one non-empty module (n = 900, 453, 96, 39, 25, 11, 3) shown across a progression of seven penalty parameters. Dashed lines indicate a region of solutions that demonstrates our selection rule. Boxplots consist of center lines (median), box bounds (1st and 3rd quartile), and upper and lower whiskers. Upper whiskers are drawn from the upper box bound to the largest data point but no further than 1.5 times the inter-quartile range (IRQ), analogous for lower whiskers. All data points not covered by box and whiskers are shown as dots. c Silhouette scores for each module for runs different initial K. Dashed red lines indicate the average silhouette score. Target genes have been grouped by module and sorted by decreasing silhouette score. Colors and labels to the left of each group indicate the module. d Average silhoutte scores, resulting number of modules, and average predictive R2 as a function of the initial number of modules K. Optimal selection indicated by red points.
Fig. 3
Fig. 3. scregclust predicts a way of potentiating temozolomide treatment in U3065MG cells.
a Flowchart of analysis. In our previous paper, we predicted that in the primary cell line U3065MG, TMZ treatment would be potentiated by an intervention that blocked transitions to “state 5”. Using scregclust, we predict regulators of state 5 and follow up on these predictions by combining TMZ with either CRISPR/Cas9-mediated knockdown of state 5 regulators, or combination treatment with a drug inhibiting these regulators. b The merged regulatory table from scregclust, with gene modules as columns and regulators as rows. Bottom panel display similarity of each module to gene signatures from ref. and ref. , as defined by Jaccard index. For ease of reading, two regulator (gene) names are indicated per row, the gene name after the comma are for the row below. Source data are provided as a Source Data file. c Schematic of the predicted regulation of state 5. PDGFRA, DDR1, ERBB3 and SOX6 positively regulated state 5 and should be knocked down to block transitions to state 5. YBX1 negatively regulated transitions to state 5 and should be overexpressed to block transitions to state 5. d Dose response curves for TMZ-treated cells with CRISPR/Cas9-mediated knockdown of DDR1 (top) and SOX6 (bottom). 10 doses of TMZ were tested, in a range from 750 μM to 1.25 μM. For each dose, duplicate measurements were taken. e Schematic of the three combination treatment arms. Cells were either pre-treated with tyrosine kinase inhibitors (TKIs) or TMZ for 72 h, or no pre-treatment, followed by combination treatment with TMZ and TKIs for 96 h. f Boxplot showing the median bliss synergy score (BSS) for the three treatment arms (biological replicates, n = 2, 2, and 3 in the order displayed in the figure), all replicates (top), and synergy landscape for the two combination experiments where the highest synergy scores were obtained (bottom). Boxplot for TKIs consist of center lines (median), box bounds (1st and 3rd quartile), and upper and lower whiskers. Upper whiskers are drawn from the upper box bound to the largest data point but no further than 1.5 times the inter-quartile range (IRQ), analogous for lower whiskers.
Fig. 4
Fig. 4. The regulatory landscape of neuro-oncology.
a Schematic overview of the analysis. Created in BioRender. Nelander, S. (2023) BioRender.com/b96y619. b Middle panel is the regulatory table from scregclust, with modules as columns and regulators (TFs) as rows. Top panel are annotation bars indicating what type and study each module originate from. Meta-modules (Fig. 5) are indicated by color in the bar below the middle panel. For ease of reading, two regulator (gene) names are indicated per row, the gene name after the comma are for the row below. Bottom panel display similarity of each module (Jaccard index) to a database of neuro-oncology related gene sets, derived from studies indicated by PubMed ID (PMID). Abbreviations: CT cellular tumor, MVP microvascular proliferation, GPM glycolytic/plurimetabolic, pan pseudopalisading cells around necrosis, NPC neural progenitor cells, PPR proliferating progenitor cells, IT infiltrative tumor, OPC oligodendrocyte progenitor cells, tRG truncated radial glia. Source data are provided as a Source Data file.
Fig. 5
Fig. 5. The regulatory meta-modules.
Description of the meta-modules defined in Fig. 4. The colors to the left correspond to the middle color bar in Fig. 4. The regulators listed regulate at least two of the individual modules included in the meta-module and all diseases represented in the meta-module are indicated by a filled box.
Fig. 6
Fig. 6. The pan-cancer regulatory landscape.
a Merged regulatory table from scregclust, with modules as columns and regulators (TFs) as rows. Top panel are annotation bars indicating what cancer type and cancer category each module originate from. For ease of reading, two regulator (gene) names are indicated per row, the gene name after the comma are for the row below. Source data are provided as a Source Data file. b The number of cancer-specific regulators per cancer type, colored as in (a). A couple of specific regulators per cancer type are displayed. Glioblastoma had the most cancer-specific regulators (16), with OLIG1, OLIG2 and SOX10 being three examples.

References

    1. Neftel, C. et al. An integrative model of cellular states, plasticity, and genetics for glioblastoma. Cell178, 835–849 (2019). - PMC - PubMed
    1. Richards, L. M. et al. Gradient of developmental and injury response transcriptional states defines functional vulnerabilities underpinning glioblastoma heterogeneity. Nat. Cancer2, 157–173 (2021). - PubMed
    1. Wang, Q. et al. Tumor evolution of glioma-intrinsic gene expression subtypes associates with immunological changes in the microenvironment. Cancer Cell32, 42–56 (2017). - PMC - PubMed
    1. Hara, T. et al. Interactions between cancer cells and immune cells drive transitions to mesenchymal-like states in glioblastoma. Cancer Cell39, 779–792.e11 (2021). - PMC - PubMed
    1. Gangoso, E. et al. Glioblastomas acquire myeloid-affiliated transcriptional programs via epigenetic immunoediting to elicit immune evasion. Cell184, 2454–2470 (2021). - PMC - PubMed

Publication types

MeSH terms

LinkOut - more resources