. 2024 Nov 8;15(1):9673.
doi: 10.1038/s41467-024-53891-1.

VTA dopamine neurons are hyperexcitable in 3xTg-AD mice due to casein kinase 2-dependent SK channel dysfunction

Affiliations

VTA dopamine neurons are hyperexcitable in 3xTg-AD mice due to casein kinase 2-dependent SK channel dysfunction

Harris E Blankenship et al. Nat Commun. .

Abstract

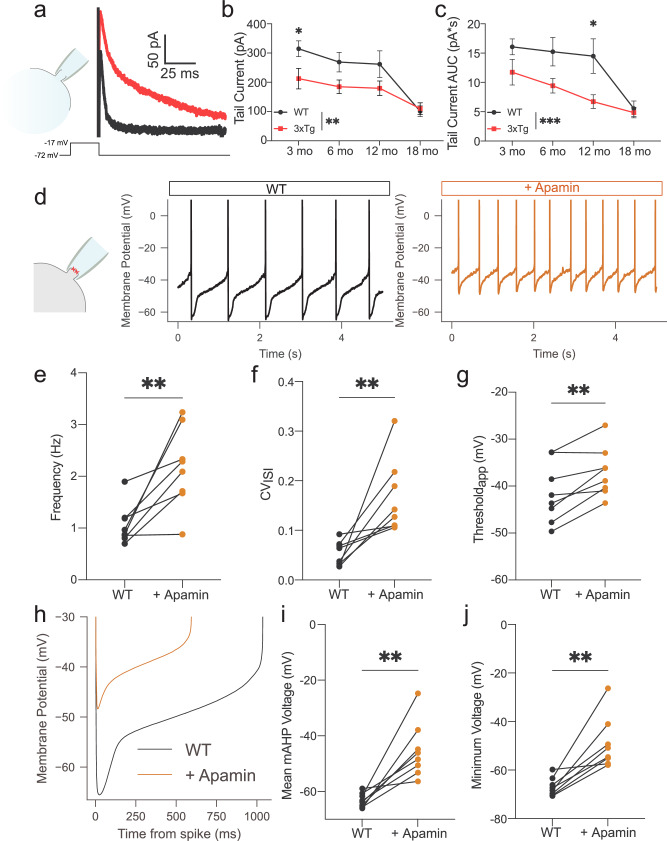
Alzheimer's disease (AD) patients exhibit neuropsychiatric symptoms that extend beyond classical cognitive deficits, suggesting involvement of subcortical areas. Here, we investigated the role of midbrain dopamine (DA) neurons in AD using the amyloid + tau-driven 3xTg-AD mouse model. We found deficits in reward-based operant learning in AD mice, suggesting possible VTA DA neuron dysregulation. Physiological assessment revealed hyperexcitability and disrupted firing in DA neurons caused by reduced activity of small-conductance calcium-activated potassium (SK) channels. RNA sequencing from contents of single patch-clamped DA neurons (Patch-seq) identified up-regulation of the SK channel modulator casein kinase 2 (CK2), which we corroborated by immunohistochemical protein analysis. Pharmacological inhibition of CK2 restored SK channel activity and normal firing patterns in 3xTg-AD mice. These findings identify a mechanism of ion channel dysregulation in VTA DA neurons that could contribute to behavioral abnormalities in AD, paving the way for novel treatment strategies.


Conflict of interest statement

The authors declare no competing interests.

Figures

Fig. 1
Fig. 1. Instrumental reward learning is age-dependently impaired in 3xTg mice.
a Schematic of procedure used for operant self-administration of palatable food pellets. b 3xTg mice acquired operant self-administration of palatable pellets more slowly than WT mice (main effect, P = 0.0106, F1,52 = 7.034) with the greatest effect between genotypes at 12-mo (two-tailed Sidak’s multiple comparison, P = 0.0003). c Raster plots showing correct side nose poke responding (vertical ticks along the x-axis) on day 1 of training for individual mice (by row) that eventually acquired self-administration. While there was considerable variation within the 3xTg groups, overall they showed less responding on day 1 compared to WT mice. dg Representative locomotor data from individual 3- and 12-mo WT and 3xTg mice during the first thirty minutes in the chamber, stratified by time (tornado plots) and heatmap localization (residency plots). h 3xTg mice locomote significantly more than WT mice over the 1-h session (two-way ANOVA, main effect of genotype, P = 0.0006, F1,38 = 13.84, n = 42 mice) which was most dramatic at 3 mo (P = 0.0018, two-tailed Sidak’s). i 3xTg mice spent significantly more time in the center of the chamber during the 1-h session than WT mice (two-way ANOVA, main effect of genotype, P = 0.0365, F = 1,38 = 4.699, same animals as in h). Residency plot scalebars represent log-transformed data rescaled between minimum and maximum values. Error bars represent standard error. Source data are provided as a Source Data file. Created in BioRender. Beckstead, M. (2023) BioRender.com/p21u763.
Fig. 2
Fig. 2. 3xTg DA neurons display increased firing rate with decreased regularity.
a Cell-attached recording and 10 s representative traces of spontaneous firing from 12 mo WT (black) and 3xTg (red) mice. b Mean spontaneous firing rate for WT and 3xTg DA neurons (cells/mice, WT: 3 mo 64/12, 6 mo: 64/14, 12 mo 76/17, 18 mo 43/7; 3xTg: 3 mo 75/6, 6 mo 73/8, 12 mo 88/22, 18 mo 35/6; two-way ANOVA Fgenotype = 9.236, P = 0.0025; Fage = 3.878, P = 0.0092; Finteraction = 5.943, P = 0.0005), with the largest rate increase at 12 mo (two-tailed Sidak’s, P < 0.0001). c Mean coefficient of variation of the ISI (CVISI) for the same cells (two-way ANOVA, Fgenotype = 19.64, P < 0.0001) were different between 3xTg and WT at 12 mo (two-tailed Sidak’s, P = 0.0214). d Whole-cell recording and representative traces of 100 pA, 1 s current injection in WT (black) and 3xTg (red) mice. e Averaged frequency/current (F/I) curves from 12 mo WT and 3xTg mice (two-way ANOVA, WT = 24 cells, 10 mice; 3xTg = 31 cells, 8 mice; Fgenotype = 54.56; P < 0.0001, Fcurrent injection = 18.48, P < 0.0001). f Hypersensitivity of 3xTg DA neurons measured as the F/I slope from 0 to 60 pA (cells/mice, WT: 3 mo 36/5, 6 mo 35/8, 12 mo 24/6, 18 mo: 34/7; 3xTg: 3 mo 35/3, 6 mo 17/5, 12 mo 32/7, 18 mo 17/3; Fgenotype = 13.71, P = 0.0003; Fage = 2.692, P = 0.0471), with a significant increase in sensitivity at 18 mo in 3xTg DA neurons (two-tailed Sidak’s, P = 0.0044). g Gramicidin perforated-patch recording and representative traces from WT (black) and 3xTg (red) mice. h 3xTg neurons showed increased firing frequency (WT 38/10, 3xTg 35/8; two-tailed Mann–Whitney, P < 0.0001, U = 240), and (i) increased CVISI (two-tailed Mann–Whitney, P = 0.0114, U = 437). j Depolarized apparent threshold in 3xTg DA neurons (two-tailed t-test, P = 0.0247, t = 2.295). k Grand averages of ISI voltage trajectories for WT and 3xTg cells. l Depolarized mean medium after-hyperpolarization voltage (mAHP, two-tailed Mann–Whitney, P < 0.0001, U = 168), and m. minimum ISI voltage (two-tailed Mann–Whitney, P < 0.0001, U = 168) in 3xTg DA neurons. Cells in (im) are the same as in (h). Error bars represent standard error. Raw data provided as a Source Data file.
Fig. 3
Fig. 3. SK channel inhibition in WT neurons recapitulates the 3xTg phenotype.
a Representative traces of the tail current in response to a 100 ms depolarization step to –17 mV from Vhold (–72 mV) in the whole-cell configuration. b Reduced tail current maximal amplitude (cells/mice, WT: 3 mo 66/7, 6 mo 25/7, 12 mo 20/6, 18 mo 37/6; 3xTg: 3 mo 42/3, 6 mo 40/8, 12 mo 42/7, 18 mo 28/6; two-way ANOVA Fgenotype = 8.743, P = 0.0034; Fage = 10.57, P < 0.0001) and (c) area under the curve (AUC, Fgenotype = 13.79, P = 0.0002, Fage = 10.03, P < 0.0001) in 3xTg DA neurons. d Perforated-patch recordings from spontaneously firing WT cells at baseline (black) and in the presence of apamin (1−3 nM; orange). e Increased firing frequency (n = 8 neurons, 6 mice; two-tailed Wilcoxon, P = 0.0078, W = 36.00) and f CVISI (two-tailed Wilcoxon, P = 0.0078, W = 36.00) in presence of apamin. g Depolarized apparent spike threshold in response to apamin (paired two-tailed t-test, P = 0.0050, t = 4.031). h ISI voltage trajectory averages. The effect of apamin is reminiscent of the trajectories from 3xTg neurons (panel 2k). i Depolarized mAHP (paired two-tailed t-test, P = 0.0022, t = 4.722) and (j) absolute minimum ISI voltages (paired two-tailed t-test, P = 0.0018, t = 4.853) in apamin. Error bars represent standard error. Source data are provided as a Source Data file.
Fig. 4
Fig. 4. NS309 efficacy is decreased in 3xTg DA neurons.
a Representative traces of WT DA neuron pacemaking in control aCSF (black) and in the presence of NS309 (1 µM) (blue). b Representative traces of 3xTg DA neurons in control aCSF (red) and in NS309 (gray). c Firing frequency was decreased by NS309 (two-way RM ANOVA, FNS309 = 15.27, P = 0.0058; Fgenotype = 5.872, P = 0.0459; FNS309 × genotype = 6.604, P = 0.0370) in WT (n = 8 neurons, 3 mice; two-tailed Sidak’s, P = 0.0007) but not significantly in 3xTg (n = 8 neurons, 4 mice; two-tailed Sidak’s, P = 0.0554) neurons. d NS309 did not affect CVISI. e Averaged ISI voltage trajectories in WT neurons before (black) and after NS309 (blue) and (f) in the 3xTg group before (red) and in the presence of NS309 (gray). g NS309 hyperpolarized mean medium after hyperpolarization voltages in WT (two-tailed Sidak’s, P < 0.0001), but not 3xTg (two-tailed Sidak’s, P = 0.7795) neurons (two-way RM ANOVA, FNS309 = 9.963, P = 0.0160, Fgenotype = 14.89, P = 0.0062, FNS309 × genotype = 43.200, P = 0.0003). h NS309 hyperpolarized minimum ISI voltages (two-way RM ANOVA, Fgenotype = 11.06, P = 0.0127; FNS309 × genotype = 11.94, P = 0.0106) in WT (P = 0.0037, two-tailed Sidak’s) but not 3xTg (P = 0.9988, two-tailed Sidak’s) neurons. Error bars represent standard error. Source data are provided as a Source Data file.
Fig. 5
Fig. 5. Patch-seq analysis indicates upregulated Csnk2a1 transcription.
a For Patch-seq, recording from an individual neuron was followed by cell extraction with the recording pipette. Cell contents were captured, and each individual cell RNA-Seq library was prepared and sequenced. b Individual cells were assessed for markers of DA neurons and potential contaminating cells. c t-SNE projection of each cell using all expressed genes demonstrates some genotype-dependent segregation. d Differentially expressed genes (DEGs) were determined by t-test with Benjamini Hochberg Multiple testing correction and a fold change filter of >|1.25|. e Plotting of differential expression fold change (FC) versus Pearson correlation to tail current amplitude indicated genes correlated and anticorrelated with tail current amplitude. Csnk2a1 (−0.03172 Pearson r) and the gene coding for casein kinase 2 dependent protein Nucks1 (−0.0687, Pearson r) were anticorrelated with tail current amplitude and upregulated in 3xTg DA neurons. f Gene ontology pathway analysis from DEGs indicates glycolysis and cytokine response as hits. g. Examples of individual DEGs, including Csnk2a1 (0.0443, Benjamini–Hochberg multiple testing correction), Slc25a14 (0.0475, Benjamini–Hochberg multiple testing correction), Nucks1 (0.0993, Benjamini-Hochberg multiple testing correction), and Nacc2 (0.0873, Benjamini–Hochberg multiple testing correction), *false discovery rate <0.1. Box and whisker plots define the inner quartile range and whiskers extend to minimum and maximum values, center line corresponds to median. Source data are provided as a Source Data file. Created in BioRender. Freeman, W. (2023) BioRender.com/k29t209.
Fig. 6
Fig. 6. CK2, p-CaM, and SK3 protein expression are increased in 3xTg VTA DA neurons.
a Workflow for cell segmentation analysis following immunohistochemistry. Confocal z-stack images were acquired, then the brightest slice of the channel of interest was chosen for analysis. DA neurons were segmented on TH staining from the same plane using the Cellpose ‘cyto v3’ model following upscaling (see Methods). Intensities within each segmented cell were calculated, quantified as average intensity across single cells, and plotted as cumulative probabilities. b Staining for CK2 indicated a slight rightward shift in the cumulative probability curve (c) of casein kinase 2 (CK2) intensity in tyrosine hydroxylase (TH) positive cells from 3xTg mice (Kolmogorov–Smirnov test, D = 0.1183, p < 0.0001, n = 2353 WT and 2187 3xTg cells, 6 mice). d Staining for phosphorylated calmodulin (p-CaM) indicated a moderate rightward shift in the cumulative probability curve (e Kolmogorov–Smirnov test, D = 0.1202, p < 0.0001, n = 2612 WT and 2193 3xTg neurons, 6 mice). f SK channel upregulation in 3xTg mice was indicated by a strong rightward shift in the cumulative probability of small conductance calcium-activated potassium channel 3 (SK3) intensity in single cells (g Kolmogorov–Smirnov test, D = 0.2284, p < 0.0001, n = 2914 WT and 3165 3xTg neurons, 6 mice). Red scale bars = 200 µm. Source data are provided as a Source Data file.
Fig. 7
Fig. 7. Casein kinase 2 inhibition restores firing properties in 3xTg DA neurons.
a Representative firing trace from a naïve WT neuron (black) and one pre-incubated with SGC (1 µM, purple). b Representative trace from a naive 3xTg neuron (red) and one pre-incubated with SGC (gray). c SGC decreased firing frequency in 3xTg (n = 35 neurons, 8 naïve mice and n = 16 neurons, 3 SGC treated mice; two-tailed Sidak’s, P < 0.0001) but not WT (n = 38 neurons, 10 naive mice and n = 16 neurons, 3 SGC treated mice; two-tailed Sidak’s, P = 0.1140) neurons; Fgenotype = 5.988, P = 0.0161; FSGC = 3.514, P = 0.0637; Fgenotype × SGC = 18.93, P < 0.0001). d SGC decreased CVISI in 3xTg (two-tailed Sidak’s, P = 0.0002, same mice as in c) but not WT (two-tailed Sidak’s, P = 0.9796) DA neurons (FSGC = 9.502, P = 0.0026; Fgenotype × SGC = 8.034, P = 0.0055). e Averaged inter-spike interval (ISI) voltage trajectories of naive 3xTg neurons and ones pre-incubated with SGC. f SGC hyperpolarized the mAHP in 3xTg (P < 0.0001) but not WT (P = 0.3225) neurons (two-way ANOVA, Fgenotype = 6.349, P = 0.0133; FSGC = 36.74, P < 0.0001; Fgenotype x SGC = 17.22, P < 0.0001, same mice as in e). g Schematic of in vivo treatment paradigm. 3xTg mice received either vehicle or SGC (1 mg/kg, i.p.) twice a day for four days (pre-treatment), daily treatment for ten days, followed by cessation of treatment for up to seven days. Electrophysiology experiments took place either during the daily treatment phase or final no-drug phase (denoted with arrows) to test short-term and persistent effects of SGC treatment. h Averaged ISI voltage trajectories of vehicle-treated (burgundy) and SGC-treated (gray) 3xTg neurons. i Systemic SGC treatment decreased firing frequency (one-way ANOVA, F = 4.374, P = 0.0187) in 3xTg mice (n = 15 neurons, 2 vehicle mice) during the daily injection phase (n = 16 neurons, 2 mice; two-tailed Dunnett’s, P = 0.0134) and trended toward significance up to seven days following injections (n = 15 neurons, 2 mice; two-tailed Dunnett’s, P = 0.0634). j SGC treatment hyperpolarized the mean medium after hyperpolarization (one-way ANOVA, F = 14.53, P < 0.0001, same mice and cells as in i) during the daily injection phase (two-tailed Dunnett’s, P < 0.0001), an effect that persisted after injections were terminated (two-tailed Dunnett’s, P = 0.0002). Error bars represent standard error. Source data are provided as a Source Data file. Created in BioRender. Beckstead, M. (2023) BioRender.com/y52l770.
Fig. 8
Fig. 8. Proposed mechanism of hyperexcitability in 3xTg VTA DA neurons.
Normally, VTA DA neurons maintain a balance between CK2 and PP2A resulting in low basal phosphorylation of CaM. In 3xTg mice, hyperactive CK2 results in hyperphosphorylated CaM, effectively decreasing SK channel calcium binding affinity and channel opening. This results in increased firing rate and irregularity in 3xTg mice. Created in BioRender. Beckstead, M. (2023) BioRender.com/j31r759.

Update of

References

    1. Phan, S. V., Osae, S., Morgan, J. C., Inyang, M. & Fagan, S. C. Neuropsychiatric symptoms in dementia: considerations for pharmacotherapy in the USA. Drugs R. D.19, 93–115 (2019). - PMC - PubMed
    1. Nobili, A. et al. Dopamine neuronal loss contributes to memory and reward dysfunction in a model of Alzheimer’s disease. Nat. Commun.8, 14727 (2017). - PMC - PubMed
    1. La Barbera, L. et al. Upregulation of Ca(2+)-binding proteins contributes to VTA dopamine neuron survival in the early phases of Alzheimer’s disease in Tg2576 mice. Mol. Neurodegener.17, 76 (2022). - PMC - PubMed
    1. La Barbera, L. et al. Nilotinib restores memory function by preventing dopaminergic neuron degeneration in a mouse model of Alzheimer’s Disease. Prog. Neurobiol.202, 102031 (2021). - PubMed
    1. Gloria, Y., Ceyzeriat, K., Tsartsalis, S., Millet, P. & Tournier, B. B. Dopaminergic dysfunction in the 3xTg-AD mice model of Alzheimer’s disease. Sci. Rep.11, 19412 (2021). - PMC - PubMed

Publication types

MeSH terms

Substances

Associated data