. 2024 Nov 8;14(1):27190.
doi: 10.1038/s41598-024-72716-1.

Multi-strain modeling of influenza vaccine effectiveness in older adults and its dependence on antigenic distance

Affiliations

Multi-strain modeling of influenza vaccine effectiveness in older adults and its dependence on antigenic distance

Séverine Urdy et al. Sci Rep. .

Abstract

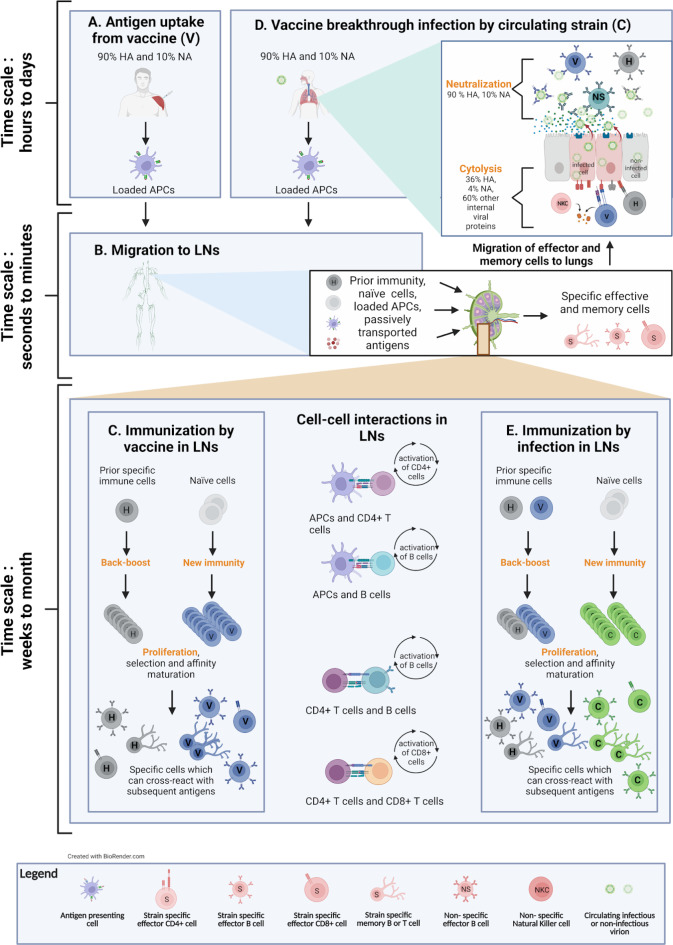
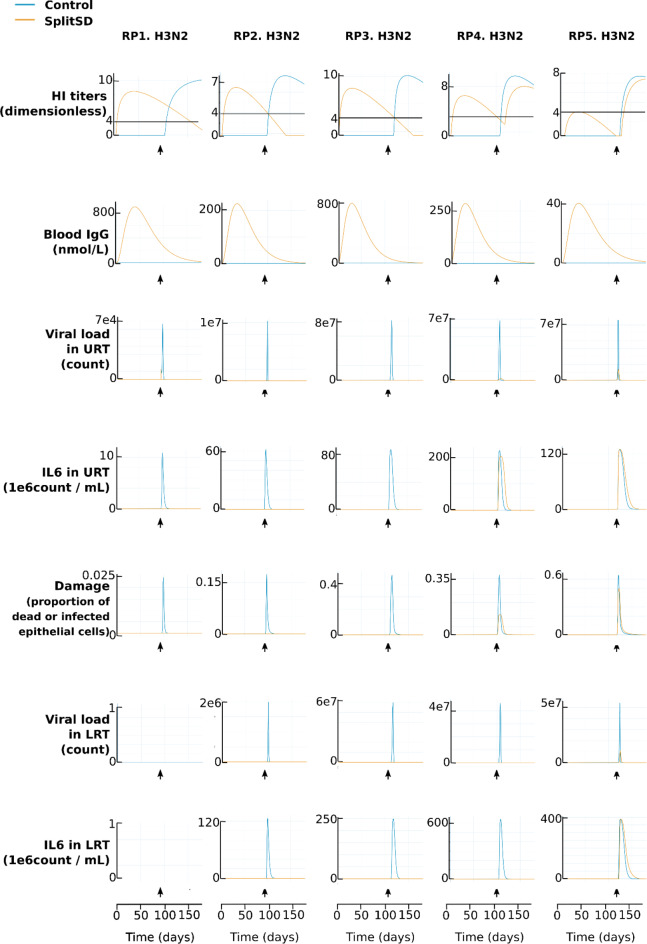
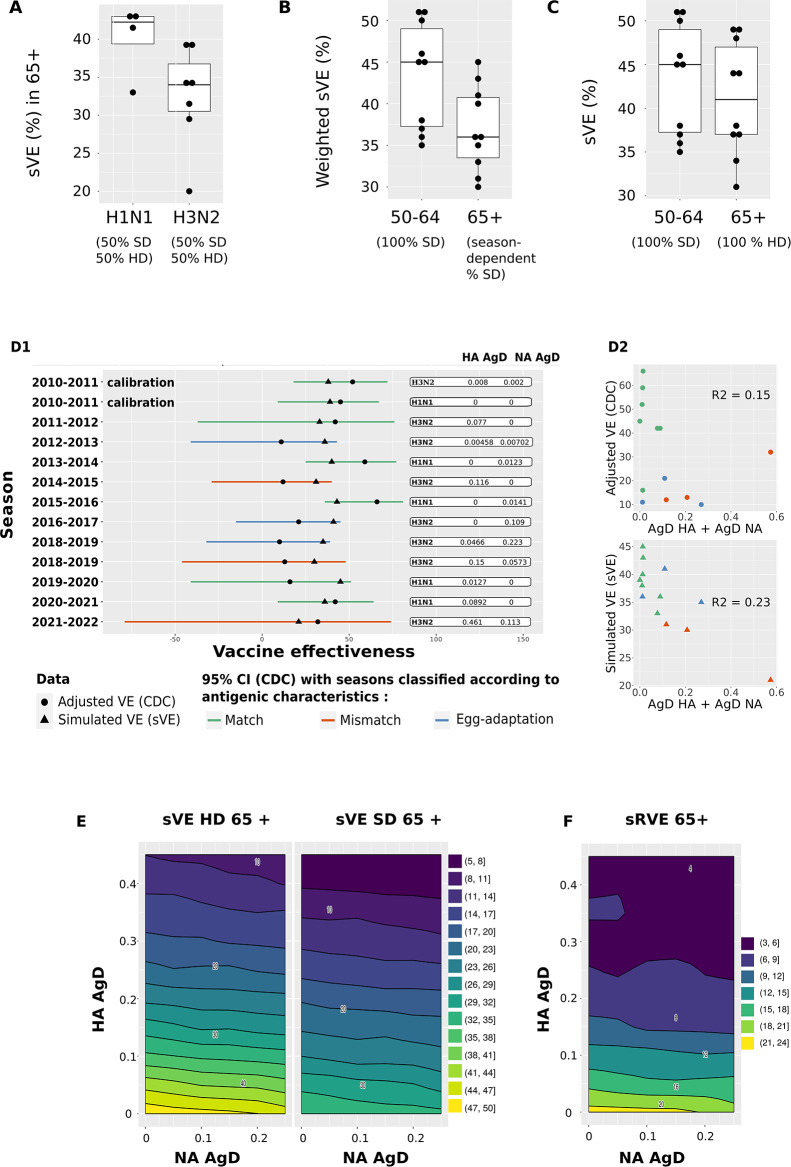
Influenza vaccine effectiveness (VE) varies seasonally due to host, virus and vaccine characteristics. To investigate how antigenic matching and dosage impact VE, we developed a mechanistic knowledge-based mathematical model. Immunization with a split vaccine is modeled for exposure to A/H1N1 or A/H3N2 virus strains. The model accounts for cross-reactivity of immune cells elicited during previous immunizations with new antigens. We simulated vaccine effectiveness (sVE) of high dose (HD) versus standard dose (SD) vaccines in the older population, from 2011 to 2022. We find that sVE is highly dependent on antigenic matching and that higher dosage improves immunogenicity, activation and memory formation of immune cells. In alignment with clinical observations, the HD vaccine performs better than the SD vaccine in all simulations, supporting the use of the HD vaccine in the older population. This model could be adapted to predict the impact of alternative virus strain selection on clinical outcomes in future influenza seasons.


Conflict of interest statement

S.U., M.H., A.I.T., N.R., E.J., E.P., J-B.G., J-P.B., E.C and L. B. are employees of Novadiscovery.S.S.C., L.C. and E.T. are employees of Sanofi and may hold shares and/or stock options in the company. Novadiscovery and Sanofi founded the study.

Figures

Fig. 1
Fig. 1
Overview of multi-strain model. (A) Vaccine antigen uptake by antigen-presenting cells (APCs). (B) Once loaded, APCs migrate from the injection site to the lymph nodes. Antigens (HA, NA) can also reach the lymph nodes by passive lymphatic drainage. (C) Immunization in the lymph nodes results in a back-boost of prior immunity (historical strains, H) as well as the formation of new immunity specific to the vaccine strain (V). In the lymph nodes, several cell-cell interactions amplify the proliferation of specific immune cells, notably, the interaction between APCs and naïve B and CD4 + cells. Activated CD4 + cells also interact with B and CD8 + cells which differentiate into effector cells, with neutralizing and cytolytic functions respectively. (D) Upon exposure to a seasonal circulating strain (C), specific immune cells migrate from the lymph nodes to the lungs. The different populations of immune cells interact with the new antigen C according to a cross-reactivity curve relating binding avidity constants to AgD between the new antigens and the old ones that elicited each strain-specific population. The rates of neutralization of specific antibodies elicited against H and V respectively depend on the AgD in HA and NA between H and C and V and C, weighted by the relative abundance of HA (90%) and NA (10%). 60% of pre-existing CD8 + cells have a rate of cytolysis which is independent of the AgD in HA and NA between previously encountered antigens (H, V) and C. If the specific immunity raised against H and V strains is sufficient to suppress the replication of the circulating strain or to control it without symptoms, the infection is respectively considered prevented or sub-clinical. (E) In case of viral replication and appearance of symptoms corresponding to a vaccine breakthrough infection, there is an immunization against strain C, with a back-boost of the specific immunity against V and H. In case of severe infection lasting more than a few weeks, this new immunity against strain C can help resolve the infection.
Fig. 2
Fig. 2
Calibration of reference patients. Time-courses of 7 main variables (rows) in 5 reference patients (RP) (columns) in control arm (blue) and split vaccine arm (orange, vaccination at day 1) with exposure to H3N2 at the indicated time points (arrows, between 80 and 120 days after vaccination) in both clinical arms over 180 days. All patients are aged between 70 and 80. First row: log2 HI titers raised against the vaccine strain. Second row: concentration of IgG specific to the vaccine strain in blood in nanomol/L. Third row: total viral load in the URT in mRNA/mL. Fourth row: concentration of pro-inflammatory cytokines (IL6) in the URT in nanomol/mL. Fifth row: instantaneous damage expressed as the fraction of infected lung epithelial cells compared to healthy lungs. Sixth row: total viral load in the LRT in mRNA/mL. Seventh row: concentration of pro-inflammatory cytokines (IL6) in the LRT in nanomol/mL. RP1: control asymptomatic infection and no vaccine breakthrough infection. RP2: control mild symptomatic infection and no vaccine breakthrough infection. RP3: control severe symptomatic infection and no vaccine breakthrough infection. RP4: control severe symptomatic infection and mild symptomatic vaccine breakthrough infection. RP5: control mild symptomatic infection and mild symptomatic vaccine breakthrough infection. All patients except RP5 reach seroprotective levels less than one month after vaccination (comparison of orange curve and black line in first row corresponding to log2 HI titers equals to 4). Vaccine breakthrough infections are identified as rebound of the HI titers after exposure in the vaccine arm (orange curve in RP4-5).
Fig. 3
Fig. 3
Model results. (A) Comparison of sVE in 65 + in seasons dominated by A/H1N1 (4 seasons) and A/H3N2 (7 seasons) using pooled vaccine arms. Most seasons dominated by A/H3N2 exhibit a lower sVE than in A/H1N1 dominated seasons. (B) Comparison of wsVE in younger and older age classes. 100% of patients aged 50–64 yo are vaccinated with splitSD as splitHD is not recommended in patients younger than 65 yo while the percentage of splitSD vaccinees relative to splitHD vaccinees in 65 + varies across seasons (Table 4). In those realistic conditions, the sVE in the 65 + is almost 10% lower than in the younger adults. (C) Comparison of sVE in younger and older age classes if 100% of 65 + received the HD vaccine. The effect of immunosenescence would be almost canceled with respect to the younger adults receiving exclusively the SD vaccine. D1. Timeline of wsVE against symptomatic infection (triangles) plotted over adjusted VE from CDC (dots) in 65 + between 2011 and 2022. The confidence intervals of adjusted VE are colored according to the antigenic characterization of main circulating seasonal strains with regards to the seasonal vaccine strains reported by the CDC as matched (green), mismatched (orange) and egg-adapted (blue) seasons. D2. Adjusted VE (top) and simulated VE (bottom) vs. the sum and HA and NA antigenic distance with regards to the seasonal vaccine strains reported by the CDC as matched (green), mismatched (orange) and egg-adapted (blue) seasons. E. Heatmaps of predicted sVE against symptomatic infections as a function of AgD in HA and NA between the seasonal vaccine strain and the main seasonal vaccine strain, in 65+. The surface corresponds to theoretical seasons where combinations of AgD in HA and NA have been simulated to evenly sample the theoretical space of variation in antigenic distances observed over the last decade. The sVE of splitSD decreases with AgD in HA and NA, but the decrease is much faster with antigenic drift in HA than in NA. Although the sVE of splitHD is much higher than that of the splitSD, it decreases faster with antigenic drift, in particular in HA. F. Heatmaps of predicted sRVE against symptomatic infections as a function of AgD in HA. The effectiveness of splitHD relative to splitSD (sRVE) decreases strongly with antigenic drift in HA and marginally in NA, but is nevertheless consistently different from 0, even at very large (and exceptional) combinations of AgD in HA and NA. All figures are generated with R version 4.3.2 (2023-10-31) - https://www.r-project.org/.
Fig. 4
Fig. 4
Predicted improvements with increased vaccine dose. A-E. Contribution analysis comparing, for each virtual patient, the difference between HD and SD arms, in seroprotection duration and vaccine-specific immunity at 28 days post-vaccination in 65+. A positive correlation between a marker of response to vaccination (i.e. dose-induced difference in seroprotection duration) is signified by low (blue) to high (orange) values from left to right, while a negative correlation goes from high to low values. Values are expressed in % change of the subpopulation’s median compared to the whole population’s median. For instance, in A, the subpopulation with the 50% highest values for the priming rate of B cells by APCs (“high” subpopulation) has a median for seroprotection duration 50% lower than the median of the overall population. For humoral immunity (A-C), the most sensitive parameters are related to the priming rate of B cells by APCs and to their antibody production and decay rates. While increasing the production rate of antibodies increases the differences between doses, increasing B cell priming and memory B cell decay rates decrease these differences. Increasing age (and thus immunosenescence) also decreases the difference between doses. Decreasing the time of exposure to viral antigens increases the differences between doses, due to back-boost of immunity against the vaccine strain, contributing to decreasing the difference between doses. For cellular immunity (D-E), the most sensitive parameters are related to the production rate of T cells which increases the difference between doses, while age decreases this difference. F-K. Quantified vaccine-specific markers tend to increase with vaccine dose, except central memory CD8 cells which show no change with vaccine dose. Distribution of vaccine-specific immunity in SD (blue) and HD (orange) arms in arbitrary units (a.u.), 28 days after vaccination. F. Seroprotection duration quantified as the number of days elapsed since vaccination where the HI titers remain superior to 1:40. G. APCs in lymph nodes. H. Antibodies specific to the vaccine strain in blood. I. Memory B cells in blood. J. Central memory CD4 cells in lymph nodes. K. Central memory CD8 cells in lymph nodes.

References

    1. Macias, A. E. et al. The disease burden of influenza beyond respiratory illness. Vaccine. 39, A6–A14 (2021). - PMC - PubMed
    1. Centers for disease control and prevention. Disease burden of flu. (2022). https://www.cdc.gov/flu/about/burden/index.html. Accessed: 5th of May 2023.
    1. Smith, D. J. et al. Mapping the antigenic and genetic evolution of influenza virus. Science. 305, 371–376 (2004). - PubMed
    1. Fonville, J. M. et al. Antibody landscapes after influenza virus infection or vaccination. Science. 346(6212), 996–1000 (2014). - PMC - PubMed
    1. Krammer, F. The human antibody response to influenza a virus infection and vaccination. Nat. Rev. Immunol.19(6), 383–397 (2019). - PubMed

LinkOut - more resources