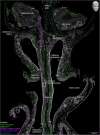
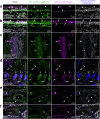
. 2024 Nov 8;7(1):1467.
doi: 10.1038/s42003-024-07017-4.

Visualizing the human olfactory projection and ancillary structures in a 3D reconstruction

Affiliations

Visualizing the human olfactory projection and ancillary structures in a 3D reconstruction

Victoria F Low et al. Commun Biol. .

Abstract

Visualizing in 3D the histological microanatomy of the human olfactory projection from the olfactory mucosa in the nasal cavity to the olfactory bulbs in the cranial cavity necessitates a workflow for handling a great many sections. Here, we assembled a 3D reconstruction of a 7.45 cm3 en-bloc specimen extracted from an embalmed human cadaver. A series of 10 µm coronal sections was stained with quadruple fluorescence histology and scanned in four channels. A trained anatomist manually segmented six structures of interest in a subset of the sections to generate the ground truth. Six convolutional neural networks were then trained for automatic segmentation of these structures in 1234 sections. A high-performance computing solution was engineered to register the sections based on the fluorescence signal and segmented structures. The resulting 3D visualization offers several novel didactic opportunities of interactive exploration and virtual manipulation. By extrapolating manual counts of OSNs in a subset of sections to the calculated volume of the envelope of the entire olfactory epithelium, we computed a total of ~2.7 million OSNs in the specimen. Such empirically derived information helps assess the extent to which the organizational principles of the human olfactory projection may differ from those in mice.


Conflict of interest statement

The authors declare no competing interests.

Figures
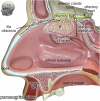
Fig. 1
Fig. 1. Photograph of an anatomical teaching model of a human head.
Parasagittal view of the lateral wall of the right nasal cavity from a SOMSO® anatomical teaching model showing the position of the olfactory bulb on the skull base and the projection of fila olfactoria through the cribriform plate (crib). ant, anterior; sup, superior.
Fig. 2
Fig. 2. The skull base of case A1147.
Superior view of the anterior cranial fossa showing the olfactory bulbs attached to the cribriform plate and the parts of the olfactory tracts that remained after the bulk of the brain had been removed. In a gray-scale duplicate image of the color photo, three fila olfactoria are indicated with white arrows and the black dashed box approximates where the incisions were made to extract the quadrangular en-bloc specimen. The left side of the images corresponds to the left side of the head. ant, anterior; lat, lateral.
Fig. 3
Fig. 3. Scanned image of a quadruple-stained coronal section.
A representative 10 µm coronal section (#1057) stained fluorescently for Hoechst (gray), Ulex europaeus agglutinin-1 (green), olfactory marker protein (magenta), and vesicular glutamate transporter 2 (blue). The image was taken on a PANNORAMIC MIDI II fluorescence digital slide scanner as an extended-focus three-level z-stack. The dimensions of the image are ~1.0 cm wide by ~1.5 cm long. The perpendicular plate of the ethmoid bone (septum) divides the left and right nasal cavities, and the upper part of the perpendicular plate (crista galli) separates the two olfactory bulbs. The nasal cavity is lined by nasal epithelium, the majority of which is respiratory epithelium. The dorsal-superior aspect of the nasal cavity harbors olfactory epithelium, as defined by the presence of OSNs. On the lateral aspect, the olfactory epithelium covers the superior turbinate, and on the septal aspect, it extends below the position equivalent to the curvature of the superior turbinate. Four thick white bars indicate the inferior boundaries of the olfactory epithelium on the superior turbinates and the septum. Within the lamina propria, axons of OSNs group into olfactory axon fascicles of progressively larger diameter that form macroscopically visible fila olfactoria, which traverse ipsilaterally the cribriform plate toward the ipsilateral olfactory bulb. The lamina propria also contains a dense network of arterial vasculature (two asterisks indicate accessory olfactory arteries). Rectangles (a–f) are displayed at higher magnification in Fig. 4a–f; the position of the letter informs the orientation of the high-magnification view. Small tissue folds in the nasal mucosa, mostly in the epithelium, appear as bright white stripe-like patches. The left side of the image corresponds to the right side of the head. lat, lateral; sup, superior.
Fig. 4
Fig. 4. Histology of the olfactory projection and ancillary structures.
High-magnification views of the rectangles (af) demarcated in Fig. 3. a The respiratory mucosa consists of respiratory epithelium and lamina propria separated by a basal lamina (dashed line). Dark spaces reflect goblet cells (arrowheads). The faint signal for OMP near the middle of the image is an artifact produced by a tissue fold. b The olfactory mucosa consists of olfactory epithelium and lamina propria separated by a basal lamina (dashed line). The olfactory epithelium contains immature OSNs (arrows) and mature, OMP-immunoreactive OSNs (arrowheads). c Olfactory axon fascicles, formed by OSN axons within the lamina propria, appear as longitudinal or oblique sectional views (arrows) or as a cross-sectional view (arrowhead). d Glomeruli (arrows) are innervated by axons of OSNs (double arrows). Most glomeruli reside within the glomerular layer (dashed vertical line). Some invasive glomeruli with an elongated appearance (arrowhead) reside deeper, within the external plexiform layer (solid vertical line). e Arterial vasculature is identified by an internal elastic lamina (arrowhead) and a surrounding layer of elongated nuclei of smooth muscle cells (I-beam line) that are parallel to the internal elastic lamina and surround a luminal space (asterisk). The diamond indicates a vein. f Bone (dotted line) is acellular, has a laminar appearance (arrowhead), and is not fluorescently stained.
Fig. 5
Fig. 5. Comparison of the ground truth and convolutional neuronal network segmentations.
The overlap (white) represents the agreement between the ground truth segmentation (magenta) and the CNN segmentation (cyan) in testing section #1401. The segmentations are overlayed on the corresponding tissue (gray). Cyan represents an overprediction (false-positive) and magenta an underprediction (false-negative) by the CNN segmentation. The six structures of interest are ordered in the decreasing number of sections used to train and validate the CNN. a Vasculature segmentation (DSC = 0.808, binary cross-entropy = 0.0148). b OSN segmentation (DSC = 0.760, binary cross-entropy = 0.0173). The inset shows a higher magnification of the overlap at the level of the olfactory epithelium: finer details, including OSN dendrites and axons, are not detected properly, resulting in an overprediction in the CNN segmentation (more cyan) in comparison to the ground truth (white and magenta). c Bone segmentation (DSC = 0.885, binary cross-entropy = 0.0121). An area of bone (white arrow) was not segmented in the ground truth due to human error but picked up by the CNN. d Glomerulus segmentation (DSC = 0.779, binary cross-entropy = 0.0017). A part of the left olfactory bulb is shown. e Olfactory bulb segmentation (DSC = 0.967, binary cross-entropy = 0.0044). An area of the olfactory tract was detected by the CNN (white arrowhead). f Nasal epithelium segmentation (DSC = 0.927, binary cross-entropy = 0.0053).
Fig. 6
Fig. 6. Still views of the 3D reconstruction.
The head models with positional indicators of anterior (ant), lateral (lat), and superior (sup) in the top right corners indicate the angle of the still views on the 3D construction. The corresponding time points in Supplementary Movie 1 are indicated next to the clapperboards, as minutes and seconds. Images were taken in ParaView. a Anterior-superior still view showing OSNs (white) and the nasal epithelium (orange). At the anterior face of the specimen, the nasal epithelium was physically cut. The apical side of the nasal epithelium is contoured by a white dotted line. The olfactory projection is supported by the ethmoid bone (gray), which includes the cribriform plate (crib) and the nasal septum (black-dashed line), and by a dense arterial vasculature (red). The proper olfactory artery (double arrowhead) and the accessory olfactory arteries (arrowheads) are indicated. The olfactory bulbs (yellow, with the contours indicated by a white dashed line) are partially obfuscated by bone. The olfactory tract (tract) extends posteriorly from the olfactory bulb. b Lateral still view revealing the arterial vasculature (red): the proper olfactory artery (double arrowhead), accessory olfactory artery (arrowhead), anterior ethmoidal artery (hollow arrowhead), posterior ethmoidal artery (feathered arrow), and the branches of the sphenopalatine artery (rectangular brackets). A network of smaller branches of the anterior and posterior ethmoidal arteries are observed along with the olfactory axon fascicles (double arrows). The crista galli (black dashed line) separates the olfactory bulbs. The area demarcated with a white dashed line and annotated with the letter c is the virtual coronal slice shown in (c). c The ~1 mm-thick virtual coronal slice viewed in a coronal plane reveals the microanatomical relationships between the nasal cavity and the olfactory bulbs. OSNs reside in the superior aspect of the nasal epithelium. d A high-magnification view of the dashed rectangle demarcated in (c). Axons of OSNs form within the lamina propria olfactory axon fascicles of progressively larger diameter. The fila olfactoria traverse ipsilaterally the cribriform plate (crib) toward the ipsilateral olfactory bulb. OSN axons terminate within glomeruli (magenta).
Fig. 7
Fig. 7. More still views of the 3D reconstruction.
The head models with positional indicators of anterior (ant), lateral (lat), and superior (sup) in the top right corners indicate the angle of the still views on the 3D construction. The corresponding time points in Supplementary Movie 1 are indicated next to the clapperboards, as minutes and seconds. Images were taken in ParaView. Slicing the 3D reconstruction virtually along a parasagittal plane through the left nasal cavity exposes the nasal epithelium (orange) lining the septal aspect (a) and the lateral aspect (b) of the left nasal cavity. The distribution of OSNs (white) is irregular and the borders of the area occupied by OSNs are serrated. At the anterior face of the specimen, the luminal surface of the nasal epithelium of the left and right nasal cavities (white dotted lines) was physically cut. The curvature of the superior turbinate (black dotted line; b) is visible in the posterior aspect above a hole in the specimen. The perpendicular plate of the ethmoid bone (septum, black dashed line; a) lies in a midsaggital plane. Fila olfactoria (arrows) traverse the cribriform plate (crib). The accessory olfactory artery (arrowhead) is partially visible. High-magnification views of the dashed rectangles in (b) show posterior fila olfactoria (c) and anterior fila olfactoria (d) (arrows) traversing the cribriform plate through foramina (white dashed lines) toward the olfactory bulb (yellow). Parasagittal still views of the septal aspect (e) and lateral aspect (f) of the left nasal cavity highlight the irregular topography of OSNs within the nasal epithelium. In the lateral aspect (f), OSNs do not extend below the curvature of the superior turbinate (black dotted line). High-magnification views of the dashed rectangles in (f) illustrate the difference in OSN density posteriorly (g, dense) compared to anteriorly (h, less dense).
Fig. 8
Fig. 8. Foramina in the cribriform plate.
Superior views. a The olfactory bulbs are separated anteriorly by the crista galli and posteriorly by the perpendicular plate of the ethmoid bone (black dashed line). Anteriorly, a few fila olfactoria (arrows) are visible. b A virtual dissection of the olfactory bulbs exposes multiple fila olfactoria traversing the cribriform plate and a network of arterial vasculature (red). c Isolating the cribriform plate (gray) exposes the foramina (white dashed lines). There are 17 foramina on either side of the specimen, for a total of 34 foramina.
Fig. 9
Fig. 9. Visualization of the 3D reconstruction in the Neuroglancer platform.
Neuroglancer is a WebGL-based, user-friendly viewer for 3D data. It hosts the scanned images and segmentation data of the complete dataset of 1234 sections of the olfactory en-bloc specimen extracted from case A1147. a The x, y, and z positions of the common origin of the colored axis lines in (e) are indicated at the left of the top menu bar. b The layers panel displays each of the fluorescence channels and CNN segmentations and controls the visibility of the channels and segmentations displayed in (e). c The help panel provides information on the keyboard shortcuts. d The settings panel enables the customization of the viewer. GPU and CPU memory usage can be adjusted. Helper tools such as axis lines and scalebar can be hidden from view. The background color can be changed. e The main visualization panel displays, by default, four views with the layers indicated along the top. The coronal slice (top left) displays the original orientation of the sections and segmentations. The axial slice (top right) and sagittal slice (bottom right) are generated by virtual reslicing of the 3D reconstruction. The complete 3D reconstruction (bottom left) can be rotated in 360°. Top right arrows indicate anterior (ant), lateral (lat), and superior (sup). Left-clicking the layers tabs toggles visibility and right-clicking activates the layer control (f) for that selection. Toggling the buttons in the upper right corner expands the view to a two-split or full-screen view. f The layer control panel allows for the manipulation of the displayed color, opacity, brightness, and contrast for each of the channels and segmentations. g QR code of the link to a compact (mobile-friendly) view of the model hosted on the Neuroglancer platform, without information (bd) and (f) displayed. The link to the full view is https://mip.datavisualiser.cloud.edu.au/neuroglancer/A1147/it13.
Fig. 10
Fig. 10. The envelope of the morphologically enclosed olfactory epithelium.
a 10 μm coronal section (#1160) stained fluorescently for Hoechst (gray), Ulex europaeus agglutinin-1 (green), olfactory marker protein (red), and vesicular glutamate transporter 2 (blue). The interrupted white line represents the regions of the nasal epithelium that contain OSNs. b Merge of Hoechst with the CNN segmentation of OSNs (cyan). c Merge of Hoechst with the envelope of the olfactory epithelium (yellow). d High-magnification view of the rectangle demarcated in (a). Merge of Ulex europaeus agglutinin-1 (green) and olfactory marker protein (red) illustrates how OSNs in the nasal epithelium can be identified and counted manually. The solid white line indicates what was measured by the trained anatomist to determine the length of nasal epithelium that contains OSNs. The dashed white line indicates the basal lamina. e High-magnification view of the rectangle demarcated in (b). Merge with the CNN segmentation of OSNs (cyan). White represents overlap between the ground truth and CNN segmentations of OSNs and cyan represents overprediction by the CNN segmentation. The dashed white line indicates the basal lamina. f High-magnification view of the rectangle demarcated in (c). Merge with the CNN segmentation of OSNs within the nasal epithelium, morphologically closed along the apical-basal dimension by erosion and dilation, reveals the envelope of the olfactory epithelium (yellow) that was used to calculate the volume of the entire olfactory epithelium. The semi-circular “bites” in the contours of the envelope reflect the morphological operation of erosion using a disk of a diameter of 80 µm as a structuring element.

Similar articles

Cited by

References

    1. Killingley, B. et al. Safety, tolerability and viral kinetics during SARS CoV-2 human challenge in young adults. Nat. Med.28, 1031–1041 (2022). - PubMed
    1. Boscolo-Rizzo, P. et al. Psychophysical assessment of olfactory and gustatory function in post-mild COVID-19 patients: a matched case-control study with 2-year follow-up. Int. Forum Allergy Rhinol.13, 1864–1875 (2023). - PubMed
    1. Doty, R. L., Deems, D. A. & Stellar, S. Olfactory dysfunction in parkinsonism: a general deficit unrelated to neurologic signs, disease stage, or disease duration. Neurology38, 1237–1244 (1988). - PubMed
    1. Haehner, A., Hummel, T. & Reichmann, H. Olfactory loss in Parkinson’s disease. Parkinsons Dis.2011, 450939 (2011). - PMC - PubMed
    1. Doty, R. L., Reyes, P. F. & Gregor, T. Presence of both odor identification and detection deficits in Alzheimer’s disease. Brain Res. Bull.18, 597–600 (1987). - PubMed

MeSH terms

LinkOut - more resources