Comparative Study
. 2024 Nov 8;14(1):27179.
doi: 10.1038/s41598-024-78102-1.

Comparative analysis of the postadmission and antemortem oropharyngeal and rectal swab microbiota of ICU patients

Affiliations
Comparative Study

Comparative analysis of the postadmission and antemortem oropharyngeal and rectal swab microbiota of ICU patients

Annamaria Petrilla et al. Sci Rep. .

Abstract

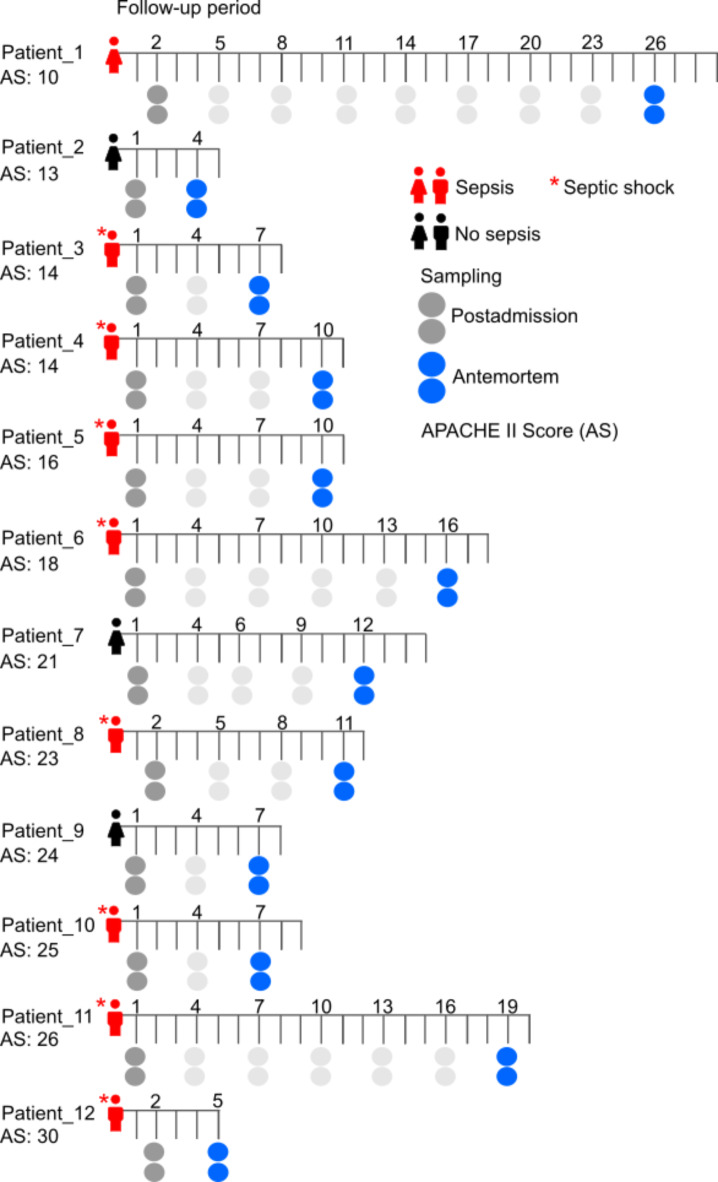
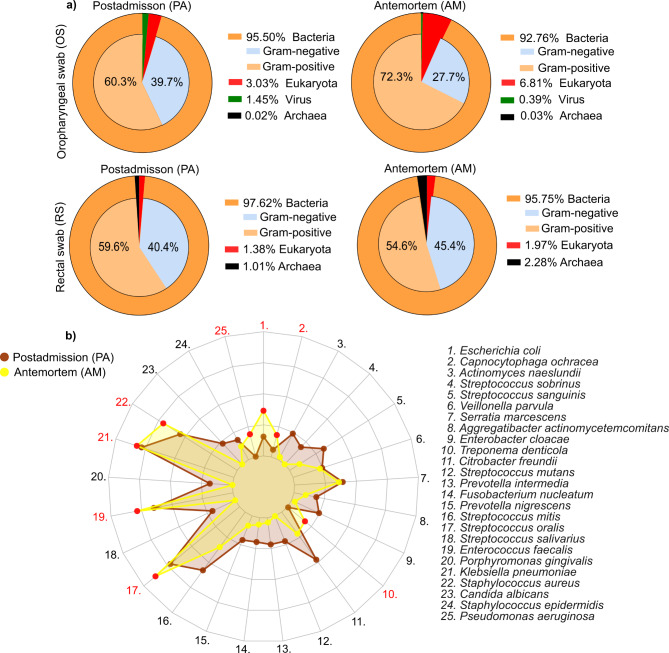
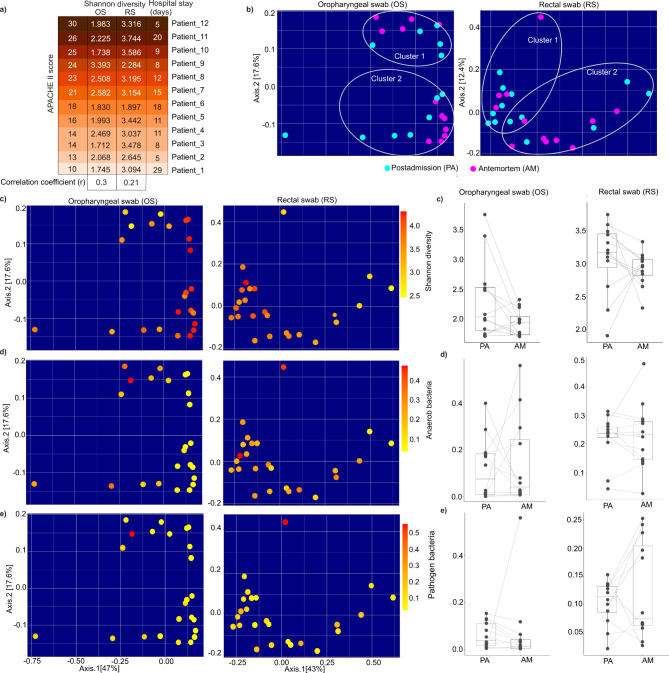
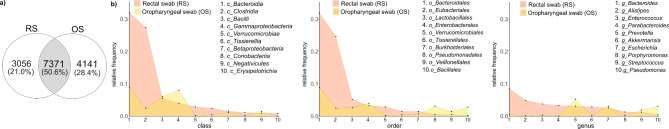
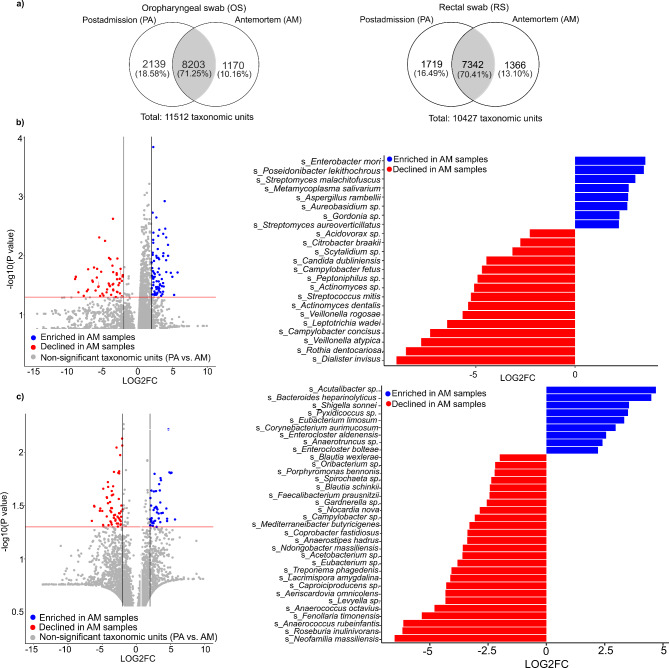
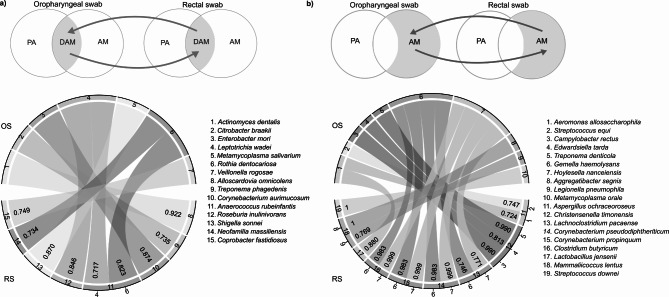
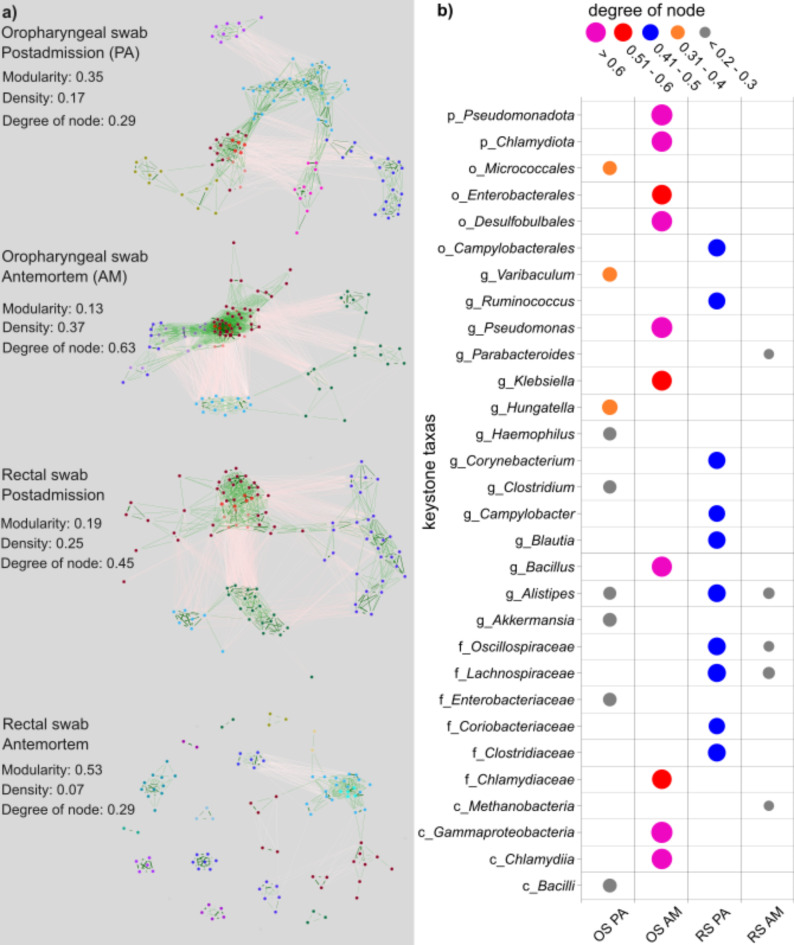
Shotgun metabarcoding was conducted to examine the microbiota in a total of 48 samples from 12 critically ill patients, analyzing samples from both the oropharynx and rectum. We aimed to compare their postadmission microbiota, characterized as moderately dysbiotic, with the severely dysbiotic antemortem microbiota associated with patients' deaths. We found that, compared with postadmission samples, patient antemortem swab samples presented moderate but not significantly decreased diversity indices. The antemortem oropharyngeal samples presented an increase in biofilm-forming bacteria, including Streptococcus oralis, methicillin-resistant Staphylococcus aureus (MRSA), and Enterococcus faecalis. Although the septic shock rate was 67%, no significant differences were detected in the potential pathogen ratios when the microbiota was analyzed. A notable strain-sharing rate between the oropharynx and intestine was noted. By comparing postadmission and antemortem samples, microbial biomarkers of severe dysbiosis were pinpointed through the analysis of differentially abundant and uniquely emerging species in both oropharyngeal and rectal swabs. Demonstrating strong interconnectivity along the oral-intestinal axis, these biomarkers could serve as indicators of the progression of dysbiosis. Furthermore, the microbial networks of the oropharyngeal microbiota in deceased patients presented the lowest modularity, suggesting a vulnerable community structure. Our data also highlight the critical importance of introducing treatments aimed at enhancing the resilience of the oral cavity microbiome, thereby contributing to better patient outcomes.


Conflict of interest statement

The authors declare no competing interests.

Figures

Fig. 1
Fig. 1
Overview of the study cohort. The figure illustrates the 12 patients included in the study, indicating their gender, APACHE II score, and a timeline that shows the number of days they stayed in the intensive care unit (ICU) until their death. Additionally, it highlights the intervals at which oropharyngeal and rectal swabs were simultaneously collected. A distinction is made between postadmission and antemortem samples to show how samples were taken throughout their ICU stay and closer to the time of death.
Fig. 2
Fig. 2
Comparative analysis of microbiota in oropharyngeal and rectal swabs of ICU patients. Temporal shifts in gram-negative and gram-positive bacteria, eukaryota, viruses, and Archaea in (a) the oropharyngeal and rectal swab samples shown in a pie chart. (b) The radar chart illustrates changes in the abundance of biofilm-forming bacterial species in antemortem samples relative to postadmission samples. Each axis represents a different biofilm-forming species, and the chart depicts fluctuations in bacterial abundances over time. Biofilm-forming species with an increased abundance in antemortem samples are indicated in red.
Fig. 3
Fig. 3
A remarkable reduction in microbial diversity was observed in the rectum, but not in the oropharynx, in antemortem samples compared with postadmission samples. (a) A table was made to demonstrate the patients’ APACHE II scores, diversity values, and the number of hospital stay in the postadmission oropharyngeal and rectal swab samples. PCoA plots were created to investigate potential clustering pattern similarities between oropharyngeal swab (OS) and rectal swab (RS) results when comparing (b) postadmission (PA) and antemortem (AM) sample populations, (c) Shannon diversity, (d) anaerobes and (e) potential pathogens. Points in PCoA plots were calculated based on quantitative Bray‒Curtis statistics and are colored according to a gradient scale of the (c) Shannon diversity indices, d) relative abundance of anaerobic bacteria, and (e) relative abundance of pathogenic bacteria. In every case, box plots were used to examine the significant differences between the sample fractions (PA vs. AM). Statistical significance was determined by the Wilcoxon matched-pairs signed rank test (n.s. nonsignificant).
Fig. 4
Fig. 4
Analysis of transmission patterns of bacterial taxonomic units in oropharyngeal and rectal swabs. (a) A Venn diagram was generated to measure the taxonomic units present in both oropharyngeal and rectal swab samples to identify the common microbial populations across the anatomical sites. (b) Area plots illustrating the proportions of the 10 most frequent coexisting bacteria in oropharyngeal and rectal swab samples, highlighting the overlap in these distinct anatomical locations across classes, orders and genera.
Fig. 5
Fig. 5
Differentially abundant microbes (DAMs) in 100% of the cores from oropharyngeal and rectal swabs. (a) Comparative analysis of shared and unique microbial populations between postadmission and antemortem swab samples from ICU patients was conducted via Venn diagrams for both oropharyngeal and rectal swabs. (b) and (c) Volcano analyses were performed to identify significant microbial shifts in ICU patients by comparing postadmission samples with antemortem samples among oropharyngeal and rectal swab samples, respectively. The volcano plot represents the DAMs showing statistically significant overexpression and underexpression (according to the log2-transformed fold change in relation to the -log10-transformed P value). The dashed line on the y-axis indicates the -log10P value = 1.301 threshold, with statistically significant (P < 0.05) higher (blue) and lower abundances (red). In each analysis, bar plots illustrate the differentially abundant microbes (DAMs) that were significantly enriched (blue) or depleted (red) in antemortem samples.
Fig. 6
Fig. 6
(a) Upper panel: Venn diagram showcasing intersected differentially abundant microbes (DAMs) consistently detectable in both post-admission and antemortem samples of moderately and severely dysbiotic microbiomes. Arrows point to DAMs present in both oropharyngeal (OS) and rectal swab (RS) samples, marking key overlaps across sampling sites. Bottom panel: Chord diagram illustrating species with strong positive correlations (Pearson correlation coefficient > 0.7) between oropharyngeal swab (7 species) and rectal swab (9 species) samples, highlighting interconnected microbes across these anatomical regions. This interconnectivity suggests potential microbial biosensors for severe dysbiosis across sample types. (b) Upper panel: Venn diagram highlighting unique interconnected microbial biomarkers exclusively identified in antemortem samples, with arrows denoting species strongly associated with severely dysbiotic states. Their distinct presence underscores their diagnostic potential for characterizing advanced dysbiosis stages. Bottom panel: Chord diagram demonstrating species with strong positive correlations (Pearson correlation coefficient > 0.7) between oropharyngeal swab (10 species) and rectal swab (9 species) samples, reflecting high interconnectivity across anatomical regions. These interconnected species suggest microbial biosensors that could indicate severe dysbiosis in both sample types.
Fig. 7
Fig. 7
Figure demonstrating the differences in microbial community structures and interactions between sample types and times (postadmission vs. antemortem). (a) Four network graphs are represented to illustrate the complex structures of microbial communities within different sample types and collection times: oropharyngeal swab postadmission (OS PA), oropharyngeal swab antemortem (OS AM), rectal swab postadmission (RS PA), and rectal swab antemortem (RS AM). Each graph details the network’s modularity, density, and degree of nodes. (b) Degree of node values for keystone microbial taxa. The legend on the right indicates the presence and abundance of taxonomic units with various colors, where larger nodes may indicate more dominant or abundant species. The circle sizes in the graph correlate with the degree of a node, with the smallest circles representing values under 0.3, increasing incrementally through ranges of 0.31–0.4, 0.41–0.5, 0.51–0.6, and exceeding 0.6. The diversity in node degree reflects the varying influence of different taxa within the microbial communities. The network correlations and degrees of nodes were determined via Pearson correlations.

Similar articles

Cited by

References

    1. Hou, K. et al. Microbiota in health and diseases. Signal. Transduct. Target. Ther.7, 135 (2022). - PMC - PubMed
    1. Willis, J. R. & Gabaldón, T. The human oral microbiome in health and disease: From sequences to ecosystems. Microorganisms8, 308 (2020). - PMC - PubMed
    1. Szychowiak, P., Villageois-Tran, K., Patrier, J., Timsit, J. F. & Ruppé, É. The role of the microbiota in the management of intensive care patients. Ann. Intensive Care12, 3 (2022). - PMC - PubMed
    1. Liu, W. et al. Classification of the gut microbiota of patients in intensive care units during development of sepsis and septic shock. Genom. Proteom. Bioinform.18, 696–707 (2020). - PMC - PubMed
    1. Dickson, R. P. The microbiome and critical illness. Lancet Respir. Med.4 (1), 59–72 (2016). - PMC - PubMed

Publication types

LinkOut - more resources