SPP1 is a plasma biomarker associated with the dia gnosis and prediction of prognosis in sepsis
- PMID: 39516332
- PMCID: PMC11549466
- DOI: 10.1038/s41598-024-78420-4
SPP1 is a plasma biomarker associated with the dia gnosis and prediction of prognosis in sepsis
Abstract
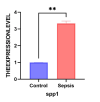
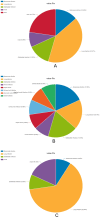
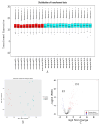
In this study, peripheral whole blood samples from 22 hospitalized patients and 10 healthy individuals were analyzed using a combination of Data Independent Acquisition (DIA) and Enzyme-Linked Immunosorbent Assay (ELISA) techniques to identify differentially expressed proteins (DEPs) in sepsis patients' plasma. The aim was to provide accurate and detailed biomarkers, such as SPP1, for determining the pathological stages of sepsis. SPP1, known as osteopontin1 is a pleiotropic protein with a wide distribution and multifunctional effects. Its protein expression is associated with inflammatory changes, including variations in expression levels in infectious diseases, allergic diseases, and situations involving tissue damage. The registration number was ChiCTR1900021261.The full date of first registration year is 2018. In the affiliated hospital of southwest medical university, 22 sepsis patients were hospitalized from January 2019 to September 2020 and 10 normal healthy individuals were selected for DIA-based quantitative proteomics analysis. In addition to gene ontology analysis and Kyoto Encyclopedia of genes and genomes analysis, enrichment analysis of data was performed and target protein network was screened through joint protein-protein interaction and visualization techniques. The selected protein targets were then validated by Elisa kit. The software was used to analyze the differences comparing the control group to the sepsis group and the sepsis group, as well as between sepsis survivals and non-survivals, and a ROC curve was drawn to evaluate the diagnostic value and prognostic effect of the method of the corresponding target proteins. A total of 174 DEPs were screened by bioinformatics analysis. An analysis of go pathway enrichment revealed the following: These proteins were mainly involved in biological processes among them are the inflammation response, the metabolism of extracellular matrix, the secretion of cell secretions, the activation of cells, and the immune response. According to the Kegg pathway analysis, they were mainly involved in complement cascade polymerization, extracellular protease and glycosylase activation, protein synthesis process, biotin metabolism, leukocyte transmembrane migration, bacterial infection and phagosome formation. SPP1 was identified as a possible plasma biomarker and was therefore further validated using Elisa. As a result of experiments, it has been demonstrated that level in sepsis patients is significantly compared to the normal control group and the level is also higher in non-survivals of sepsis. The ROC curve can be used to see that it can diagnose sepsis more accurately and improve prognostic ability prediction. Cell experiments confirm that SPP1 is highly expressed in sepsis. There is a significant difference in the levels of SPP1 protein between the normal group and the sepsis group; it not only has good diagnostic significance for sepsis, but also provides corresponding reference value for patient prognosis; Therefore, it is more likely to become a biological marker of sepsis over time.
Keywords: DIA; ELISA; SPP1; Sepsis.
© 2024. The Author(s).
Conflict of interest statement
The authors declare no competing interests.
Figures


Similar articles
-
S100P is a core gene for diagnosing and predicting the prognosis of sepsis.Sci Rep. 2025 Feb 25;15(1):6718. doi: 10.1038/s41598-025-90858-8. Sci Rep. 2025. PMID: 40000745 Free PMC article.
-
LGALS3BP: A Potential Plasma Biomarker Associated with Diagnosis and Prognosis in Patients with Sepsis.Infect Drug Resist. 2021 Jul 24;14:2863-2871. doi: 10.2147/IDR.S316402. eCollection 2021. Infect Drug Resist. 2021. PMID: 34335032 Free PMC article.
-
Resistin as a potential diagnostic biomarker for sepsis: insights from DIA and ELISA analyses.Clin Proteomics. 2024 Jul 1;21(1):46. doi: 10.1186/s12014-024-09498-1. Clin Proteomics. 2024. PMID: 38951753 Free PMC article.
-
[The role of transferrin receptor CD71 as a diagnostic and prognostic biomarker in sepsis].Zhonghua Wei Zhong Bing Ji Jiu Yi Xue. 2022 Feb;34(2):121-126. doi: 10.3760/cma.j.cn121430-20210617-00907. Zhonghua Wei Zhong Bing Ji Jiu Yi Xue. 2022. PMID: 35387715 Chinese.
-
Novel Biomarkers for Screening Retinal Detachment Associated with Choroidal Detachment Using DIA-MS-Based Proteomics.Curr Eye Res. 2025 Jun;50(6):641-650. doi: 10.1080/02713683.2025.2469228. Epub 2025 Feb 26. Curr Eye Res. 2025. PMID: 40012137
Cited by
-
[A clinical investigation of constructing a diagnostic model for sepsis-induced coagulopathy utilizing data-independent acquisition proteomics].Zhonghua Xue Ye Xue Za Zhi. 2025 Jan 14;46(1):45-52. doi: 10.3760/cma.j.cn121090-20241219-00579. Zhonghua Xue Ye Xue Za Zhi. 2025. PMID: 40059681 Free PMC article. Chinese.
References
-
- Cecconi, M. et al. Sepsis and septic shock. Lancet392(10141), 75–87. 10.1016/S0140-6736(18)30696-2 (2018). - PubMed
-
- Gomanova, L. & Brazhnikov, A. Sepsis in the XXI century: Etiology risk factors, epidemiological features, complications, prevention. Epidemiol. Vakcinoprofil.20(3), 107–117. 10.31631/2073-3046-2021-20-3-107-117 (2021).
-
- Fleischmann, C. et al. Assessment of global incidence and mortality of hospital-treated sepsis. Current estimates and limitations. Am. J. Resp. Crit. Care.193(3), 259–272. 10.1164/rccm.201504-0781OC (2016). - PubMed
MeSH terms
Substances
LinkOut - more resources
Full Text Sources
Medical
Research Materials
Miscellaneous

