. 2024 Nov 8;15(11):807.
doi: 10.1038/s41419-024-07130-6.

TAp73 regulates mitochondrial dynamics and multiciliated cell homeostasis through an OPA1 axis

Affiliations

TAp73 regulates mitochondrial dynamics and multiciliated cell homeostasis through an OPA1 axis

Niall A Buckley et al. Cell Death Dis. .

Abstract

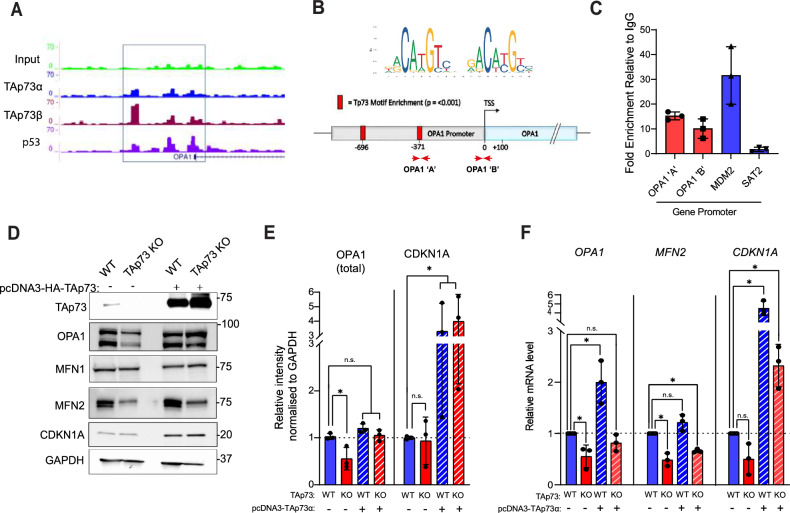
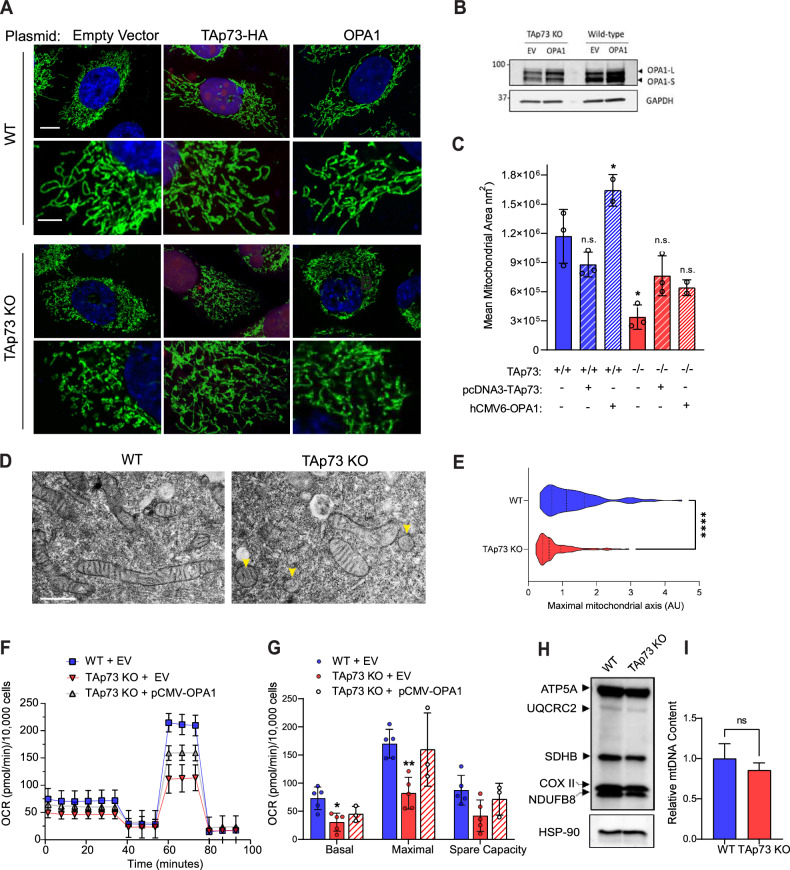
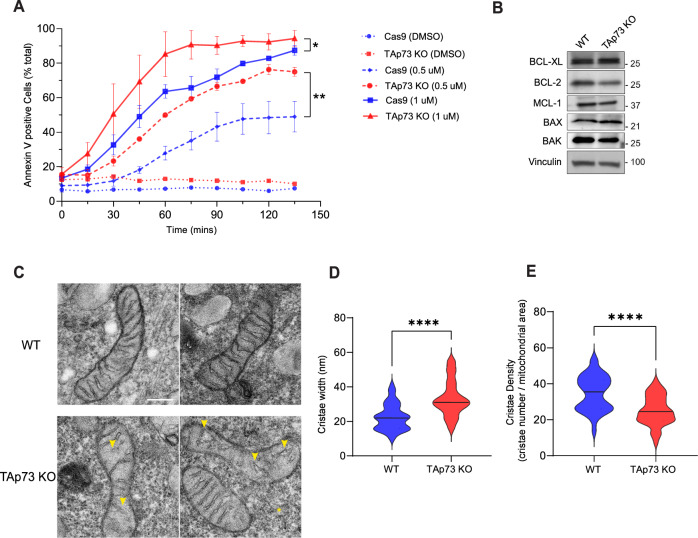
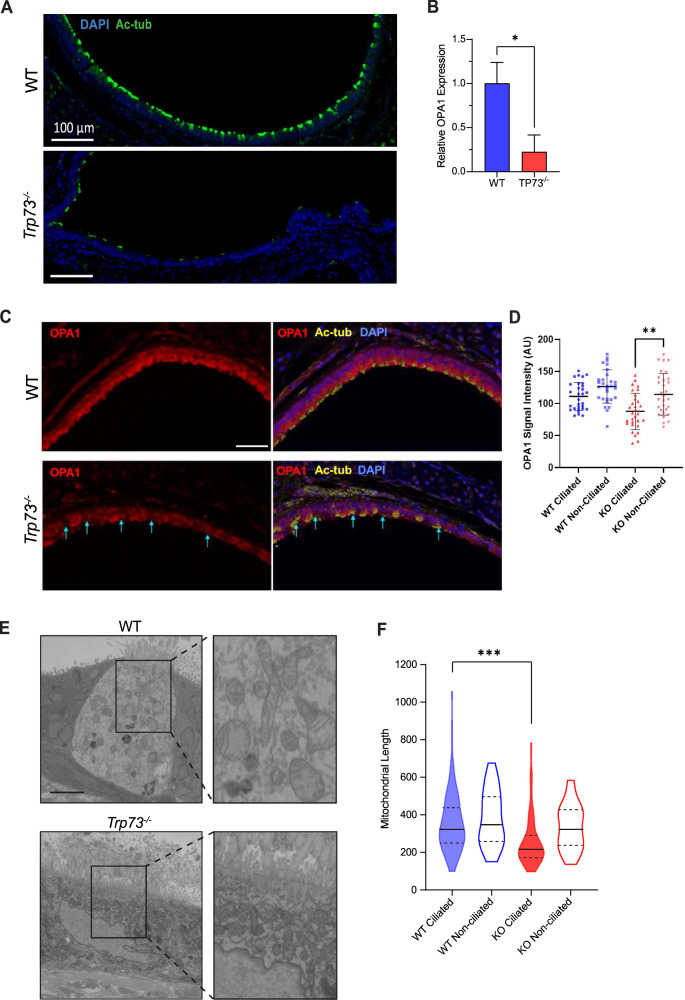
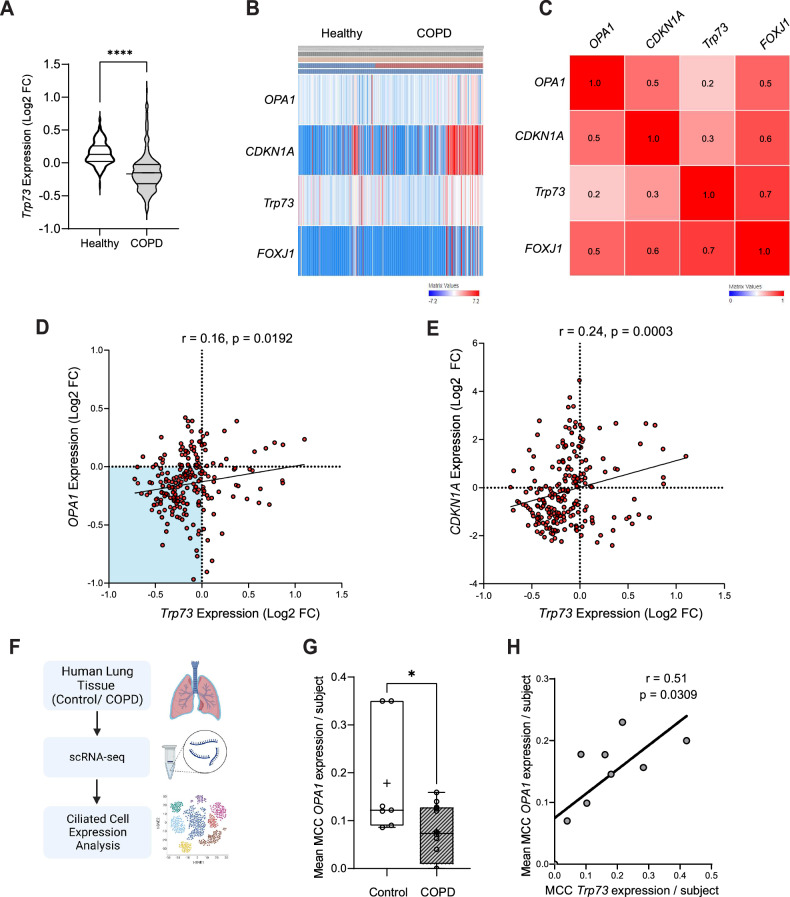
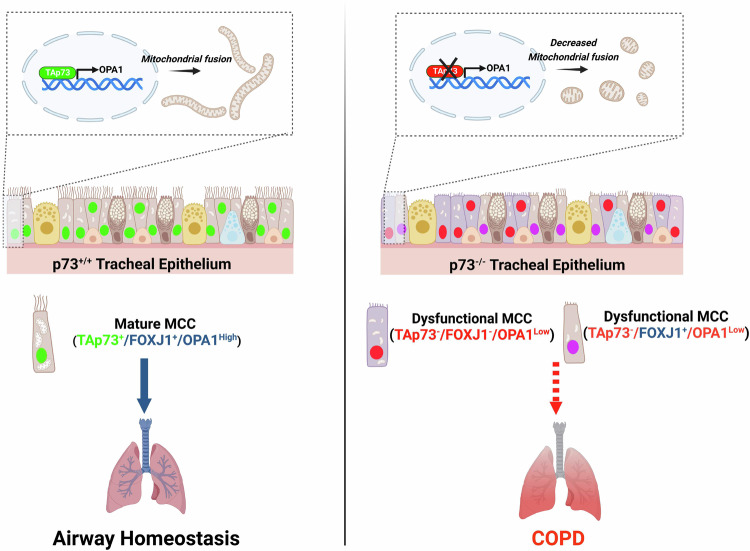
Dysregulated mitochondrial fusion and fission has been implicated in the pathogenesis of numerous diseases. We have identified a novel function of the p53 family protein TAp73 in regulating mitochondrial dynamics. TAp73 regulates the expression of Optic Atrophy 1 (OPA1), a protein responsible for controlling mitochondrial fusion, cristae biogenesis and electron transport chain function. Disruption of this axis results in a fragmented mitochondrial network and an impaired capacity for energy production via oxidative phosphorylation. Owing to the role of OPA1 in modulating cytochrome c release, TAp73-/- cells display an increased sensitivity to apoptotic cell death, e.g., via BH3-mimetics. We additionally show that the TAp73/OPA1 axis has functional relevance in the upper airway, where TAp73 expression is essential for multiciliated cell differentiation and function. Consistently, ciliated epithelial cells of Trp73-/- (global p73 knock-out) mice display decreased expression of OPA1 and perturbations of the mitochondrial network, which may drive multiciliated cell loss. In support of this, Trp73 and OPA1 gene expression is decreased in chronic obstructive pulmonary disease (COPD) patients, a disease characterised by alterations in mitochondrial dynamics. We therefore highlight a potential mechanism involving the loss of p73 in COPD pathogenesis. Our findings also add to the growing body of evidence for growth-promoting roles of TAp73 isoforms.


Conflict of interest statement

GM is a member of the Editorial Board of Cell Death & Disease. IA is Editor-in-Chief of Cell Death Discovery. The other authors declare no conflicts of interest.

Figures

Fig. 1
Fig. 1. TAp73 regulates the expression of OPA1.
A Interrogation of ChIP-seq data indicated binding of TAp73α, TAp73β and p53 to the putative OPA1 promoter region. Sequencing read files were obtained from the GEO data set GSE15780, and tracks shown are for the indicated transcription factors at selected genes. B, C Targeted ChIP of TAp73 bound chromatin. RT-qPCR primers were designed in the promoter region of the OPA1 gene (OPA1 ‘A’ and OPA1 ‘B’). Red squares indicate regions enriched for the Trp73 motif (p < 0.001). qPCR was performed to quantify the fold enrichment of the OPA1 promoter region in an IP sample relative to IgG control. Enrichment of MDM2 and SAT2 promoter regions were assayed as positive and negative controls, respectively. qPCR was carried out on 3 independent ChIP experiments and data shown as individual data points ± SD (n = 3). D Representative western blot of mitochondrial fusion proteins in TAp73 KO and WT control. Cells were transfected with either EV or TAp73α expression construct for 24 h. E Densitometry analysis of western blot data shown in (D). Band intensity was calculated for total OPA1 (long and short isoforms) and CDKN1A (positive control). Signal intensity was normalised to loading control and reported relative to WT cells transfected with empty vector (n = 3). *P ≤ 0.05, (n.s.) not significant (Student’s t-test, comparison of indicated condition with WT empty vector control). F RT-qPCR was performed against OPA1, MFN2 and CDKN1A genes and expression values calculated using the ∆∆Ct method, relative to WT empty vector control. Data shown as mean ± SD (n = 3). *P ≤ 0.05, (n.s) not significant (Student’s t-test, comparison of indicated condition with WT empty vector control).
Fig. 2
Fig. 2. TAp73 KO cells display fragmented mitochondria and impaired ETC function.
A WT or TAp73 KO H1299 cells were transfected with the indicated plasmids for 24 h and IF carried out against ATP5B (green) with DAPI nuclear counterstain (blue). Cells transfected with HA-TAp73α expression plasmid were stained for HA as a transfection control (red). Lower magnification images, scale bar = 10 μm; Callout images, scale bar = 4 μm. B Representative western blot of OPA1 expression following transfection of WT and TAp73 KO cells with pCMW-OPA1 construct. C Quantification of mitochondrial morphology from (A) using Zeiss Intellesis module, trained to segment individual mitochondria. Statistical significance for each condition was calculated using Student’s t-test, comparing with WT EV control (column 1); *p < 0.05, (ns) not significant (n = 3). D Transmission electron micrographs of mitochondrial morphology from WT and TAp73 KO cells. Scale bar = 100 nm. E Mitochondrial length measurements obtained from (D). ****p < 0.0001 in Student’s t-test. A minimum of 100 mitochondria were measured from n = 3 independent biological replicates. F, G Mitochondrial stress test performed on Seahorse XFe96 analyser. Canonical mitochondrial inhibitors injected sequentially as labelled (Oligomycin = 2 μM, FCCP = 500 nM, Antimycin A/ Rotenone = 2 μM). The indicated mitochondrial stress test parameters were calculated from OCR data. Data were corrected for non-mitochondrial OCR, normalised to cell number, and are shown as mean ± SD (n = 3). *P ≤ 0.05 and **P ≤ 0.01 in Student’s t-test relative to WT control. H Western blot of the indicated ETC subunits in wild-type and TAp73 KO cells, obtained using OXPHOS antibody cocktail. I qPCR against mt-CO2, expressed relative to expression of nuclear encoded β2-microglobulin. Relative expression was calculated using the ΔΔCt method and expressed as a percentage of wild-type control (n = 2 biological replicates, each tested in triplicate). n.s not significant in Student’s t-test.
Fig. 3
Fig. 3. TAp73 KO cells are sensitised to apoptosis induced by BH3-mimetics.
A Kinetics of apoptosis induction was tracked using AnnexinV/FITC dye following treatment with BH3-mimetic. Wild-type or TAp73 KO H1299 cells were treated with combination treatment of ABT-737 and S63845 at the indicated concentrations. Data points plotted as mean ± SD from n = 6 technical replicates. *P ≤ 0.05 (Student’s t-test), when comparing Cas9 control with TAp73 KO cells at 90 min and at the indicated dose of BH3-mimetic (0.5 µM and 1 µM). B Representative western blot against pro-apoptotic and anti-apoptotic proteins of the Bcl-2 family in WT and TAp73 KO cell lines. C Representative TEM micrographs of mitochondrial ultrastructure in WT and TAp73 KO cells. Yellow arrows highlight regions of disorganisation or loss of cristae in TAp73 KO cells. Scale bar = 200 nm. Quantification of mitochondrial cristae width (D) and cristae density (E) in TEM micrographs obtained from WT and TAp73 KO H1299 cells. Measurements were obtained from n ≥ 50 mitochondria, across two biological replicates. ****p < 0.0001 in Student’s t-test.
Fig. 4
Fig. 4. Trp73−/− mice exhibit decreased OPA1 expression and altered mitochondrial dynamics in the airway ciliated epithelium.
A Immunofluorescence staining performed against the cilia marker Ac-α-tubulin (green) with DAPI nuclear stain in tracheal cross-sections from WT and Trp73−/− mice (blue). Scale bar = 100 μm. B RT-qPCR for OPA1 mRNA expression in dissociated tracheal epithelial cells. Mouse trachea (n = 3 of each WT and Trp73−/−) were pooled together to obtain a sufficient number of cells. C Multiplexed IHC on mouse trachea against Ac-a-tubulin (yellow), OPA1 (red) and DAPI (blue). Cyan arrows indicate MCCs with low OPA1 expression. Scale bar = 30 μm. D Quantification of OPA1 expression in ciliated and non-ciliated cell populations from WT and Trp73−/− mice. E Images of individual sections of MCCs from WT and Trp73−/− ciliated epithelium obtained by SBF-SEM. Scale bar = 200 nm. F Mitochondrial length measurements were obtained from (E), including ciliated and non-ciliated cell populations. n ≥ 100 mitochondria from two samples of each genotype. ***P ≤ 0.001, n.s = not significant, in Student’s t-test.
Fig. 5
Fig. 5. Expression of Trp73 is decreased in COPD and correlates with OPA1 expression levels.
A Trp73 expression data from healthy and COPD individuals from previously described Lung Genomics Research Consortium (LGRC) cohort (GSE47460; Affymetrix array data from n = 157 healthy and n = 220 COPD patients). B Heatmap of Trp73, CDKN1A, OPA1 and FOXJ1 expression in healthy and COPD individuals from the LGRC cohort. The heatmap was generated with the PulmonDB tool using Scipy library in Python, utilising cosine distance and average linkage. Red/blue cells represent positive/negative values. C Row similarity matrix indicating the association between each gene across patient data shown in (B). Red shading indicates a positive similarity (measured as 1 - cosine-distance, with similarity values indicated). D, E Expression data showing the correlation between Trp73 and OPA1 (D), or Trp73 and CDKN1A (E) in COPD patients (GSE47460). Expression values are shown as Log2 fold change for the indicated genes relative to healthy control. The strength of the correlation was calculated using Pearson’s coefficient (r). F, G Analysis of scRNA-seq data from Control and COPD patients. Normalised gene counts were extracted for OPA1 in ciliated cell populations and displayed as mean expression per patient. Control n = 7, COPD n = 12, *P ≤ 0.05 in Student’s t-test. H Correlation plot of mean OPA1 and TP73 expression values per COPD patient. The indicated r value was calculated using Pearson’s coefficient.
Fig. 6
Fig. 6. TAp73 regulates mitochondrial dynamics in vitro and in airway multiciliated cells in vivo. Schematic illustration showing the identified role of TAp73 in regulating mitochondrial dynamics.
TAp73 expression is required for mitochondrial homeostasis in vitro and in the ciliated epithelium in vivo (green nuclei) (left). Conversely, TAp73 ablation leads to decreased OPA1 expression, mitochondrial fission, and impaired mitochondrial function (right). The Trp73−/− tracheal epithelium maintains a limited expression of FOXJ1 positive cells (purple), indicating additional mechanisms, such as the observed mitochondrial dysfunction drives MCC loss and COPD pathogenesis.

References

    1. Kaghad M, Bonnet H, Yang A, Creancier L, Biscan JC, Valent A, et al. Monoallelically expressed gene related to p53 at 1p36, a region frequently deleted in neuroblastoma and other human cancers. Cell. 1997;90:809–19. - PubMed
    1. Yang A, Kaghad M, Wang Y, Gillett E, Fleming MD, Dötsch V, et al. p63, a p53 homolog at 3q27-29, encodes multiple products with transactivating, death-inducing, and dominant-negative activities. Mol Cell. 1998;2:305–16. - PubMed
    1. Jost CA, Marin MC. Kaelin WG. p73 is a human p53-related protein that can induce apoptosis. Nature. 1997;389:191–4. - PubMed
    1. Collavin L, Lunardi A, Del Sal G. p53-family proteins and their regulators: hubs and spokes in tumor suppression. Cell Death Differ. 2010;17:901–11. - PubMed
    1. Murray-Zmijewski F, Lane DP, Bourdon JC. p53/p63/p73 isoforms: an orchestra of isoforms to harmonise cell differentiation and response to stress. Cell Death Differ. 2006;13:962–72. - PubMed