. 2024 Nov 8;10(1):217.
doi: 10.1038/s41531-024-00830-y.

Novel tools to quantify total, phospho-Ser129 and aggregated alpha-synuclein in the mouse brain

Affiliations

Novel tools to quantify total, phospho-Ser129 and aggregated alpha-synuclein in the mouse brain

Benjamin Guy Trist et al. NPJ Parkinsons Dis. .

Abstract

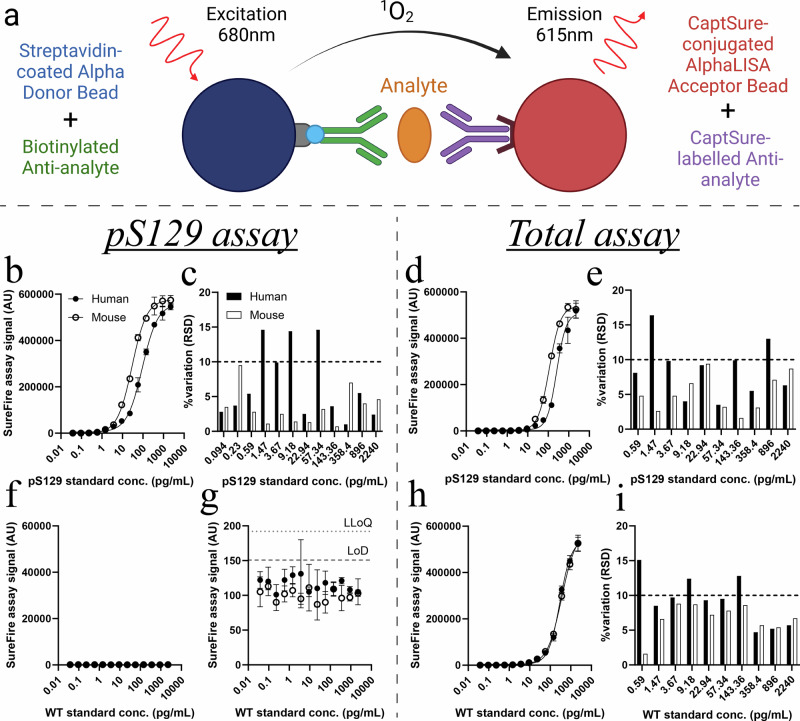
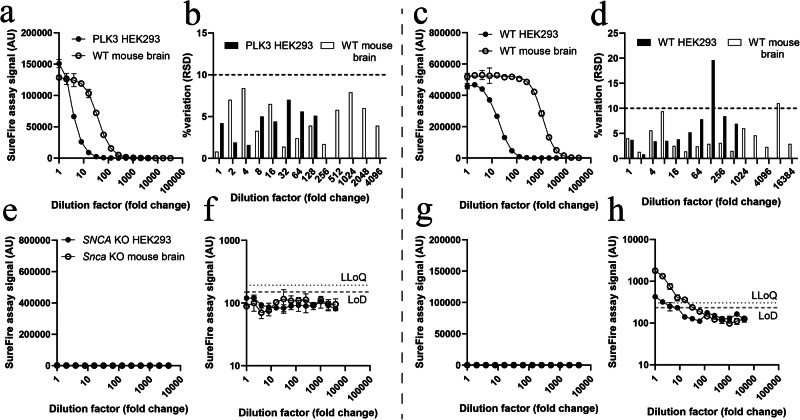
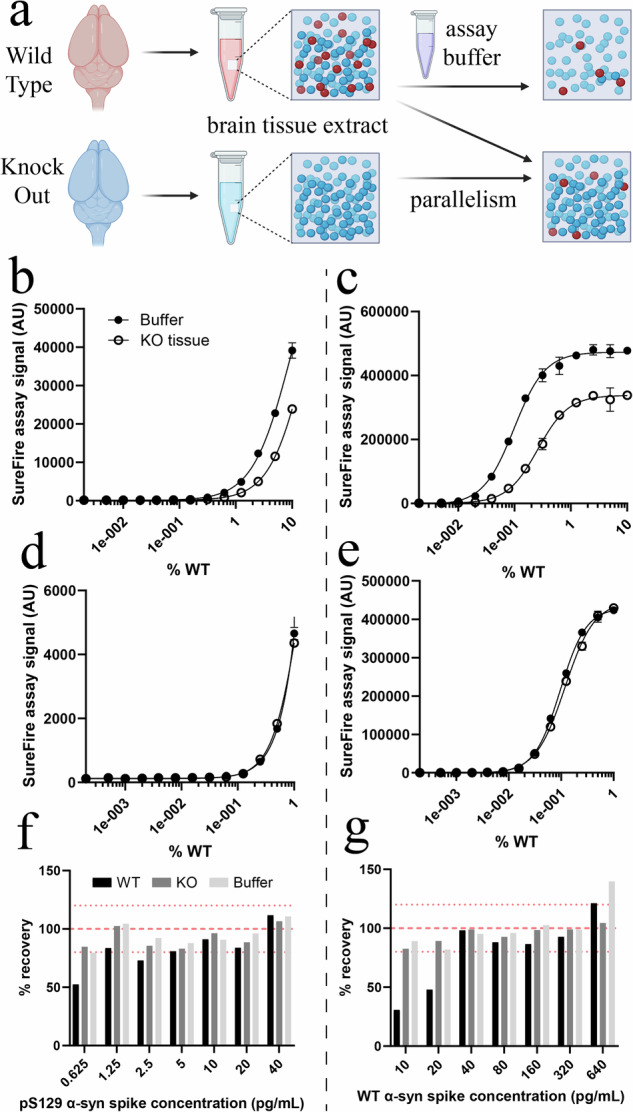
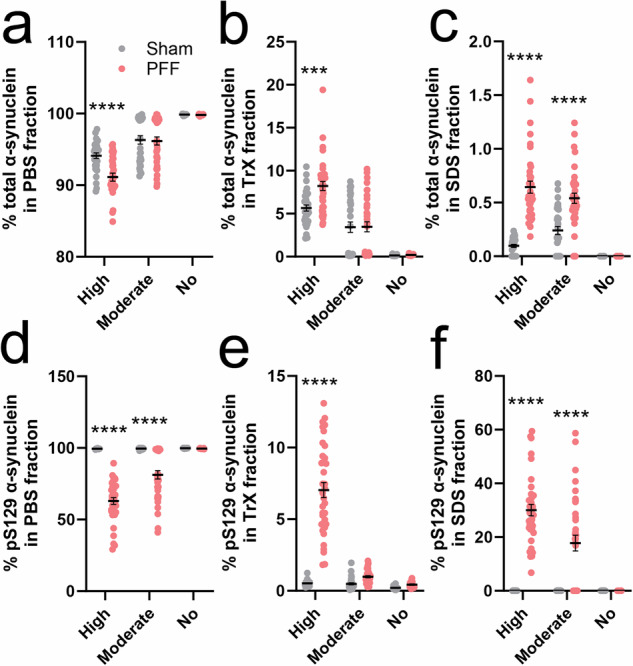
Assays for quantifying aggregated and phosphorylated (S129) human α-synuclein protein are widely used to evaluate pathological burden in patients suffering from synucleinopathy disorders. Many of these assays, however, do not cross-react with mouse α-synuclein or exhibit poor sensitivity for this target, which is problematic considering the preponderance of mouse models at the forefront of pre-clinical α-synuclein research. In this project, we addressed this unmet need by reformulating two existing AlphaLISA® SureFire® Ultra™ total and pS129 α-synuclein assay kits to yield robust and ultrasensitive (LLoQ ≤ 0.5 pg/mL) quantification of mouse and human wild-type and pS129 α-synuclein protein. We then employed these assays, together with the BioLegend α-synuclein aggregate ELISA, to assess α-synuclein S129 phosphorylation and aggregation in different mouse brain tissue preparations. Overall, we highlight the compatibility of these new immunoassays with rodent models and demonstrate their potential to advance knowledge surrounding α-synuclein phosphorylation and aggregation in synucleinopathies.


Conflict of interest statement

N.D. is an Associate Editor of npj Parkinson’s Disease. N.D. was not involved in the journal’s review of, or decisions related to, this manuscript. The authors declare no other competing interests.

Figures

Fig. 1
Fig. 1. Characterization of new pS129 and total α-synuclein SureFire Ultra assays using purified protein standards.
AlphaLISA SureFire Ultra assays are designed using two antibodies against a target protein, which are differentially tagged to ensure their selective conjugation to one of two types of Alpha beads; donor beads or acceptor beads. The binding of both antibodies to an analyte brings donor and acceptor beads into very close proximity, which enables donor beads to activate acceptor beads following sample photoexcitation to produce the assay signal (a). Five new formulations of the pS129 (left) and total (right) α-synuclein assay were characterized using purified human (Hu) and mouse (Ms) pS129 α-synuclein standards (be), as well as human and mouse wild-type α-synuclein standards (WT; fi). Data presented above represent only the most sensitive formulation of each assay. Associated data for all tested formulations are contained in Supplementary Tables 2, 3. Inter-assay variation (RSD) was calculated from three individual standard curves constructed and measured on separate days (c, e, i). The limit of detection (LoD) and lower limit of quantification (LLoQ) were defined as 3 and 6 standard deviations above the mean of the blank, respectively. Data in (b, d, f, h) represent mean ± standard deviation, while % variation data in (c, e, i) are only presented for standard concentrations detected above the LLoQ. For all standard curves; number of independent experiments (N) = 3, number of replicates in each experiment (n = 3). AU arbitrary units.
Fig. 2
Fig. 2. Characterization of new pS129 and total α-synuclein SureFire Ultra assays using mouse brain tissue extracts and HEK293 cell lysates.
The most sensitive new pS129 α-synuclein assay (left) was characterized using wild-type (WT) mouse brain tissue extracts and PLK3-transfected HEK293 cell lysates (a, b), while testing of the most sensitive total α-synuclein assay (right) utilized WT mouse brain tissue extracts and WT HEK293 cell lysates (c, d). Extracts and lysates were serially diluted using assay buffer. Associated assay data for all formulations tested are contained in Supplementary Table 4. Inter-assay variation (RSD) data presented in (b) and (d) were calculated from three individual dilution curves constructed and measured on separate days, with data only shown for extract/lysate dilutions above the lower limit of quantification (LLoQ). Phospho-S129 (e, f) and total (g, h) assay specificity were also assessed using SNCA knock-out (KO) HEK293 cell lysates and Snca KO mouse brain tissue extracts. Protein concentrations in each sample prior to serial dilution were as follows: WT mouse brain supernatant, 4.93 mg/mL; KO mouse brain supernatant, 5.48 mg/mL; WT HEK293 supernatant, 4.77 mg/mL; KO HEK293 supernatant, 5.6 mg/mL; PLK3-HEK293 supernatant, 6.55 mg/mL. The limit of detection (LoD) and LLoQ were defined as described in Fig. 1. Data in (a, b, g, h) represent mean ± standard deviation. For all standard curves; number of independent experiments (N) = 3, number of replicates in each experiment (n = 3). AU arbitrary units.
Fig. 3
Fig. 3. Evaluation of matrix effects and their impact on SureFire Ultra assay performance.
The magnitude of matrix effects produced by mouse brain tissue was first evaluated in new assay formulations using parallelism experiments (a). Matrix effects were measured for the pS129 (left) and total (right) assay using wild-type (WT) and Snca knock-out (KO) mouse brain tissue extracts that had both been diluted 10-fold (b, c) and 100-fold (d, e). Phospho-S129 (f) and WT (g) mouse α-synuclein were also spiked into WT and Snca KO mouse brain tissue extracts diluted 2000-fold and 100-fold, respectively, as well as assay buffer (AB), and spike recovery assessed using standard curves generated for purified mouse WT and pS129 α-synuclein. Measured spike concentration was calculated using the increase in assay signal above baseline signal generated by assay buffer, WT extract or KO extract, which was then expressed as a % of the intended spike concentration (% recovery). Wild-type α-synuclein was spiked into samples at 10–640 pg/mL and measured using the new total α-synuclein assay, while pS129 α-synuclein was spiked in at 0.625–40 pg/mL and measured using the new pS129 α-synuclein assay. Dotted red lines in (f) and (g) represent 80% and 120% spike recovery, while dashed red lines in these panels represent 100% spike recovery. Data in (be) represent mean ± standard deviation. For each panel; number of independent experiments (N) = 1, number of replicates in each experiment (n = 3). Associated data are contained in Supplementary Table 5–7. AU arbitrary units.
Fig. 4
Fig. 4. Profiling changes to the regional abundance of total and pS129 α-synuclein in the PFF mouse brain.
The deposition of pS129 α-synuclein was highly heterogeneous throughout the brains of mice inoculated with mouse α-synuclein PFFs (n = 3; a, b). a The representative burden of pS129 α-synuclein deposits (red dots) within the PFF mouse brain, which was assessed using pS129 α-synuclein immunofluorescent staining (EP1536Y, Abcam) of fixed 30 µm free-floating coronal brain tissue sections from 3-month-old PFF mice (b). Full immunofluorescent characterization of all investigated brain regions in sham (n = 3) and PFF (n = 3) mice is presented in Supplementary Fig. 4. Phosphorylated S129 (c) and total (d) α-synuclein were quantified in fresh tissue extracts from sham (n = 8) and PFF (n = 9) mouse brain regions exhibiting high (MC, ACC, SSC, AMG), moderate (OLF, STR, HIP, VMB) or no (MRN, CB) pS129 α-synuclein pathology using the reformulated SureFire Ultra pS129 and total α-synuclein assays. The proportion of pS129 α-synuclein (e) was calculated by normalizing pS129 α-synuclein levels to the total amount of α-synuclein in these same tissue extracts. Datapoints in (ce) represent the mean analyte quantity for a given sample, which was calculated from triplicate measurements of that sample in the same assay plate. Error bars in (ce) represent mean ± standard error of the mean for that sample group. Data in (ce) were generated from one independent experiment (N) performed in triplicate. *p < 0.05, **p < 0.01, ***p < 0.001, ****p < 0.0001; two-way ANOVA with Sidak’s multiple comparisons post-hoc tests, complete details of statistical tests are presented in Supplementary Table 8. ACC anterior cingulate cortex, AMG amygdala, AU arbitrary units, CB cerebellum, DMB dorso-medial midbrain, HIP hippocampus, MC motor cortex, OLF olfactory bulb, SSC somatosensory cortex, STR striatum, VMB ventral midbrain.
Fig. 5
Fig. 5. Characterizing alterations to the compartmental distribution of total and pS129 α-synuclein in the PFF mouse brain.
Fresh tissues from sham (n = 8) and PFF (n = 9) mouse brain regions exhibiting high (MC, ACC, SSC, AMG), moderate (OLF, STR, HIP, VMB) or no (MRN, CB) pS129 α-synuclein pathology following PFF inoculation were fractionated sequentially using saline solution containing protease and phosphatase inhibitors (PBS), followed by the same buffer containing 0.5% Tween-20 and 0.5% Triton X-100 (TrX), and finally with a TrX solution that had 2% SDS added to it (SDS). Total (ac) and pS129 (df) α-synuclein were then quantified in these fractions using the new SureFire Ultra assays. Datapoints represent the mean analyte quantity for a given sample, which was calculated from triplicate measurements of that sample in the same assay plate. Error bars represent mean ± standard error of the mean for that sample group. Data in all panels were generated from one independent experiment (N) performed in triplicate. ***p < 0.001, ****p < 0.0001; two-way ANOVA with Sidak’s multiple comparisons post-hoc tests, complete details of statistical tests are presented in Supplementary Table 8. Associated data are contained in Supplementary Tables 9, 10, with absolute amounts of total and pS129 α-synuclein contained within Supplementary Tables 11, 12. AU arbitrary units.
Fig. 6
Fig. 6. Profiling α-synuclein aggregation in the PFF mouse brain.
Semi-quantitative analysis of monomeric (a) and multimeric (b) pS129 α-synuclein (D1R1R, Cell Signalling Technology®) was performed in whole tissue extracts from representative sham and PFF mouse brain regions exhibiting high (ACC), moderate (STR) or no (CB) pS129 α-synuclein pathology using immunoblotting (n = 8–9/group/category). c Representative pS129 α-synuclein immunoblots from each representative brain region (ACC, STR, CB; full blots displayed in Supplementary Fig. 8). All regions exhibited monomeric (Mono) pS129 α-synuclein, while multimers (Multi) were also observed in regions of high and moderate pS129 α-synuclein burden. pS129 α-synuclein immunoreactivity was also observed just above the 20 kDa molecular weight marker, which is consistent with glycosylated (O-GlcNAc) monomeric α-synuclein (#). Aggregated α-synuclein was quantified in PBS- (d) and Triton-soluble (e) tissue fractions from all 10 regions of the sham (n = 8) and PFF (n = 9) mouse brain using the LEGEND MAX α-Synuclein Aggregate ELISA assay. Associated data are contained in Supplementary Table 13. Datapoints in (a, b, d, e) represent the mean analyte quantity for a given sample, which was calculated from triplicate measurements of that sample in the same assay plate or across different immunoblots. Error bars in (a, b, d, e) represent mean ± standard error of the mean for that sample group. Data in (a) and (b) were generated from triplicate measurements of target analytes across three independent experiments (N), while those in (d) and (e) were generated from one independent experiment (N) performed in triplicate. **p < 0.01, ***p < 0.001, ****p < 0.0001; two-way ANOVA with Sidak’s multiple comparisons post-hoc tests, complete details of statistical tests are presented in Supplementary Table 8. ACC anterior cingulate cortex, AMG amygdala, AU arbitrary units, CB cerebellum, DMB dorso-medial midbrain, HIP hippocampus, MC motor cortex, OLF olfactory bulb, SSC somatosensory cortex, STR striatum, VMB ventral midbrain.

References

    1. Koga, S., Sekiya, H., Kondru, N., Ross, O. A. & Dickson, D. W. Neuropathology and molecular diagnosis of synucleinopathies. Mol. Neurodegener.16, 83 (2021). - PMC - PubMed
    1. Halliday, G. M., Holton, J. L., Revesz, T. & Dickson, D. W. Neuropathology underlying clinical variability in patients with synucleinopathies. Acta Neuropathol.122, 187–204 (2011). - PubMed
    1. Wakabayashi, K. et al. The Lewy body in Parkinson’s disease and related neurodegenerative disorders. Mol. Neurobiol.47, 495–508 (2013). - PubMed
    1. Arima, K. et al. Immunoelectron-microscopic demonstration of NACP/alpha-synuclein-epitopes on the filamentous component of Lewy bodies in Parkinson’s disease and in dementia with Lewy bodies. Brain Res.808, 93–100 (1998). - PubMed
    1. Shahmoradian, S. H. et al. Lewy pathology in Parkinson’s disease consists of crowded organelles and lipid membranes. Nat. Neurosci.22, 1099–1109 (2019). - PubMed

LinkOut - more resources