. 2024 Nov 8;15(11):804.
doi: 10.1038/s41419-024-07196-2.

CARD16 restores tumorigenesis and restraints apoptosis in glioma cells Via FOXO1/TRAIL axis

Affiliations

CARD16 restores tumorigenesis and restraints apoptosis in glioma cells Via FOXO1/TRAIL axis

Ruoheng Xuan et al. Cell Death Dis. .

Abstract

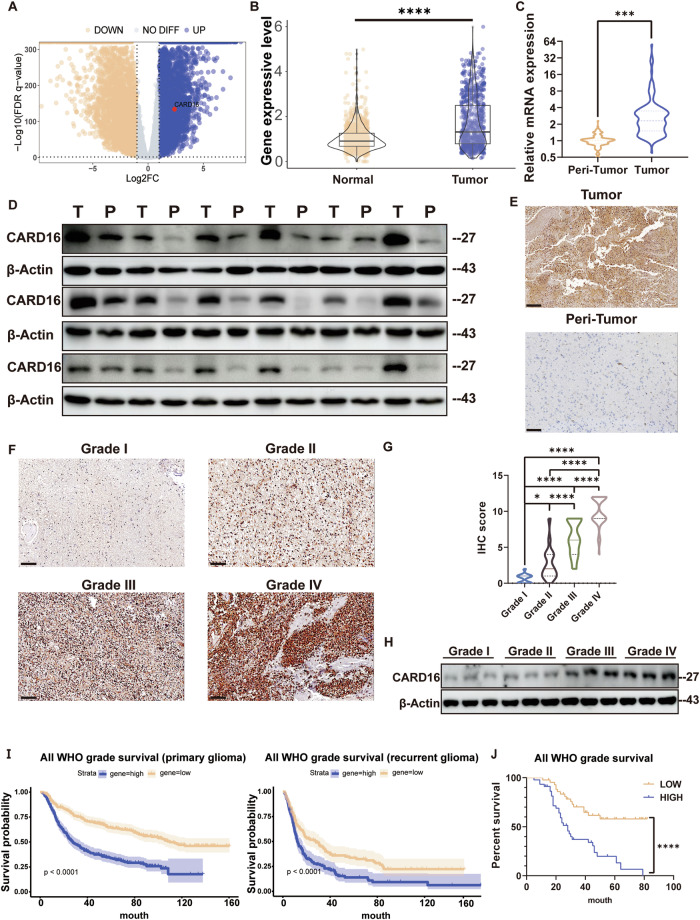
A hallmark of glioma cells, particularly glioblastoma multiforme (GBM) cells, is their resistance to apoptosis. Accumulating evidences has demonstrated that CARD16, a caspase recruitment domain (CARD) only protein, enhances both anti-apoptotic and tumorigenic properties. Nevertheless, there is a limited understanding of the expression and functional role of CARD16 in glioma. This study seeks to investigate, through in silico analysis and clinical specimens, the role of CARD16 as a potential tumor promoter in glioma. Functional assays and molecular studies revealed that CARD16 promotes tumorigenesis and suppresses apoptosis in glioma cells. Moreover, knockdown of CARD16 enhances the expression of the FOXO1/TRAIL axis in GBM cells. Additionally, FOXO1 downregulation in CARD16 knockdown GBM cells restores proliferation and reduces apoptosis. Further investigation demonstrated that elevated P21 expression inhibits CDK2-mediated FOXO1 phosphorylation and ubiquitination in CARD16-knockdown GBM cells. Collectively, these findings suggest that CARD16 is a tumor-promoting molecular in glioma via downregulating FOXO1/TRAIL axis, and suppressing TRAIL-induced apoptosis. The CARD16 gene presents significant potential for prognostic prediction and advances in innovative apoptotic therapeutics.


Conflict of interest statement

The authors declare no competing interests.

Figures

Fig. 1
Fig. 1. CARD16 expression is upregulated in glioma and associated with prognosis.
A Volcano plot of up-regulated and down-regulated genes in TCGA and GTEx. X-axis: log2 ratio of RNA expression levels between normal and tumor tissues. Y-axis: the FDR q-value (−log10 transformed) of RNAs. The red dot indicates gene expression of CARD16. B Gene expression level was compared between glioma samples(n = 697) and normal brain tissues (n = 1153) genes in TCGA and GTEx database (P < 0.0001). CE CARD16 expression level of paired tumor and peri-tumor tissue samples were detected by C qPCR (n = 40, P < 0.001), D WB(n = 40) and E IHC(n = 30). Scale bar, 100 μm. F, G Representative IHC images and IHC scores of CARD16 expression level in glioma samples(n = 100). Scale bar, 100 μm. H WB assay of CARD16 expression level in glioma samples of different WHO grades. I Log-rank analysis of CARD16 expression in GBM of CGGA dataset. Left, OS of primary glioma patients. Right, OS of recurrent glioma patients. J Survival analysis of glioma patients based on CARD16 expression. With an IHC-Score >7 being defined as high expression and an IHC-Score ≤7 being defined as low expression. Statistical results are presented as mean ± SD, *p < 0.05, **p < 0.01, ***p < 0.001, ****p < 0.0001. Data are representative from at least three experiments with similar results. Error bars represent independent experiments.
Fig. 2
Fig. 2. CARD16 is upregulated in GBM cell lines and associated with tumorigenesis.
A WB of NHA, GBM cell lines, and GSCs using antiCARD16 antibodies. B CARD16 mRNA expression level in NHA, GBM cell lines, and GSCs. C, D WB and qRT-PCR of CARD16 expression in CARD16 knockdown GBM cell lines LN18 and T98G and CARD16-overexpressing glioma cell line HS683. E Correlation of CARD16 and NFKB1 and VEGFA expression in CGGA databases. F, G Tumor proliferation marker NFKB1-p65, tumor angiogenesis marker VEGFA, and cell cycle protein cyclin D1/E1 were determined by WB(F) and qPCR(G) in LN18, T98G, and HS683 with indicated modifications. Statistical results are presented as mean ± SD, *p < 0.05, **p < 0.01, ***p < 0.001, ****p < 0.0001. Data are representative from at least three experiments with similar results. Error bars represent independent experiments.
Fig. 3
Fig. 3. CARD16 enhances proliferation, invasion, and migration in human glioma cells.
A CCK-8 assay of LN18 and T98G with CARD16 NC and sh cells, and HS683 with CARD16 OV and EV cells. B Plate colony formation for testing cell proliferation. Upper, CARD16 NC and sh LN18 and T98G cells were decided. Lower, CARD16 OV and EV HS683 cells were decided. Scale bar, 5 mm. C EdU assay for determining cell proliferation. Upper, CARD16 NC and sh LN18 and T98G cells were decided. Lower, CARD16 OV and EV HS683 cells were decided. At least six independent fields of cells were counted and measured. Scale bar, 100 μm. F Scratch healing assay to evaluate the cell migration. Left, CARD16 NC and sh LN18 and T98G cells were tested. Right, CARD16 OV and EV HS683 cells were tested. Scale bar, 500 μm. H Transwell assay for evaluating cell invasion. Left, CARD16 NC and sh LN18 and T98G cells were decided. Right, CARD16 OV and EV HS683 cells were decided. I Transwell assay for evaluating cell migration. Left, CARD16 NC and sh LN18 and T98G cells were decided. Right, CARD16 OV and EV HS683 cells were decided. At least six highly magnifying fields of microscopes were counted and measured in Fig. H and I. Scale bar, 100 μm. Fig. D, E, G, J, K Plate colony numbers, EdU+ cell percentage, scratch healing percentage, invasion cell counts and migration cell counts were analyzed, respectively. Statistical results are presented as mean ± SD, *p < 0.05, **p < 0.01, ***p < 0.001, ****p < 0.0001. Data are representative from at least three experiments with similar results. Error bars represent independent experiments.
Fig. 4
Fig. 4. Knockdown of CARD16 enhances GBM cell apoptosis.
A WB of apoptosis related protein Cleaved PARP, Cleaved Caspase8, Cleaved Caspase9, Cleaved Caspase3 in CARD16 NC and sh LN18 and T98G cells. B Typical morphological changes of apoptosis such as apoptotic body were found in CARD16 sh LN18 and T98G cells under electron microscopes. Scale bar, 2μm. C Caspase8 activity were measured in CARD16 NC and sh LN18 and T98G cells. D, E Tunel assay of CARD16 shRNA transfected LN18 and T98G cells and their control cells were decided. At least six independent fields of cells were measured. Scale bar, 100 μm. F, G Cell apoptosis were measured by cell cytometry of LN18 and T98G with CARD16 knockdown and their normal control. Statistical results are presented as mean ± SD, *p < 0.05, **p < 0.01, ***p < 0.001, ****p < 0.0001. Data are representative from at least three experiments with similar results. Error bars represent independent experiments.
Fig. 5
Fig. 5. FOXO1 is downstream targets of CARD16 in GBM cells.
A Volcano plot of DEGs in CARD16 knockdown LN18 and control cells. FOXO1, FOXO3 and TNFSF10(TRAIL) were upregulated in CARD16 knockdown LN18. B KEGG enrichment in CARD16 knockdown LN18 was performed. TNF signaling and FOXO signaling were enriched. C CARD16-related enrichment plots were shown in GSEA enrichment. Compared to LN18 NC, FOXO-related transcription and programmed cell death were upregulated in CARD16 knockdown LN18. D, E WB and qPCR of FOXO1, Caspase8, DR5, and TRAIL in LN18 and T98G with CARD16 knockdown and their normal control. F, G Immunofluorescence was performed using anti-CARD16 and anti-FOXO1 antibody in CARD16 shRNA transfected LN18 and T98G cells and their control cells. Scale bar, 20 μm. H, I Immunofluorescence was performed using anti-FOXO1 and anti-TRAIL antibody in CARD16 shRNA transfected LN18 and T98G cells and their control cells. At least six highly magnifying fields of microscopes were counted and measured in Fig. F and H. Scale bar, 10 μm. J Localization of FOXO1 and p-FOXO1 in the nucleus was decided by WB assay using nuclear protein. K Correlation of FOXO1 and TNFSF10 expression in the CGGA databases. L Abundance of transcription factor binding site (TFBS) 1 and 2 after PCR were indicated through Agarose gel electrophoresis. M Anti-FOXO1/IgG ChIP enrichment of TFBS 1 and 2 were confirmed by ChIP-qPCR.Statistical results are presented as mean ± SD, *p < 0.05, **p < 0.01, ***p < 0.001, ****p < 0.0001. Data are representative from at least three experiments with similar results. Error bars represent independent experiments.
Fig. 6
Fig. 6. Depleting FOXO1 restores proliferation and reduces apoptosis of GBM.
A WB were preformed to detect the expression of FOXO1, Caspase 8, and TRAIL in siFOXO1 transferred CARD16 knockdown LN18 and T98G. B FOXO1 mRNA expression level was decided through qPCR in siFOXO1 transferred CARD16 knockdown LN18 and T98G. C Immunofluorescence was performed using anti-FOXO1 and anti-TRAIL antibody in siFOXO1 transferred CARD16 knockdown LN18 and T98G and their control cells. Scale bar, 10 μm. D Cell proliferation of CARD16 sh cells and NC. E. Plate colony formation of siFOXO1 transferred CARD16 sh and NC cells. Scale bar, 5 mm. G Cell migration assay of siFOXO1 transferred CARD16 sh and NC cells. Scale bar, 100 μm. I Tunel assay of siFOXO1 transferred CARD16 sh and NC cells. Scale bar, 50 μm. Fig. F, H, J. Plate colony numbers, migration cell counts, and mean fluorescence intensity of Tunel assay were analyzed. Statistical results are presented as mean ± SD, *p < 0.05, **p < 0.01, ***p < 0.001, ****p < 0.0001. At least six highly magnifying fields of microscopes were counted and measured. Data are representative from at least three experiments with similar results. Error bars represent independent experiments.
Fig. 7
Fig. 7. Downregulation of CARD16 restricts the tumorigenicity of GBM cells in vivo.
A Intracranial tumor formation patterns in nude mice. B Representative images of in vivo fluorescence assay on days 42 post-implantation using LN18 and T98G with indicated modifications. Each group contains 5 mice. C Representative images of HE staining of mouse brains harvested on days 35 after in vivo fluorescence assay. Scale bar, 1 mm. D Body weight change curves of nude mice with intracranial tumors. Each group contains 5 mice. E Survival curves calculated using the Kaplan-Meier method of nude mice with intracranial tumors. Each group contains 5 mice. F Representative immunohistochemistry (IHC) images of CARD16, FOXO1, TRAIL, and Ki-67 expression in the above mice. Scale bar, 100 μm. Statistical results are presented as mean ± SD, *p < 0.05,. Data are representative from at least three experiments with similar results.
Fig. 8
Fig. 8. CARD16 knockdown diminishes CDK2-mediated ubiquitination of FOXO1.
A WB were preformed to detect the expression of FOXO1, p-FOXO1 Ser256, p-FOXO1 Ser249, p-CDK2 Thr160, CDK2, and P21 in CARD16 knockdown LN18 and T98G. B Equal quantities of cells were cultured in complete medium supplemented with MG132 for a duration of 8 h. Subsequently, the cells were lysed for IP and WB with the indicated antibodies. C Cells were cultured in complete medium supplemented with UC2288 for 16 h, followed by MG132 treatment for 8 h and lysed for IP and WB. D. IP and WB assay using lysate from NC and sh cells supplemented with UC2288 and MG132. Data are representative from at least three experiments with similar results. E The schematic diagram shows the proposed mechanism that CARD16 restores tumorigenesis and restraints apoptosis through FOXO/TRAIL axis in glioma.

References

    1. Lapointe S, Perry A, Butowski NA. Primary brain tumours in adults. Lancet. 2018;392:432–46. - PubMed
    1. Tan AC, Ashley DM, Lopez GY, Malinzak M, Friedman HS, Khasraw M. Management of glioblastoma: State of the art and future directions. CA Cancer J Clin. 2020;70:299–312. - PubMed
    1. Singh R, Letai A, Sarosiek K. Regulation of apoptosis in health and disease: the balancing act of BCL-2 family proteins. Nat Rev Mol Cell Biol. 2019;20:175–93. - PMC - PubMed
    1. Newton K, Strasser A, Kayagaki N, Dixit VM. Cell death. Cell. 2024;187:235–56. - PubMed
    1. Yuan J, Ofengeim D. A guide to cell death pathways. Nat Rev Mol Cell Biol. 2024;25:379–95. - PubMed

MeSH terms

Substances

LinkOut - more resources