. 2024 Nov 8;7(1):1472.
doi: 10.1038/s42003-024-07144-y.

ZBTB18 regulates cytokine expression and affects microglia/macrophage recruitment and commitment in glioblastoma

Affiliations

ZBTB18 regulates cytokine expression and affects microglia/macrophage recruitment and commitment in glioblastoma

Roberto Ferrarese et al. Commun Biol. .

Abstract

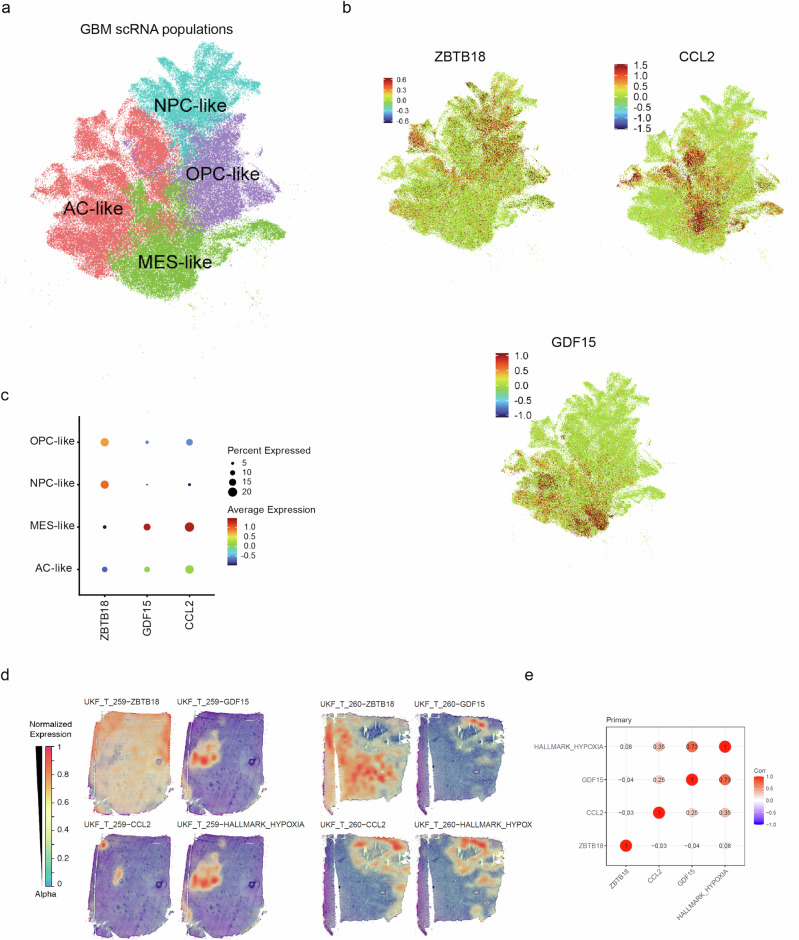
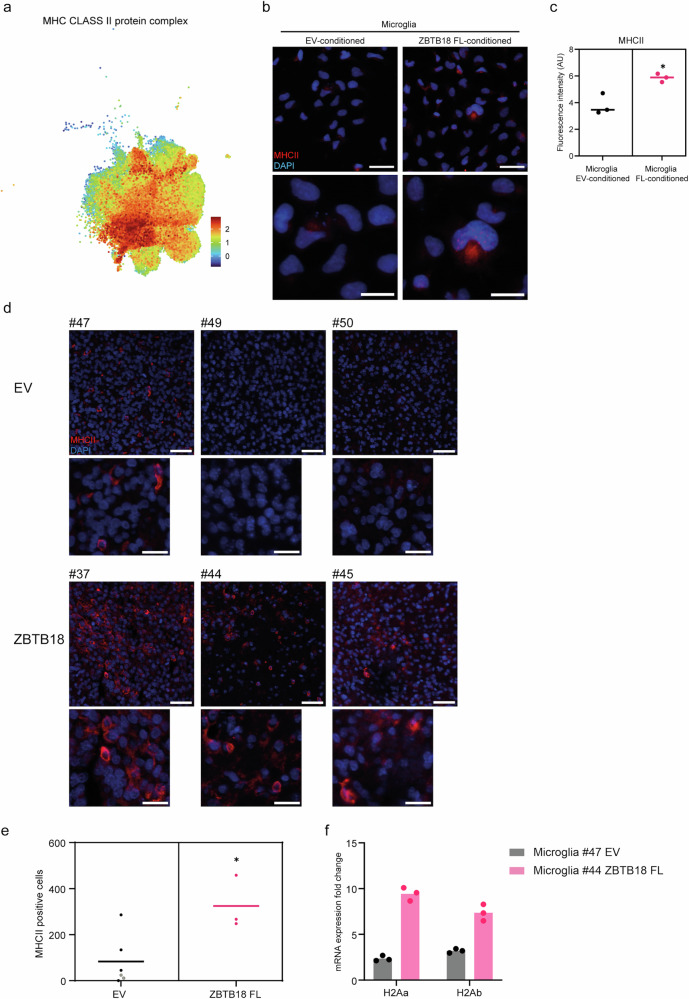
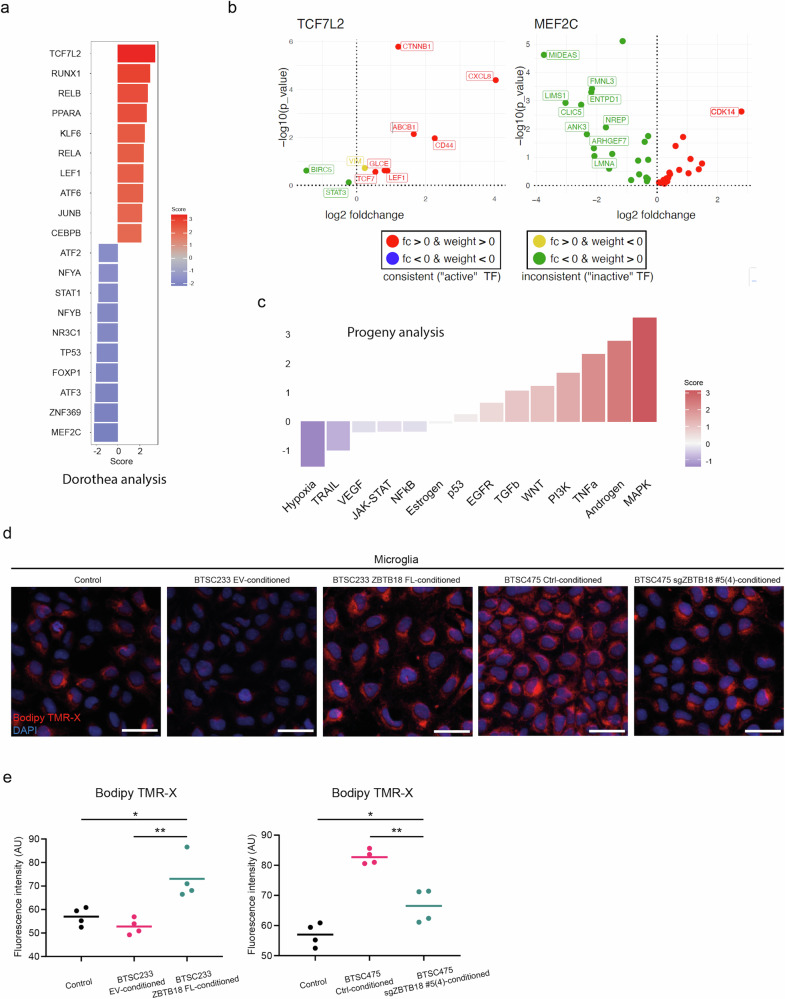
Glioma associated macrophages/microglia (GAMs) play an important role in glioblastoma (GBM) progression, due to their massive recruitment to the tumor site and polarization to a tumor promoting phenotype. GAMs secrete a variety of cytokines, which facilitate tumor cell growth and invasion, and prevent other immune cells from mounting an immune response against the tumor. Here, we demonstrate that zinc finger and BTB containing domain 18 (ZBTB18), a transcriptional repressor with tumor suppressive function in glioblastoma, impairs the production of key cytokines, which function as chemoattractant for GAMs. Consistently, we observe a reduced migration of GAMs when ZBTB18 is expressed by glioblastoma cells, both in cell culture and in vivo experiments. Moreover, RNA sequencing analysis shows that the presence of ZBTB18 in glioblastoma cells alters the commitment of conditioned microglia, suggesting the loss of the immune-suppressive phenotype and the acquisition of pro-inflammatory features. Thus, therapeutic approaches to increase ZBTB18 expression in GBM cells could represent an effective adjuvant to immune therapy in GBM.


Conflict of interest statement

The authors declare no competing interests.

Figures

Fig. 1
Fig. 1. ZBTB18 halts the expression and secretion of cytokines in GBM cells.
a Venn diagram representing the intersection of three gene expression arrays performed on SNB19, BTSC233, and JX6 cells and two RNAseq analysis in BTSC268 and BTSC475, with or without ZBTB18 FL overexpression. b Quantitative RT-PCR of selected cytokine genes in SNB19 and BTSC233 cells with or without ZBTB18 overexpression. n = 3 biological replicates; error bars ± s.d.; *P < 0.05, **P < 0.01, and ***P < 0.001 by a t test. Gene expression was normalized to 18S RNA. c Representative cytokine array membranes performed on BTSC233 transduced with empty vector (EV) or ZBTB18 FL. The significantly down- or up-regulated cytokines upon ZBTB18 FL overexpression are highlighted. d Quantification of the significantly regulated cytokines highlighted in (c). n = 3 biological replicates, error bars ± s.d.; *P < 0.05, **P < 0.01, and ***P < 0.001 by a t test. e GDF-15 ELISA showing the amount of GDF-15 secreted in the conditioned medium of SNB19 ectopically expressing ZBTB18 FL or ZBTB18 Nte-SF, or of BTSC233 cells upon ZBTB18 FL overexpression. n = 3 biological replicates (SNB19), n = 5 biological replicates (BTSC233); error bars ± s.d.; *P < 0.05, **P < 0.01, and ***P < 0.001 by a t test. f Enrichment of FLAG-ZBTB18 ChIP at the CCL2 (left panel) and GDF15 (right panel) promoters, in BTSC233 cells transduced with empty vector (EV) or FLAG-ZBTB18 FL. Graphs show the average q-RT PCR results of three independent ChIPs expressed in % input as indicated. Error bars ±s.d.; *P < 0.05 by a t test.
Fig. 2
Fig. 2. Removing ZBTB18 and LSD1 differentially impact CCL2 and GDF15 expression and secretion.
a Cytokine array membranes performed on BTSC475 Ctrl and BTSC475-sgZBTB18 #5(4). Relevant cytokines are highlighted. The calculated fold change based on the normalized signals is indicated. b CCL2 (left panel) and GDF-15 (right panel) ELISA showing the amount of secreted proteins in the conditioned medium of two independent ZBTB18 knockdown cell lines (BTSC475sgZBTB18 #4(24) and BTSC475sgZBTB18 #5(4)). n = 4 replicates; error bars ±s.d.; *P < 0.05, **P < 0.01, and ***P < 0.001 by a t test. c Enrichment of ZBTB18 ChIP at the CCL2 (left panel) and GDF15 (right panel) promoters, in BTSC475sgZBTB18 #5(4). Graphs show the average q-RT PCR results of three independent ChIPs expressed in % input as indicated. Error bars ±s.d.; *P < 0.05 by a t test. d q-RT PCR analysis of CCL2 and GDF15 expression, upon ZBTB18 knockdown (sgZBTB18 #5(4)) and/or LSD1 silencing in BTSC475. Gene expression was normalized to 18 s RNA. n = 3 biological replicates; error bars ±s.d.; *P < 0.05, **P < 0.01, and ***P < 0.001 by a t test. e q-RT PCR analysis of CCL2 and GDF15 expression, in BTSC475 treated with 5 µM RN-1 for 96 hours. Gene expression was normalized to 18 s RNA. n = 3 biological replicates; error bars ±s.d.; *P < 0.05, **P < 0.01, and ***P < 0.001 by a t test. f CCL2 (left panel) and GDF-15 (right panel) ELISA showing the amount of the secreted proteins in the conditioned medium of BTSC475 transduced with sgZBTB18 #5(4)) and/or shLSD1. n = 4 biological replicates; error bars ±s.d.; *P < 0.05, **P < 0.01, and ***P < 0.001 by a t test. g Western blot analysis of pro- and mature GDF-15 in BTSC475 transduced with sgZBTB18 #5(4)) and/or shLSD1. αTubulin is used as a loading control. h Quantification of pro- and mature GDF-15 (normalized to αTubulin) detected in (g).
Fig. 3
Fig. 3. Cytokines and ZBTB18 are complementary expressed within GBM subtypes.
a UMAP plot of the neoplastic cells within the dataset used for data analysis (GBMap). The cells are stratified based on transcriptional programs: Neuronal progenitor cell like (NPC-like), Oligodendrocyte progenitor cell like (OPC-like), Astrocytic cell like (AC-like) and Mesenchymal like (MES-like). b UMAP plot of ZBTB18, CCL2 and GDF15 expression within the neoplastic population. The color bar represents the expression levels represented. c Dotplot visualization of the enrichment of ZBTB18, CCL2 and GDF15 expression within neoplastic cell transcriptional programs. d stRNA visualization of the hallmark_hypoxia tumor area and the spatial localization of ZBTB18, CCL2 and GDF15 expression in two independent GBM sections. e Dotplot visualization of the spatial co-localization of the hallmark_hypoxia tumor area and ZBTB18, CCL2 and GDF15 expression. The correlation values are displayed.
Fig. 4
Fig. 4. ZBTB18 expression in GBM cells impairs the GAM recruitment.
a Representative micrographs of mouse brain sections with tumors derived from BTSC233 EV or BTSC233 ZBTB18 FL xenografts and stained with IBA1 antibody; scale bar: 50 µm. b Quantification of the immunostaining shown in (A); n = 9 biological replicates; error bars ±s.d.; *P < 0.05 by a t test. c Representative micrographs of brain tumor biopsies stained with ZBTB18 (left) and IBA1 (right) antibodies; scale bar: 50 µm. d Correlation between IBA1 and ZBTB18 signal intensity derived from the immunostaining of brain tumor biopsies shown in (c); r = −0.43, p Value = 0.00. e Pearson correlation analysis between ZBTB18 and AIF1 expression in the TCGA_GBMLGG dataset. f Invasion assay of non-treated microglia and microglia exposed to culture medium conditioned by BTSC233 EV or BTSC233 ZBTB18 FL cells. Each sample was treated with CCL2, GDF-15, or mock control. n = 3 biological replicates; error bars ±s.d.; *P < 0.05, **P < 0.01, and ***P < 0.001 by a t test. g Invasion assay of microglia exposed to culture medium of BTSC233 cells treated with CCL2 or GDF-15 neutralizing antibodies. n = 3 biological replicates; error bars ±s.d.; *P < 0.05, **P < 0.01, and ***P < 0.001 by a t test.
Fig. 5
Fig. 5. ZBTB18 expression in GBM cells affects microglia activation.
a Experimental flow chart of the conditioned microglia characterization by RNAseq. b Principal Component Analysis (PCA) showing the clustering of the three replicates of each experimental condition. c Top 10 up- or down-regulated pathways identified by Gene Set Enrichment Analysis (GSEA, gage, Hallmarks) in ZBTB18 FL-conditioned vs. EV-conditioned microglia. Processes related to pro-inflammatory or pro-tumorigenic microglia features are highlighted. d UMAP plot of the expression of differentially expressed gene in microglia conditioned with medium from BTSC233 expressing EV, ZBTB18 FL, or ZBTB18 Nte-SF, within the TAM population. The plots depict enrichment of cells that express upregulated genes from long read RNA sequencing mapped to the scRNA dataset. The color bar represents the expression levels of the transcriptional program represented. UMAP plot of the TAMs within the dataset used for data analysis (GBMap) is shown as reference; the cells are stratified based on transcriptional programs. e Dotplot visualization of the enrichment within TAM transcriptional programs, of differentially regulated genes in microglia treated as in (d). f UMAP plot of the expression of oxidative phosphorylation genes within the TAM population. The color bar represents the expression levels of the transcriptional program represented. g Oxygen consumption rate/extracellular acidification rate ratio measured by Seahorse ATP production rate assay in microglia exposed to culture medium conditioned by BTSC233 EV, BTSC233 ZBTB18 FL, or BTSC233 ZBTB18 Nte-SF cells. n = 3 biological replicates; error bars ±s.d.; *P < 0.05, **P < 0.01, and ***P < 0.001 by a t test.
Fig. 6
Fig. 6. ZBTB18 expression in GBM cells induces a shift in microglia commitment.
a Volcano plot showing the top 15 differentially regulated genes and the 10 top differentially regulated cytokines, adjusted p value (QV) in the ZBTB18 FL vs EV comparison. Selected top UP and DOWN regulated genes are labeled (light blue boxes), cytokines are marked as white boxes. Color code represents the average normalized intensity (log2). Dash line indicates the significance threshold at 0.05 adjusted p value. UMAP plot of S100A4 expression within the neoplastic population (b) and within TAMs (c). The color bar represents the expression levels represented. d Top 10 up- or down-regulated pathways identified by GSEA (gage, Keyword “Inflammation”) in ZBTB18 FL-conditioned vs. EV-conditioned microglia. Processes related to pro-inflammatory or anti-inflammatory responses are highlighted. e Jaccard plots showing overlap between the deregulated “Inflammation” signatures. Color code represents the Jaccard index between two terms. f Heatmap showing the up-or downregulated myeloid signatures from Abdellfattah et al., analyzed by GSEA. Significant regulated signatures in the different group comparisons are highlighted with an asterisk (adj. p < 0.05).
Fig. 7
Fig. 7. ZBTB18 affects MHCII expression in microglia in vivo.
a UMAP plot of MHC class II protein complex expression within TAMs. The color bar represents the expression levels represented. b Representative micrographs of microglia conditioned with BTSC233 EV medium or BTSC233 ZBTB18 FL medium and stained with MHCII antibody; scale bar: 50 µm. c Quantification of the immunostaining shown in (g); n = 3 biological replicates; *P < 0.05 by a t test. d Representative micrographs of mouse brain sections with tumors derived from KAB203 EV or KAB203 ZBTB18 FL cells and stained with MHCII antibody; scale bar: 50 µm (top panels) and 25 µm (insets, bottom panels). e Quantification of the immunostaining shown in (d); n = 6 (EV), n = 3 (ZBTB18 FL) biological replicates; *P < 0.05 by a t test. Dark dots correspond to the samples shown in (d) and (Supplementary Fig. 12b). f q-RT PCR analysis of H2Aa and H2Ab expression, in the indicated KAB203-derived tumors. Gene expression was normalized to mouse Hprt. n = 3 technical replicates; error bars ±s.d.
Fig. 8
Fig. 8. ZBTB18 expression in GBM cells induces inflammatory-related pathways and features.
a Bar plot showing the top 10 UP and DOWN TFs associated with genes, which are deregulated in ZBTB18 FL-conditioned vs. EV-conditioned microglia, based on DOROTHEA analysis. Color code represents the score from decoupleR enrichment analysis (normalized weighted mean). b Plots showing TCF7L2 (left panel) and MEF2C (right panel) associated genes. All known annotated targets from DOROTHEA are shown. Top10 absolute log2 fold change are labeled. Consistency between the log2 fold change and the prior knowledge (i.e., weight) is color coded. c Bar plot generated by Progeny analysis, showing the association with genes, which are deregulated in ZBTB18 FL-conditioned vs. EV-conditioned microglia. Color code represents the score from decoupleR enrichment analysis (normalized weighted mean). d Bodipy TMR-X lipid staining of microglia conditioned with EV or ZBTB18-FL expressing BTSC233 or BTSC475 cells (ctrl or upon ZBTB18 KO (sgZBTB18 #5(4)). Nuclei were counterstained with DAPI. Scale bar: 50 μm. Quantification of Bodipy TMR-X lipid staining shown in (e). n = 4 biological replicates; *P < 0.05, **P < 0.01.

References

    1. Dunn, G. P. et al. Emerging insights into the molecular and cellular basis of glioblastoma. Genes Dev.26, 756–784 (2012). - PMC - PubMed
    1. Phillips, H. S. et al. Molecular subclasses of high-grade glioma predict prognosis, delineate a pattern of disease progression, and resemble stages in neurogenesis. Cancer Cell9, 157–173 (2006). - PubMed
    1. Verhaak, R. G. et al. Integrated genomic analysis identifies clinically relevant subtypes of glioblastoma characterized by abnormalities in PDGFRA, IDH1, EGFR, and NF1. Cancer Cell17, 98–110 (2010). - PMC - PubMed
    1. Wang, Q. et al. Tumor evolution of glioma-intrinsic gene expression subtypes associates with immunological changes in the microenvironment. Cancer Cell32, 42–56.e46 (2017). - PMC - PubMed
    1. Patel, A. P. et al. Single-cell RNA-seq highlights intratumoral heterogeneity in primary glioblastoma. Science344, 1396–1401 (2014). - PMC - PubMed