. 2024 Dec;25(12):2297-2307.
doi: 10.1038/s41590-024-01999-3. Epub 2024 Nov 8.

Dysfunction of exhausted T cells is enforced by MCT11-mediated lactate metabolism

Affiliations

Dysfunction of exhausted T cells is enforced by MCT11-mediated lactate metabolism

Ronal M Peralta et al. Nat Immunol. 2024 Dec.

Abstract

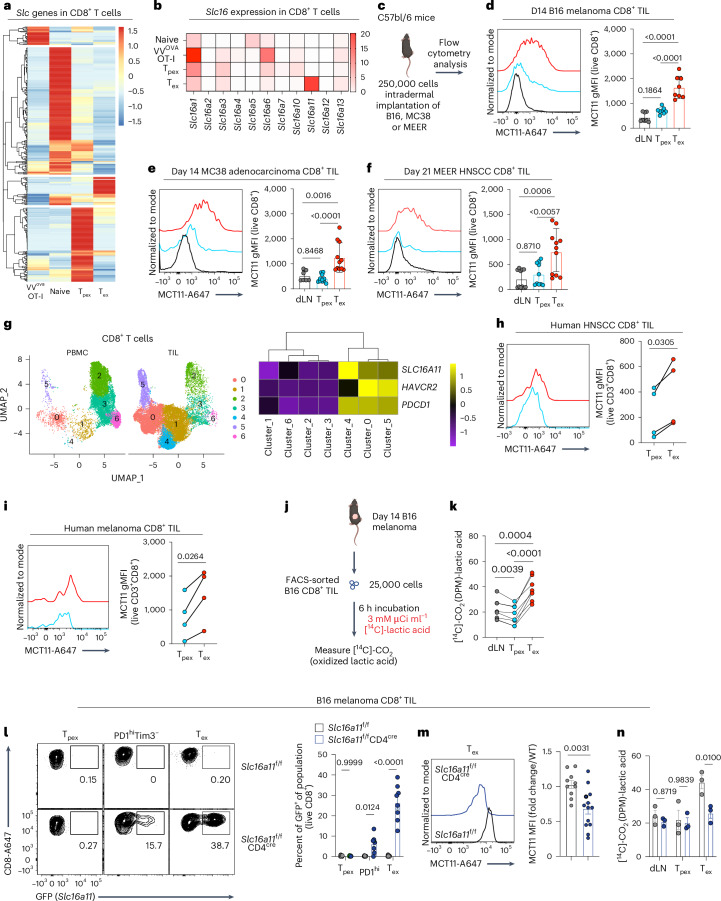
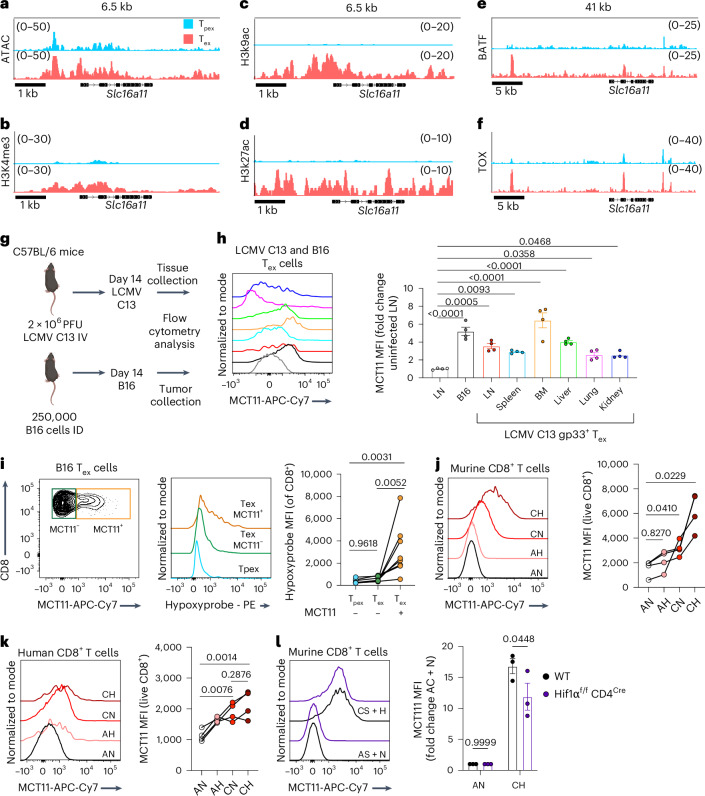
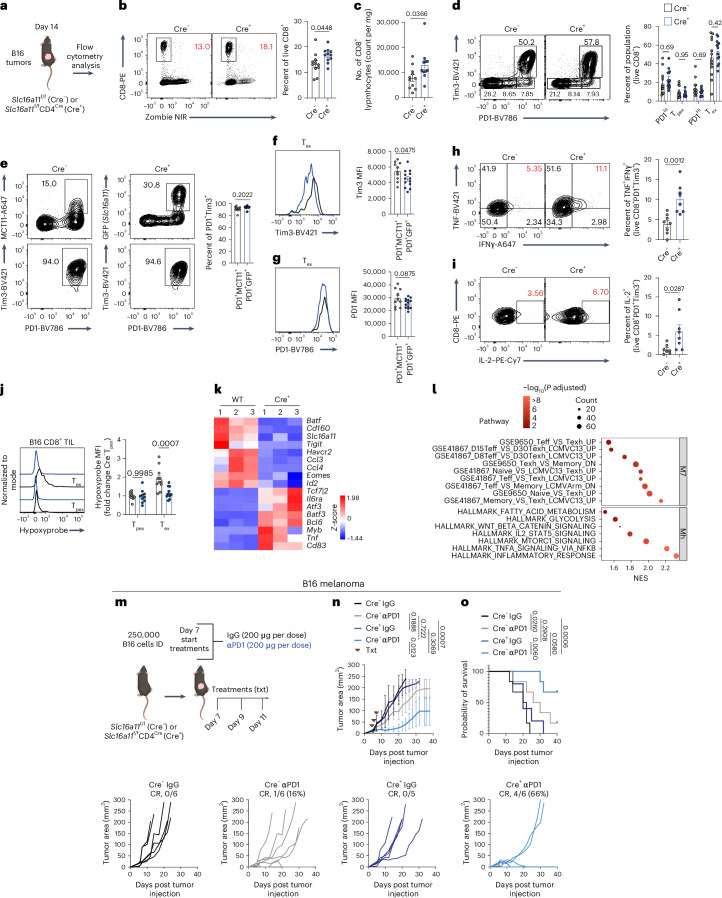
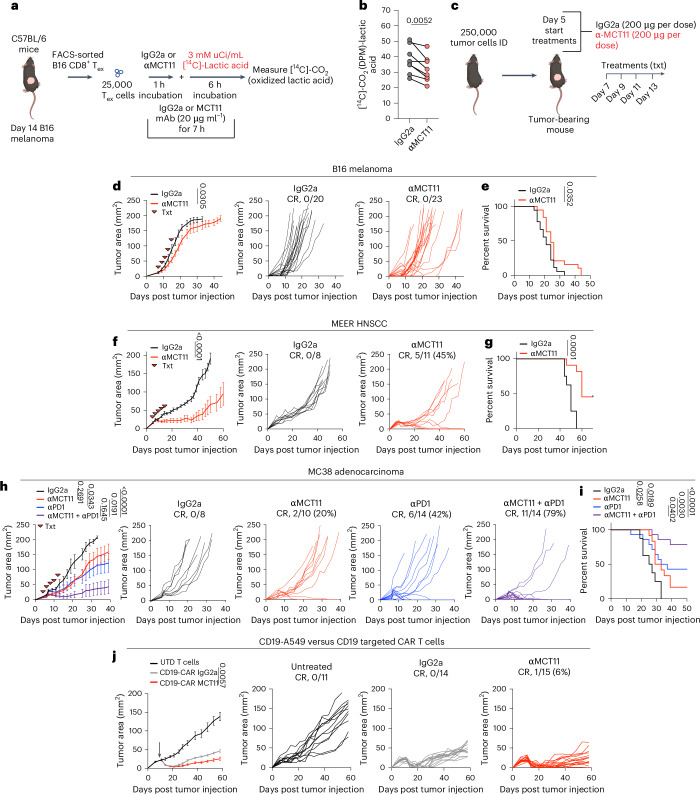
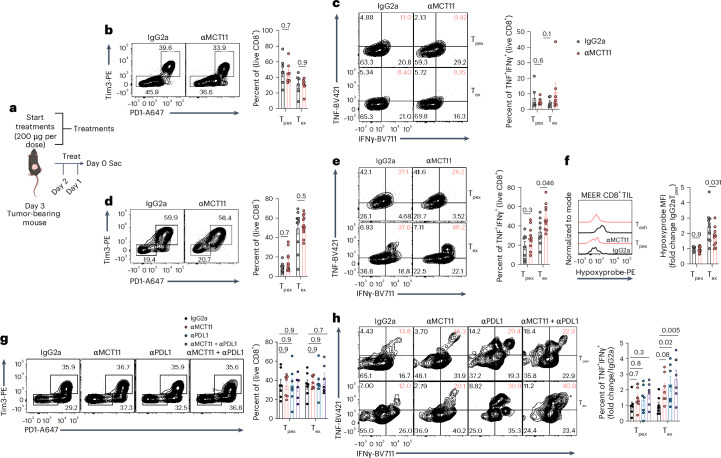
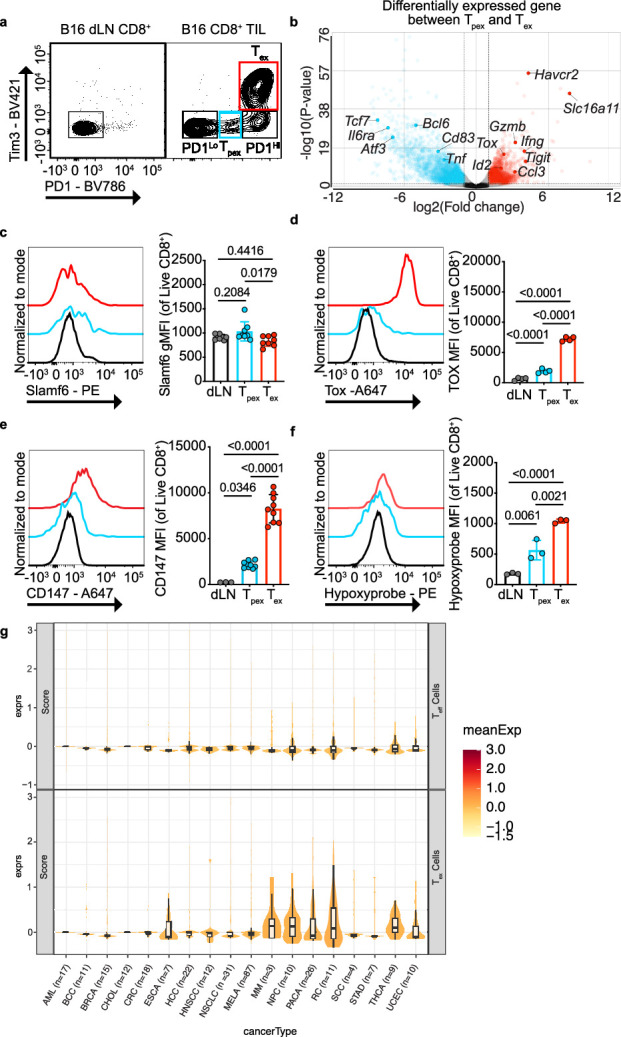
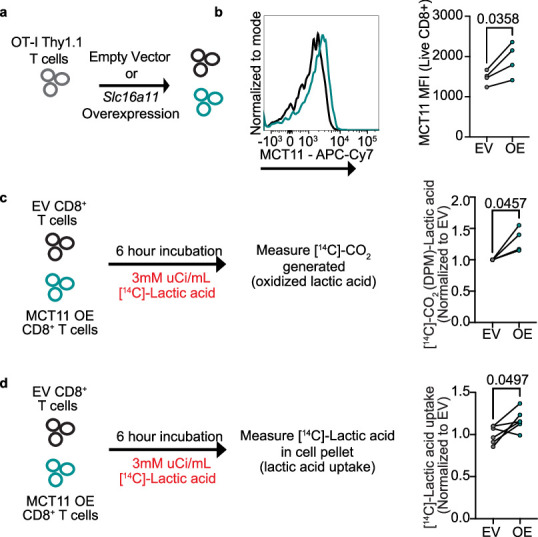
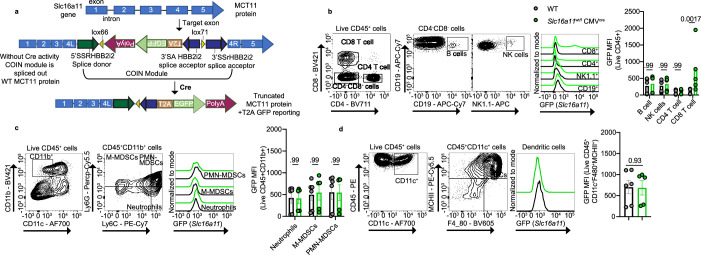
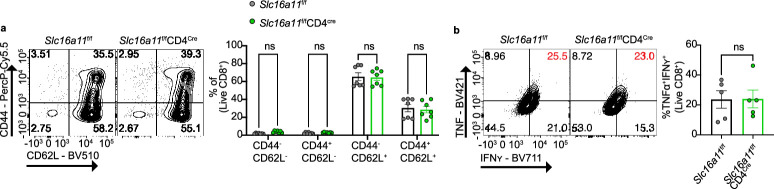
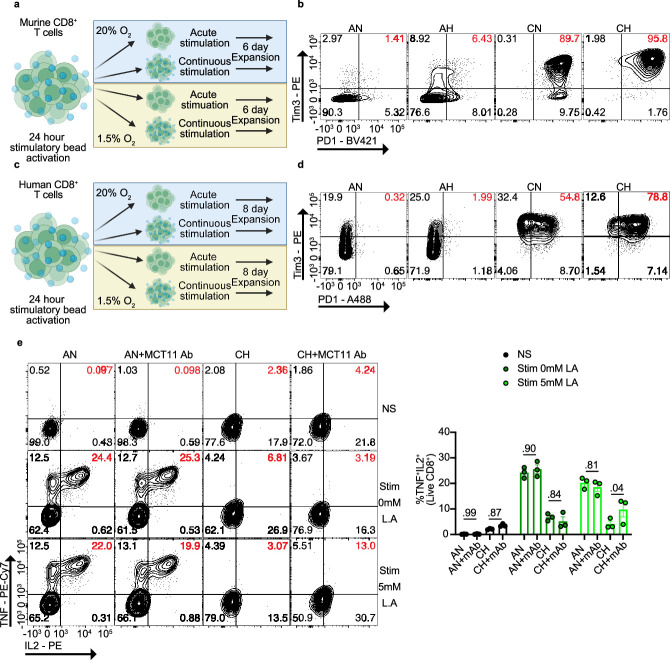
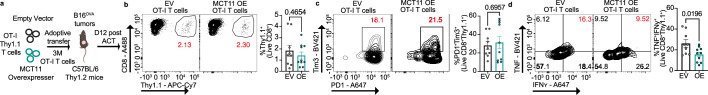
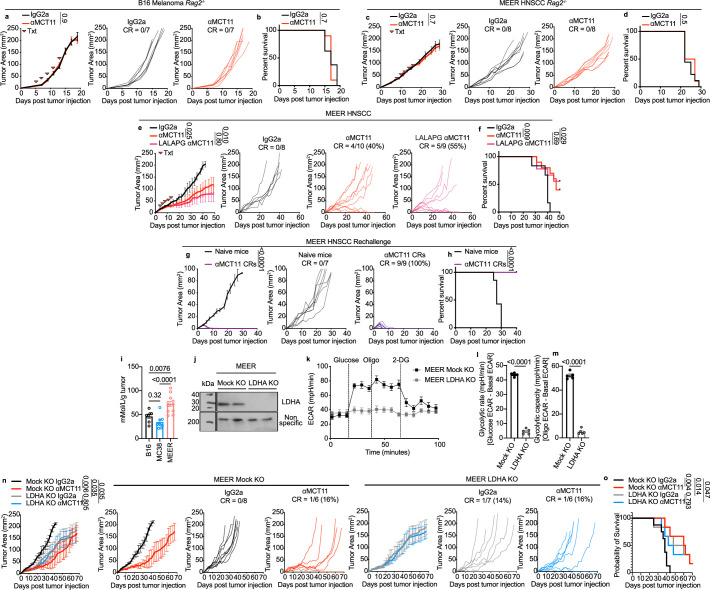
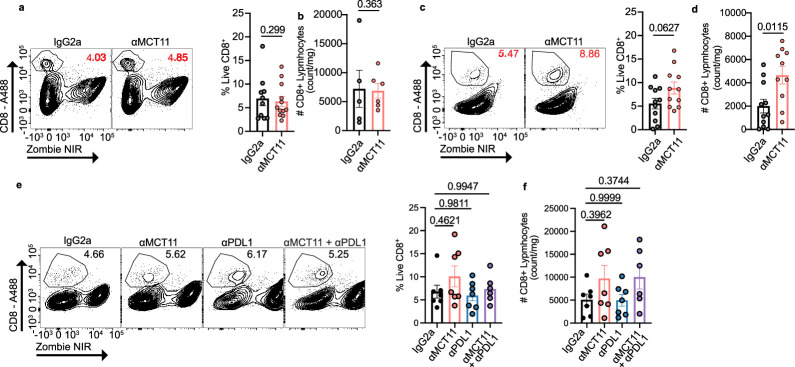
CD8+ T cells are critical mediators of antitumor immunity but differentiate into a dysfunctional state, known as T cell exhaustion, after persistent T cell receptor stimulation in the tumor microenvironment (TME). Exhausted T (Tex) cells are characterized by upregulation of coinhibitory molecules and reduced polyfunctionality. T cells in the TME experience an immunosuppressive metabolic environment via reduced levels of nutrients and oxygen and a buildup of lactic acid. Here we show that terminally Tex cells uniquely upregulate Slc16a11, which encodes monocarboxylate transporter 11 (MCT11). Conditional deletion of MCT11 in T cells reduced lactic acid uptake by Tex cells and improved their effector function. Targeting MCT11 with an antibody reduced lactate uptake specifically in Tex cells, which, when used therapeutically in tumor-bearing mice, resulted in reduced tumor growth. These data support a model in which Tex cells upregulate MCT11, rendering them sensitive to lactic acid present at high levels in the TME.


Conflict of interest statement

Competing interests: G.M.D. and R.M.P. declare competing financial interests and have submitted patents (US patents: 63/223,473 and 63/223,453) for antibody targeting of MCT11 expressing Tex cells that and are entitled to a share in net income generated from licensing of these patent rights for commercial development. G.M.D. consults for and/or is on the scientific advisory board of BlueSphere Bio, Century Therapeutics, Nanna Therapeutics, Novasenta, Pieris Pharmaceuticals and Western Oncolytics/Kalivir and has grants from bluebird bio, Novasenta, Pfizer, Pieris Pharmaceuticals, TCR2 and Western Oncolytics/Kalivir. G.M.D. owns stock in Novasenta, BlueSphere Bio and RemplirBio. The other authors declare no competing interests.

Figures

Fig. 1
Fig. 1. MCT11 expression enables lactic acid metabolism in Tex cells.
a, SLC superfamily gene expression from bulk RNA-seq in splenic OT-I T cells responding to vacciniaOVA, tumor dLN naive CD8+ T cells and B16-infiltrating Tpex (PD1intTim3-Slamf6hiTOXint) and Tex (PD1hiTim3+Slamf6loTOXhi) CD8+ T cells. b, Slc16 family gene transcripts per million in CD8+ T cell groups. c, A total of 250,000 B16, MC38 or MEER cells were intradermally implanted on C57BL/6 mice. df, A representative histogram and geometric mean fluorescence intensity (gMFI) quantification of MCT11 surface expression from ex vivo CD8+ T cells collected from day 14. df, B16 melanoma (n = 8) (d), MC38 colorectal cancer (n = 10) (e) and day 21 MEER HNSCC-bearing mice (n = 11) (f). g, Slc16a11 expression from single-cell sequencing in CD8+ T cell populations in human PBMC- and HNSCC-infiltrating CD8+ T cells,. h,i, Representative histogram and quantification of MCT11 expression in CD8+ TIL from human HNSCC (n = 4) (h) and melanoma (n = 4) (i). j, Experimental outline of [14C]-lactic acid oxidation, where 25,000 B16 dLN CD8+ T cells and tumor-infiltrating Tpex and Tex cells were sorted by fluorescence activated cell sorting (FACS) and cultured for 6 h in [14C]-lactic acid to measure the amount converted to [14C]-CO2. k, [14C]-lactic acid oxidation converted to [14C]-CO2 in disintegrations per minute (dpm) in dLN CD8+ T cells and tumor-infiltrating Tpex and Tex cells (n = 7). Slc16a11f/fCD4cre (n = 8) and Slc16a11f/f littermate controls (n = 8) were implanted with B16 and sacrificed on day 14. l, Representative flow cytometry plots and quantification of MCT11 (via GFP expression) in Tpex, PD1hi and Tex T cell populations in Slc16a11f/fCD4cre (n = 8) and Slc16a11f/f mice (n = 8). m, A representative histogram and mean fluorescence intensity (MFI) quantification of MCT11 in Tex cells from Slc16a11f/fCD4cre (n = 13) and Slc16a11f/f mice (n = 10). n, [14C]-lactic acid oxidation in dLN CD8+ T cells and B16-infiltrating Tpex and Tex cells from Slc16a11f/fCD4cre (n = 3) and Slc16a11f/f (n = 3) mice. The data represent three independent experiments for df, l and n and four for h, i, k and m. The error bars indicate the mean ± the standard error of the mean. The statistical analysis was performed by a one-way ANOVA with Tukey’s multiple comparisons test for df and k, paired two-tailed Student’s t-tests for h and i, two-way ANOVA with Šidák’s multiple comparison for l and n or unpaired two-tailed Student’s t-tests for m. Panels c and j were created with BioRender.com. Source data
Fig. 2
Fig. 2. MCT11 expression is driven by continuous TCR stimulation.
a, ATAC sequencing of the Slc16a11 locus in Tpex and Tex cells responding to B16-F10 (ref. ). bf, CUT&RUN of H3K4me3 (b), H3K9ac (c), H3K27ac (d), BATF (e) and Tox (f) at the Slc16a11 locus in B16 melanoma-infiltrating Tpex and Tex cells. g, C57BL/6 mice were intravenously (IV) infected with 2 × 106 PFU of LCMV C13 or intradermally (ID) implanted with 250,000 B16 melanoma cells. A total of 14 days later, LN, spleen, BM, liver, lung and kidney were collected from LCMV C13-infected mice, and the tumors were collected from B16 melanoma-bearing mice. h, A representative histogram and quantification of MCT11 surface expression from ex vivo Tex cells isolated from B16 melanoma-bearing mice (n = 4) or tissues from LCMV C13-infected mice (n = 4). i, Hypoxia experienced by D14 B16 melanoma-infiltrating CD8+ T cells expressing surface MCT11 (n = 7). j, A representative histogram and quantification of MCT11 surface expression in murine CD8+ T cells cultured under acute stim (A, 1:1 stimulatory beads to T cell ratio for 24 h) and normoxia (N, 20% O2), A and hypoxia (H, 1.5% O2), continuous stim (C, 10:1 stimulatory beads to T cell ratio for 6 days) and N, or C and H (n = 4). k, A representative histogram and quantification of MCT11 surface expression of human CD8+ T cells cultured under the previously described conditions (n = 4). l, A representative histogram and quantification of MCT11 expression on CD8+ from WT (n = 3) and Hif1αf/fCD4Cre (n = 3) mice cultured in C + H. The data represent two independent experiments for h and three for il. The error bars indicate the mean ± the standard error of the mean. The statistical analysis was performed by a repeated measures one-way ANOVA with Dunnet’s multiple comparison for h, one-way ANOVA with Tukey’s multiple comparison for ik or two-way ANOVA with Šidák’s multiple comparison for l. MFI, mean fluorescence intensity. Panel g was created with BioRender.com. Source data
Fig. 3
Fig. 3. MCT11 enforces dysfunction in Tex cells.
a, Slc16a11f/fCD4cre (Cre+) and littermate Slc16a11f/f (Cre) controls were injected with 250,000 B16 melanoma and sacrificed on day 14 for tumor collection and flow cytometry analysis. b,c, Representative flow cytometry plots and quantification of percentage (b) and total counts of live CD8+ T cells infiltrating B16 tumors (c) in Cre (n = 11) and Cre+ mice (n = 11). d, A representative flow cytometry plot and quantification of PD1 and Tim3 populations in ex vivo B16 melanoma-infiltrating CD8+ T cells in Cre (n = 12) and Cre+ mice (n = 13). e, A representative flow cytometry plot and quantification of Tex cells in PD1+MCT11+ and PD1+GFP+ T cells from Cre (n = 10) and Cre+ (n = 13) mice, respectively. f,g, Representative histograms and quantification of Tim3 (f) and PD1 MFI (g) in PD1+MCT11+ and PD1+GFP+ T cells from Cre (n = 10) and Cre+ (n = 13) mice, respectively. h,i, A representative flow cytometry plot and quantification of TNF and IFNʏ (h) and IL-2 (i) in B16-infiltrating Tex cells from Cre (n = 8) and Cre+ mice (n = 8) after 6 h of stimulation with αCD3 (3 μg ml−1) and αCD28 (2 μg ml−1). j, A representative cytogram and quantification of hypoxyprobe in Tpex and Tex cells from Cre and Cre+ mice. k, Heat map of differentially expressed genes between Tex cells from B16 tumors on Cre+ and WT mice. l, A gene set enrichment analysis of selected immunologic signature and hallmark gene sets in Cre+ Tex cells over WT Tex cells. A multiple comparisons correction was performed using the Benjamini–Hochberg method. m, Cre+ and Cre mice were intradermally (ID) implanted with 100,000 tumor cells and treated (txt) on days 7, 9 and 11 with αPD1 or isotype control mAb. n,o, Tumor growth with complete responses (CR) (n) and survival curve (o) of B16 melanoma on Cre and Cre+ mice. The data represent three independent experiments. The error bars indicate the mean ± the standard error of the mean. The statistical analysis was performed by unpaired two-tailed Student’s t-tests for b, c and ei, by a two-way ANOVA with Tukey’s multiple comparison for d, j and n or by a log rank Mendel–Cox test for o. Panels a and m were created with BioRender.com. Source data
Fig. 4
Fig. 4. MCT11 antibody blockade reduces tumor burden in mice.
a, Tex cells were sorted from B16 melanoma tumors and cultured at 25,000 cells per well in the presence of 20 μg ml−1 of IgG2a or αMCT11 for 1 h before the addition of 3 mM [14C]-lactic acid for 6 h (assay total, 7 h). b, Ex vivo [14C]-lactic acid oxidation in tumor-infiltrating Tex cells in the presence of αMCT11 or isotype control (n = 8). c, An experimental outline for tumor growth curves with tumor cell lines, where mice were injected with 250,000 tumor cells intradermally (ID) and treated (txt) with αMCT11 or isotype control (200 μg per dose, five doses total) after day 5 of tumor growth. dg, The tumor growth curves and survival curves of B16 (d and e, respectively) and MEER-bearing C57BL/6 (f and g, respectively) mice treated with αMCT11 therapy. h,i, Tumor growth (h) and survival (i) curve of mice injected ID with 250,000 MC38 cells and treated with isotype control, αMCT11, αPD1 or combination therapy (200 μg per dose, five doses total). j, A tumor growth curve of CD19-A549-bearing NSG mice adoptively transferred with untransduced T cells (UDT) or CD19-targetting CAR-T cells treated with αMCT11 or isotype control (200 μg per dose, 12 doses total). The data represent two independent experiments for j, three for di or four for b. The error bars indicate the mean ± the standard error of the mean. The statistical analysis was performed by a paired two-tailed Student’s t-test for b, by a two-way ANOVA with Tukey’s multiple comparison for d, f, h and j or by a log rank Mendel–Cox test for e, g and i. Panels a and c were created with BioRender.com. Source data
Fig. 5
Fig. 5. MCT11 therapy selectively enhances the polyfunctionality of Tex cells.
a, A total of 250,000 tumor cells were intradermally implanted into C57BL/6 mice and treated for three consecutive days with 200 µg per dose of αMCT11 or isotype control before sacrifice. b, A representative flow cytometry plot and quantification of Tpex and Tex populations in B16 when treated with isotype control (n = 6) or αMCT11 (n = 7). c, A representative flow cytometry plot and quantification of TNF and IFNʏ in B16 Tpex and Tex cells after 5 h of stimulus with αCD3 (3 µg ml−1) and αCD28 (2 µg ml−1) (isotype, n = 6; αMCT11, n = 7). d, A representative flow cytometry plot and quantification of PD1 and Tim3 populations staining in MEER-infiltrating Tpex and Tex cells after antibody treatment (both groups, n = 11). e, A representative flow cytometry and quantification of TNF and IFNʏ in MEER-infiltrating Tpex and Tex cells after 5 h of stimulus with αCD3 (3 µg ml−1) and αCD28 (2 µg ml−1) (both groups, n = 11). f, A representative histogram and quantification of hypoxyprobe in Tpex and Tex cells from MEER tumors after antibody treatment (isotype, n = 10; αMCT11, n = 10). g, A representative flow cytometry plot and quantification of PD1 and Tim3 populations staining in MC38-infiltrating CD8+ T cells after antibody treatment (isotype, n = 7; αMCT11, n = 7; αPD1, n = 7; combo, n = 6). h, A representative cytogram and quantification of TNF and IFNʏ in MC38-infiltrating Tpex and Tex cells after 5 h of stimulus with αCD3 (3 µg ml−1) and αCD28 (2 µg ml−1) (isotype, n = 7; αMCT11, n = 7; αPD1, n = 7; combo, n = 6). The data represent three independent experiments. The error bars indicate the mean ± the standard error of the mean. The statistical analysis was performed by a two-way ANOVA with Šidák’s multiple comparison for bf or by a two-way ANOVA with Dunnett’s multiple comparison test for g and h. Panel a was created with BioRender.com. Source data
Extended Data Fig. 1
Extended Data Fig. 1. Gating strategy in mouse model and human samples.
Gating strategy from total sample to live CD8+PD1+Tim3+ T cells from a) dLN and b) B16 tumors. Gating strategy from total sample to live CD8+gp33tet+PD1+Tim3+ T cells from murine LCMV C13 infected c) LNs, d) spleen, e) bone marrow, f) kidney, g) liver and h) lung. Gating strategy from total sample to live CD8+ T cells in i) human HNNSC and j) melanoma.
Extended Data Fig. 2
Extended Data Fig. 2. Terminally exhausted T cells differentially express solute carriers.
a) Representative flow cytometry plot of PD1 and Tim3 expression on CD8+ T cells in day 14 B16 tumors and dLNs. b) Volcano plot of differentially expressed genes in progenitor vs terminally exhausted T cells. c) Representative histogram and quantification of Slamf6 expression in B16 dLN CD8+ T cells, and B16 tumor infiltrating Tpex and Tex (n = 8 for all groups). d) Representative histogram and quantification of Tox expression in B16 dLN CD8+ T cells (n = 4), and B16 tumor infiltrating Tpex (n = 4) and Tex cells (n = 4). e) Representative histogram and quantification of CD147 expression in dLN CD8+ (n = 3), and B16 tumor infiltrating Tpex (n = 9) and Tex cells (n = 9). f) Representative histogram and quantification of hypoxyprobe staining in B16 dLN CD8+ T cells (n = 3), and B16 tumor infiltrating Tpex (n = 3) and Tex cells (n = 3). g) Expression of SLC16A11 from single cell analysis in human effector and Tex cells in various human tumors. Data represent one (d,f) or two (c,e) independent experiments. Error bars indicate +/− standard error of mean (SEM). Statistical analysis performed by one way analysis of variance (ANOVA) with Tukey’s multiple comparisons test (c-f). Source data
Extended Data Fig. 3
Extended Data Fig. 3. MCT11 overexpression increases lactic acid metabolism in CD8 + T cells.
a) OT-I T cells were retrovirally transduced with an MCT11 overexpression vector. b) Representative histogram and quantification of MCT11 expression in OT-I T cells transduced with EV control plasmid (n = 4) or an MCT11 overexpression plasmid (n = 4). c) Experimental outline and quantification of [14C]-Lactic acid oxidation experiment in EV (n = 4) or MCT11 OE T cells (n = 4). d) Experimental outline and quantification of [14C]-Lactic acid uptake experiment in EV (n = 6) or MCT11 OE T cells (n = 6). Data represent four independent experiments. Error bars indicate +/− SEM. Statistical analysis performed by paired two-tailed Student’s T tests (b-d). Source data
Extended Data Fig. 4
Extended Data Fig. 4. MCT11 expression is confined to exhausted T cells among tumor infiltrating immune populations.
a) Cartoon of Slc16a11 exons in WT and Slc16a11f/f mice where Cre expression leads to the transcription of a truncated MCT11 protein with simultaneous GFP expression. b) Representative flow cytometry plot, histogram and quantification of MCT11 (via GFP reporter expression) in CD8, CD4, NK and B cells infiltrating B16 tumors on WT (n = 6) and Slc16a11wt/fCMVcre (n = 5) mice. c) Representative flow cytometry plot, histogram and quantification of MCT11 (via GFP reporter expression) in B16 infiltrating monocytes on WT (n = 6) and Slc16a11wt/fCMVcre (n = 5) mice. d) Representative flow cytometry plot, histogram and quantification of MCT11 (via GFP reporter expression) in B16 infiltrating dendritic cells on WT (n = 6) and Slc16a11wt/fCMVcre (n = 5) mice. Data represent two independent experiments. Error bars indicate +/− SEM. Statistical analysis performed by two-way ANOVA with Sidak’s multiple comparisons test (b-c) or by unpaired two-tailed Student’s T tests (d). Source data
Extended Data Fig. 5
Extended Data Fig. 5. CD8+ T cells from Slc16a11f/fCD4Cre mice have no developmental or functional differences until they become exhausted.
a) Representative flow cytometry plot and quantification of CD44 and CD62L populations in CD8+ T cells isolated from LNs of 10-week-old Slc16a11f/f (n = 7) and Slc16a11f/fCD4Cre mice (n = 7) b) Representative cytogram and quantification of TNF and IFNʏ populations in CD8 + T cells isolated from LNs of Slc16a11f/fCD4Cre (n = 5) mice and littermate controls (n = 5). Data represent two independent experiments. Error bars indicate +/− SEM. Statistical analysis performed by two -way ANOVA with Sidak’s multiple comparisons (a) or by unpaired two-tailed Student’s T tests (b). Source data
Extended Data Fig. 6
Extended Data Fig. 6. Continuous stimulation under hypoxia drives an exhaustion-like state.
a) Murine CD8+ T cells were activated with CD3/CD28 stimulatory beads at a 1:1 ratio for 24 hours, and then expanded for 6 days w/out beads or at a 10:1 (B:T) ratio in 20% O2 or %1.5 O2. b) Flow cytometry plot of PD1 and Tim3 expression in murine CD8+ T cells after 6 days in culture under acute stimulation (A) and normoxia (N), A and hypoxia (H),continuous stimulation (C) and N, or C and H. c) Human CD8 + T cells were activated with CD3/CD28 stimulatory beads at a 1:1 ratio for 24 hours, and then expanded for 8 days without beads or at a 10:1 (B:T) ratio in 20% O2 or %1.5 O2. d) Flow cytometry plots of PD1 and Tim3 expression in human CD8+ T cells after 8 days in culture in the described conditions. e) Representative flow cytometry plot and tabulation of the percent of cells producing TNF and IL2, when stimulated for 5 hours with αCD3 (3 µg/mL) and αCD28 (2 µg/mL) in the presence of 5 mM lactic acid +/− MCT11 antibody (40 µg/mL) (n = 3 for all samples). Data represent one experiment. Error bars indicate +/− SEM. Statistical analysis performed by two-way ANOVA with Tukey’s multiple comparison (e). (a) Created in BioRender. Peralta, R. (2023) BioRender.com/r15f775. Source data
Extended Data Fig. 7
Extended Data Fig. 7. MCT11 overexpression accelerates T cell dysfunction in the TME.
a) OT-I Thy1.1 T cells were retrovirally transduced with an MCT11 overexpression vector (OE) or control empty vector (EV), and 3 million T cells were adoptively transferred into day 7 B16OVA bearing C57BL/6 Thy1.2 mice. b) Representative flow plot and quantification of percentage of CD8+Thy1.1+ transduced with EV (n = 9) or OE (n = 10) (transferred OT-Is) infiltrating B16OVA tumors. c) Representative flow plot and quantification of PD1+Tim3+ population in adoptively transferred EV (n = 9) or OE (n = 10) OT-I T cells. d) Representative flow plot and quantification of TNF+IFNʏ+ population in adoptively transferred EV (n = 9) or OE (n = 10) T cells. Data represent three independent experiments. Error bars indicate +/− SEM. Statistical analysis performed by unpaired two-tailed Student’s T tests (b-d). (a) Created in BioRender. Peralta, R. (2024) BioRender.com/k52v484. Source data
Extended Data Fig. 8
Extended Data Fig. 8. αMCT11 therapy requires T cells and is driven by lactate metabolism in cancer.
Tumor growth curve and b) survival curve of B16 bearing Rag2-/- mice treated with isotype control (n = 7) or αMCT11 (n = 7). c) Tumor growth curve and d) survival curve of MEER bearing Rag2−/− mice treated with isotype control (n = 8) or αMCT11 (n = 8. e) Tumor growth and f) survival curve of MEER bearing mice treated with isotype control (n = 8), αMCT11 (n = 10) or LALAPG αMCT11 (n = 9). g) MEER tumor growth and h) survival curve of naïve mice (n = 7) and mice rechallenged 1 month after complete responses to MCT11 therapy (n = 9). i) Lactate concentrations in TIF of B16 (n = 7), MC38 (n = 8) and MEER (n = 11) tumors. j) Immunoblot of LDHA in mock KO and LDHA KO MEER tumor cells (one experiment). k) Extracellular acidification rate plot, l) glycolytic rate and m) glycolytic capacity in mock KO (n = 5) and LDHA KO MEER (n = 5) tumor cells. (n) Tumor growth and o) survival curves of mice injected I.D. with 250 K mock KO or LDHA KO MEER cells and treated with isotype control or αMCT11 (200 μg/dose; 5 doses total). Data represent one (g-h,j), two (a-f,k-o) or three (i) independent experiments. Error bars indicate +/− SEM. Statistical analysis performed by paired two-tailed Student’s T tests (l-m), one way ANOVA with Tukey’s multiple comparisons (i), Two-way ANOVA with Tukey’s multiple comparisons (a,c,e,g,n), or by Log Rank Mendel Cox Test (b,d,f,h,o). Source data
Extended Data Fig. 9
Extended Data Fig. 9. Effects of MCT11 therapy on total CD8 + T cells in tumors.
a) Representative flow cytometry plot and quantification of percentage of live CD8+ T cells infiltrating B16 when treated with isotype (n = 11) or αMCT11 (n = 12). b) Total counts of CD8+ T cells infiltrating B16 when treated with isotype (n = 5) or αMCT11 (n = 6). c) Representative flow cytometry plot and quantification of percentage and d) total counts of live CD8+ T cells infiltrating MEER when treated with isotype control (n = 11) or αMCT11 (n = 11). e) Representative flow cytometry plot and quantification of percentage and f) total counts of live CD8+ T cells infiltrating MC38 when treated with isotype control (n = 7), αMCT11 (n = 7), αPD1 (n = 7) or αMCT11 + αPD1 (n = 6). Data represent two (a-b), or three (c-f) independent experiments. Error bars indicate +/− SEM. Statistical analysis performed by unpaired two-tailed Student’s T tests (a-b) or by one-way ANOVA with Tukey’s multiple comparison (c-f). Source data

References

    1. Zhang, N. & Bevan, J. Michael. CD8+ T cells: foot soldiers of the immune system. Immunity35, 161–168 (2011). - PMC - PubMed
    1. Ando, M., Ito, M., Srirat, T., Kondo, T. & Yoshimura, A. Memory T cell, exhaustion, and tumor immunity. Immunol. Med.43, 1–9 (2020). - PubMed
    1. Mclane, L. M., Abdel-Hakeem, M. S. & Wherry, E. J. CD8 T cell exhaustion during chronic viral infection and cancer. Annu. Rev. Immunol.37, 457–495 (2019). - PubMed
    1. Miller, B. C. et al. Subsets of exhausted CD8+ T cells differentially mediate tumor control and respond to checkpoint blockade. Nat. Immunol.20, 326–336 (2019). - PMC - PubMed
    1. Siddiqui, I. et al. Intratumoral Tcf1+PD-1+CD8+ T cells with stem-like properties promote tumor control in response to vaccination and checkpoint blockade immunotherapy. Immunity50, 195–211.e110 (2019). - PubMed

Substances