. 2024 Nov 8;23(1):367.
doi: 10.1186/s12944-024-02333-4.

Association analysis of gut microbiota with LDL-C metabolism and microbial pathogenicity in colorectal cancer patients

Affiliations

Association analysis of gut microbiota with LDL-C metabolism and microbial pathogenicity in colorectal cancer patients

Mingjian Qin et al. Lipids Health Dis. .

Abstract

Background: Colorectal cancer (CRC) is the most common gastrointestinal malignancy worldwide, with obesity-induced lipid metabolism disorders playing a crucial role in its progression. A complex connection exists between gut microbiota and the development of intestinal tumors through the microbiota metabolite pathway. Metabolic disorders frequently alter the gut microbiome, impairing immune and cellular functions and hastening cancer progression.

Methods: This study thoroughly examined the gut microbiota through 16S rRNA sequencing of fecal samples from 181 CRC patients, integrating preoperative Low-density lipoprotein cholesterol (LDL-C) levels and RNA sequencing data. The study includes a comparison of microbial diversity, differential microbiological analysis, exploration of the associations between microbiota, tumor microenvironment immune cells, and immune genes, enrichment analysis of potential biological functions of microbe-related host genes, and the prediction of LDL-C status through microorganisms.

Results: The analysis revealed that differences in α and β diversity indices of intestinal microbiota in CRC patients were not statistically significant across different LDL-C metabolic states. Patients exhibited varying LDL-C metabolic conditions, leading to a bifurcation of their gut microbiota into two distinct clusters. Patients with LDL-C metabolic irregularities had higher concentrations of twelve gut microbiota, which were linked to various immune cells and immune-related genes, influencing tumor immunity. Under normal LDL-C metabolic conditions, the protective microorganism Anaerostipes_caccae was significantly negatively correlated with the GO Biological Process pathway involved in the negative regulation of the unfolded protein response in the endoplasmic reticulum. Both XGBoost and MLP models, developed using differential gut microbiota, could forecast LDL-C levels in CRC patients biologically.

Conclusions: The intestinal microbiota in CRC patients influences the LDL-C metabolic status. With elevated LDL-C levels, gut microbiota can regulate the function of immune cells and gene expression within the tumor microenvironment, affecting cancer-related pathways and promoting CRC progression. LDL-C and its associated gut microbiota could provide non-invasive markers for clinical evaluation and treatment of CRC patients.

Keywords: 16S rRNA; Clinical status; Colorectal cancer (CRC); Gut microbiota; LDL-C; Machine learning.


Conflict of interest statement

The authors declare no competing interests.

Figures
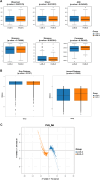
Fig. 1
Fig. 1
Comparison of gut microbiota diversity index between L-LDL-C group and H-LDL-C group patients with CRC. A Comparison of α-diversity index of gut microbiota between L-LDL-C group and H-LDL-C group in CRC patients. B Comparison of β-diversity index of gut microbiota between L-LDL-C group and H-LDL-C group in CRC patients. The horizontal axis represents the group, the vertical axis represents the diversity index value of the sample community within the group, and the color also represents the group. C PLS-DA analysis of gut microbiota in the L-LDL-C and H-LDL-C groups of CRC patients. The dots represent each sample of gut microbiota, the color represents the group, the horizontal and vertical axis scales represent the relative distance of each sample, and X variable 1 and X variable 2 represent the factors that affect the changes in gut microbiota composition of CRC patients in the L-LDL-C and H-LDL-C groups, respectively
Fig. 2
Fig. 2
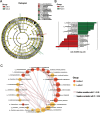
Analysis of differences in gut microbiota between L-LDL-C group and H-LDL-C group CRC patients. A Evolutionary relationship diagram of LEfSe analysis. The node size represents the species abundance and is directly proportional to the species abundance. Node color represents grouping, and yellow nodes in branches represent species with no significant differences in abundance between groups; the red nodes represent species with significantly higher abundance in the L-LDL-C group, while the green nodes represent species with significantly higher abundance in the H-LDL-C group. Each layer node represents a phylum/class/order/family/genus/species from the inside out, and the annotations for each layer's species markers represent a phylum/class/order/family/genus/species from the outside in. B LDA bar chart based on 16S rRNA gene sequencing. The color of the bar chart represents the group, the horizontal coordinate represents the LDA score (after log10 processing), the vertical coordinate represents the species with significantly higher abundance in the group, and the length of the bar chart represents the size of the LDA score value. C LDL-C related differences in gut microbiota correlation network diagram. Each node represents each species, node color represents group, node size represents the number of edges connected to the node. The larger the node, the more edges connected to the node. The connecting line indicates a significant correlation between the two nodes. The blue line represents Spearman correlation coefficient values below 0 (negative correlation), while Spearman correlation coefficient values above 0 (positive correlation) are represented by the red line. The thicker the red line, the greater the Spearman correlation coefficient between two nodes
Fig. 3
Fig. 3
The correlation between LDL-C related gut microbiota and tumor immune infiltrating cells. A Bar chart of relative abundance of immune cells in CRC patients grouped by LDL-C status. Each bar represents a sample, and the vertical coordinates represent the predicted relative abundance values of immune cells. The sum of the relative abundances of all immune cells in a single sample is 1, and each color in the graph corresponds to one type of immune cell. B Heat map of the correlation between dominant microbial communities and immune cell abundance in the H-LDL-C group. C Heat map of the correlation between dominant microbial communities and immune cell abundance in the L-LDL-C group. The horizontal axis represents immune cells, and the vertical axis represents microbiota. In the figure, red represents positive correlation, blue represents negative correlation, color depth represents the magnitude of Pearson correlation coefficient, and color from light to dark represents the value of Pearson correlation coefficient from small to large. The “*” in the figure represents the size of the P-value: none * represents a P-value ≥ 0.05, * represents 0.01 ≤ P < 0.05, * * represents 0.001 ≤ P < 0.01, and * * * represents P < 0.001. D Network diagram showing the correlation between LDL-C related differential gut microbiota and immune cells. Each node represents each gut microbiota or immune cell and the connecting line represents a significant correlation between the two nodes; the blue line indicates that the Pearson correlation coefficient is less than 0 (negative correlation), while the red line indicates that the Pearson correlation coefficient is greater than 0 (positive correlation)
Fig. 4
Fig. 4
Correlation between LDL-C related differential gut microbiota and immune related genes. A Heat map of the correlation between dominant gut microbiota and immune checkpoints in the H-LDL-C group. B Heat map of the correlation between dominant gut microbiota and chemokines in the H-LDL-C group. C Heat map of the correlation between dominant gut microbiota and immune checkpoints in the L-LDL-C group. D Heat map of the correlation between dominant gut microbiota and chemokines in the L-LDL-C group. The horizontal axis represents genes and the vertical axis represents gut microbiota. In the figure, red represents positive correlation, blue represents negative correlation, color depth represents the magnitude of Pearson correlation coefficient, and color from light to dark represents the value of Pearson correlation coefficient from small to large. The “*” in the figure represents the size of the P-value: no * represents P-value ≥ 0.05, * represents 0.01 ≤ P < 0.05, * * represents 0.001 ≤ P < 0.01, and * * * represents P < 0.001
Fig. 5
Fig. 5
Identification of LDL-C related differential pathways and correlation between differential pathways and LDL-C related differential gut microbiota. A GO volcano plot of LDL-C related differential expression. B KEGG volcano map of LDL-C related differential expression. The horizontal coordinate represents log2 (fold change), and the further the point is from the center, the greater the differential fold; The vertical coordinate represents -log10 (P-value), and the closer to the top point, the more significant the difference in expression. Each point represents the detected differentially expressed genes, with red indicating upregulated genes, blue indicating downregulated genes, and gray indicating no differentially expressed genes. C Correlation diagram between LDL-C related differential BP, MF pathway and differential gut microbiota. The horizontal coordinate represents microbiota, and the vertical coordinate represents GO labels. In the figure, red represents positive correlation, blue represents negative correlation, color depth represents the magnitude of Spearman correlation coefficient, and color from light to dark represents Spearman correlation coefficient value from small to large. In the figure "×" symbol represents the P-value:  "×" represents P value ≥ 0.05, without "×"  represents P < 0.05
Fig. 6
Fig. 6
The effectiveness evaluation of MLP and XGB prediction models. A The confusion matrix of MLP in the training set. B The confusion matrix of the MLP model in the validation set. D The confusion matrix of the XGB model in the training set. E The confusion matrix of the XGB model in the validation set. The Y-axis represents the predicted results of the model, the X-axis represents the true situation, 1 represents correct prediction, 0 represents incorrect prediction, and the value in the box represents the number of samples. C ROC curves of MLP model training and validation sets. F ROC curves of XGB prediction model training and validation sets. The horizontal axis represents the false positive rate predicted by the model, the vertical axis represents the true positive rate predicted by the model, and the area under the curve represents the AUC value. The higher the AUC value, the higher the diagnostic performance of the model

References

    1. Sung H, Ferlay J, Siegel RL, Laversanne M, Soerjomataram I, Jemal A, Bray F. Global Cancer Statistics 2020: GLOBOCAN Estimates of Incidence and Mortality Worldwide for 36 Cancers in 185 Countries. CA Cancer J Clin. 2021;71(3):209–49. - PubMed
    1. Siegel RL, Miller KD, Goding Sauer A, Fedewa SA, Butterly LF, Anderson JC, Cercek A, Smith RA, Jemal A. Colorectal cancer statistics, 2020. CA Cancer J Clin. 2020;70(3):145–64. - PubMed
    1. Després JP, Lemieux I. Abdominal obesity and metabolic syndrome. Nature. 2006;444(7121):881–7. - PubMed
    1. Bankoski A, Harris TB, McClain JJ, Brychta RJ, Caserotti P, Chen KY, Berrigan D, Troiano RP, Koster A. Sedentary activity associated with metabolic syndrome independent of physical activity. Diabetes Care. 2011;34(2):497–503. - PMC - PubMed
    1. Chen H, Zheng X, Zong X, Li Z, Li N, Hur J, Fritz CD, Chapman W Jr, Nickel KB, Tipping A, Colditz GA, Giovannucci EL, Olsen MA, et al. Metabolic syndrome, metabolic comorbid conditions and risk of early-onset colorectal cancer. Gut. 2021;70(6):1147–54. - PMC - PubMed

LinkOut - more resources