. 2024 Nov 8;16(1):128.
doi: 10.1186/s13073-024-01403-7.

Exploring multi-omics and clinical characteristics linked to accelerated biological aging in Asian women of reproductive age: insights from the S-PRESTO study

Affiliations

Exploring multi-omics and clinical characteristics linked to accelerated biological aging in Asian women of reproductive age: insights from the S-PRESTO study

Li Chen et al. Genome Med. .

Abstract

Background: Phenotypic age (PhenoAge), a widely used marker of biological aging, has been shown to be a robust predictor of all-cause mortality and morbidity in different populations. Existing studies on biological aging have primarily focused on individual domains, resulting in a lack of a comprehensive understanding of the multi-systemic dysregulation that occurs in aging.

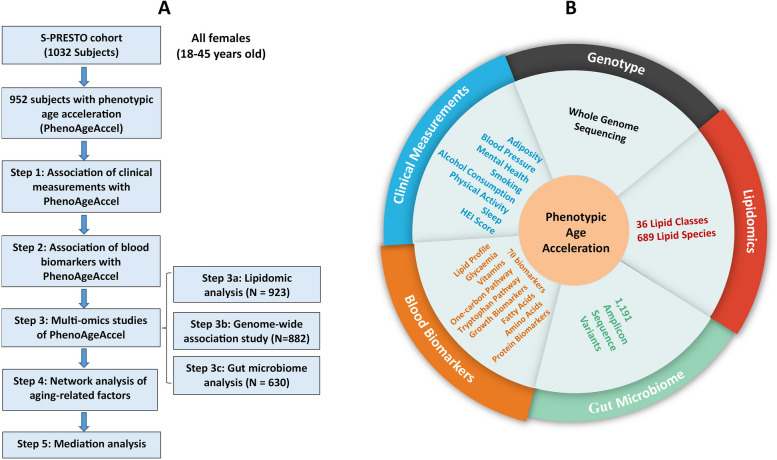
Methods: PhenoAge was evaluated based on a linear combination of chronological age (CA) and 9 clinical biomarkers in 952 multi-ethnic Asian women of reproductive age. Phenotypic age acceleration (PhenoAgeAccel), an aging biomarker, represents PhenoAge after adjusting for CA. This study conducts an in-depth association analysis of PhenoAgeAccel with clinical, nutritional, lipidomic, gut microbiome, and genetic factors.

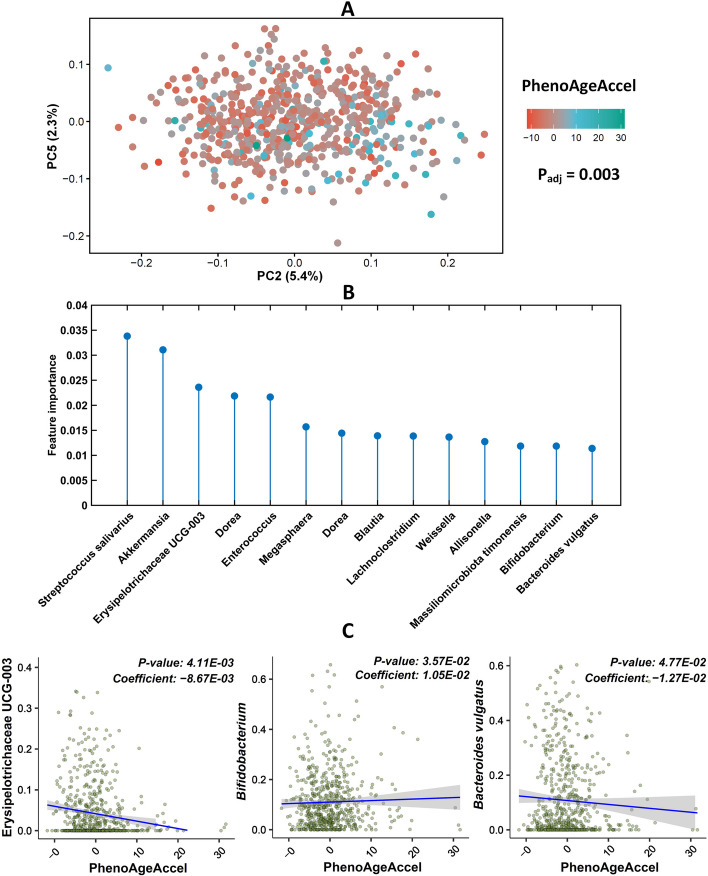
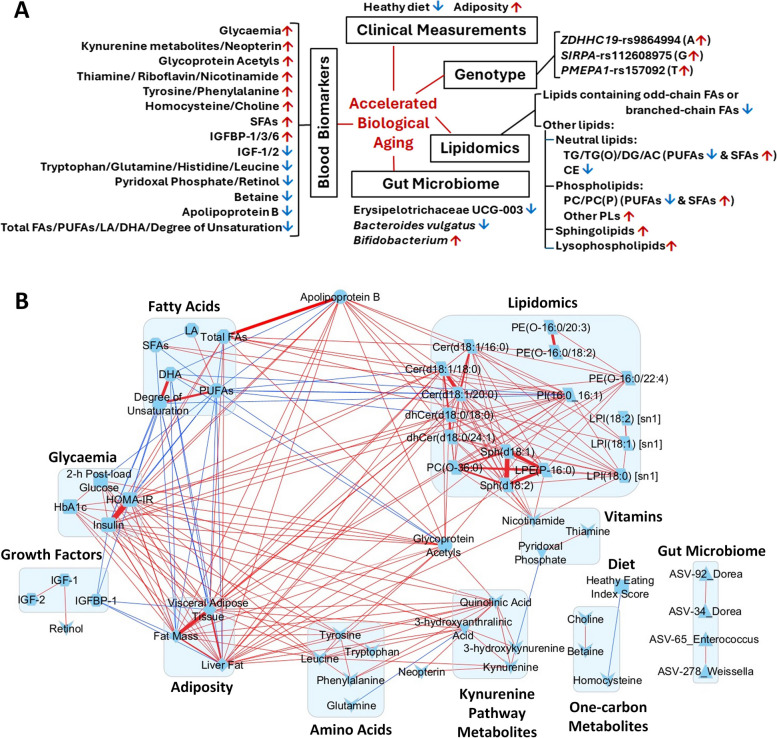
Results: Higher adiposity, glycaemia, plasma saturated fatty acids, kynurenine pathway metabolites, GlycA, riboflavin, nicotinamide, and insulin-like growth factor binding proteins were positively associated with PhenoAgeAccel. Conversely, a healthier diet and higher levels of pyridoxal phosphate, all-trans retinol, betaine, tryptophan, glutamine, histidine, apolipoprotein B, and insulin-like growth factors were inversely associated with PhenoAgeAccel. Lipidomic analysis found 132 lipid species linked to PhenoAgeAccel, with PC(O-36:0) showing the strongest positive association and CE(24:5) demonstrating the strongest inverse association. A genome-wide association study identified rs9864994 as the top genetic variant (P = 5.69E-07) from the ZDHHC19 gene. Gut microbiome analysis revealed that Erysipelotrichaceae UCG-003 and Bacteroides vulgatus were inversely associated with PhenoAgeAccel. Integrative network analysis of aging-related factors underscored the intricate links among clinical, nutritional and lipidomic variables, such as positive associations between kynurenine pathway metabolites, amino acids, adiposity, and insulin resistance. Furthermore, potential mediation effects of blood biomarkers related to inflammation, immune response, and nutritional and energy metabolism were observed in the associations of diet, adiposity, genetic variants, and gut microbial species with PhenoAgeAccel.

Conclusions: Our findings provide a comprehensive analysis of aging-related factors across multiple platforms, delineating their complex interconnections. This study is the first to report novel signatures in lipidomics, gut microbiome and blood biomarkers specifically associated with PhenoAgeAccel. These insights are invaluable in understanding the molecular and metabolic mechanisms underlying biological aging and shed light on potential interventions to mitigate accelerated biological aging by targeting modifiable factors.

Keywords: Age acceleration; Biological aging; GWAS; Gut microbiome; Lipidomics; PhenoAge.


Conflict of interest statement

The authors declare that they have no competing interests.

Figures

Fig. 1
Fig. 1
The phenotypic age acceleration (PhenoAgeAccel) study. A A flow chart of sample selection and analysis steps. B A diagram illustrating the investigation of PhenoAgeAccel through the integration of clinical measurements, blood biomarkers and multi-omics
Fig. 2
Fig. 2
PhenoAgeAccel and its association results. A Phenotypic age vs. chronological age. B Histogram of PhenoAgeAccel. C-E Boxplots of ethnicity, educational attainment and parity with PhenoAgeAccel. F PhenoAgeAccel vs. BMI. Effect size plot of 40 aging-related factors derived from multivariate analysis of clinical measurements and blood biomarkers with a nominal p-value < 0.05. *: Padj < 0.05
Fig. 3
Fig. 3
Lipidomics and GWAS results of PhenoAgeAccel. Forest plot of lipidomics results. Diamand: P ≥ 0.05, circle: P < 0.05 and square: Padj < 0.05. Full names of lipid classes are provided in Additional file 2: Table S3. Volcano plots of lipidomics results. Lipid species with Padj < 0.05 are labelled. Manhattan plot of the GWAS results. The top 3 mapped genes are labelled
Fig. 4
Fig. 4
Association between the gut microbiome and PhenoAgeAccel. Principal Coordinate Analysis of Unweighted UniFrac distance illustrating the gut microbiome of women with different PhenoAgeAccel. Padj was obtained using multi-way ADONIS permutation-based statistical test after adjusting for the effects of ethnicity, BMI, age, educational attainment and parity. The feature importance of the top 14 gut microbial species identified through nested cross-validated random forest regression. Three microbial species significantly associated with PhenoAgeAccel identified via MaAsLin2 analysis
Fig. 5
Fig. 5
Network visualization of accelerated biological aging and aging-related factors. A Schematic diagram summarizing the factors linked to accelerated biological aging. B Network visualization of aging-related factors using Cytoscape. Each connection has a Spearman’s rank correlation coefficient of ≥ 0.30. Red – positive correlation and blue – negative correlation. Line width – magnitude of coefficient. These factors are grouped by their properties, denoted as different shapes of nodes
Fig. 6
Fig. 6
Effects of mediators (blue squares) on the associations between predictors (green circles) and the outcome (PhenoAgeAccel). A Diet (heathy eating index score). B Adiposity (Fat mass, liver fat and visceral adipose tissue). C Gut microbial species (Erysipelotrichaceae UCG-003, Bacteroides vulgatus, and Bifidobacterium). D Genetic variants (ZDHHC19-rs9864994, SIRPA-rs112608975, and PMEPA1-rs157092). Age, ethnicity, educational attainment, parity and BMI were adjusted in analysis models. Each connection has a p-value of < 0.05 for average causal mediation effect (ACME), with a thicker line indicating an FDR of < 0.2

References

    1. Lopez-Otin C, Blasco MA, Partridge L, Serrano M, Kroemer G. Hallmarks of aging: an expanding universe. Cell. 2023;186(2):243–78. - PubMed
    1. DeVito LM, Barzilai N, Cuervo AM, Niedernhofer LJ, Milman S, Levine M, et al. Extending human healthspan and longevity: a symposium report. Ann N Y Acad Sci. 2022;1507(1):70–83. - PMC - PubMed
    1. Whitty CJM, Watt FM. Map clusters of diseases to tackle multimorbidity. Nature. 2020;579(7800):494–6. - PubMed
    1. Elliott ML, Caspi A, Houts RM, Ambler A, Broadbent JM, Hancox RJ, et al. Disparities in the pace of biological aging among midlife adults of the same chronological age have implications for future frailty risk and policy. Nat Aging. 2021;1(3):295–308. - PMC - PubMed
    1. Gladyshev VN. Aging: progressive decline in fitness due to the rising deleteriome adjusted by genetic, environmental, and stochastic processes. Aging Cell. 2016;15(4):594–602. - PMC - PubMed

LinkOut - more resources