. 2024 Nov 8;22(1):536.
doi: 10.1186/s12964-024-01924-z.

Cell damage shifts the microRNA content of small extracellular vesicles into a Toll-like receptor 7-activating cargo capable to propagate inflammation and immunity

Affiliations

Cell damage shifts the microRNA content of small extracellular vesicles into a Toll-like receptor 7-activating cargo capable to propagate inflammation and immunity

Valentina Salvi et al. Cell Commun Signal. .

Abstract

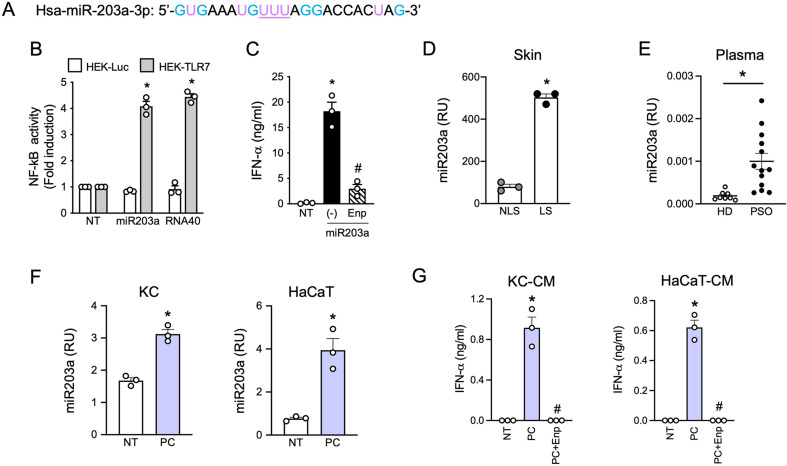
Background: The physiological relevance of cell-to-cell communication mediated by small extracellular vesicle-encapsulated microRNAs (sEV-miRNAs) remains debated because of the limiting representativity of specific miRNAs within the extracellular pool. We hypothesize that sEV-miRNA non-canonical function consisting of the stimulation of Toll-like receptor 7 (TLR7) may rely on a global shift of the sEV cargo rather than on the induction of one or few specific miRNAs. Psoriasis represents an ideal model to test such hypothesis as it is driven by overt activation of TLR7-expressing plasmacytoid dendritic cells (pDCs) following keratinocyte damage.

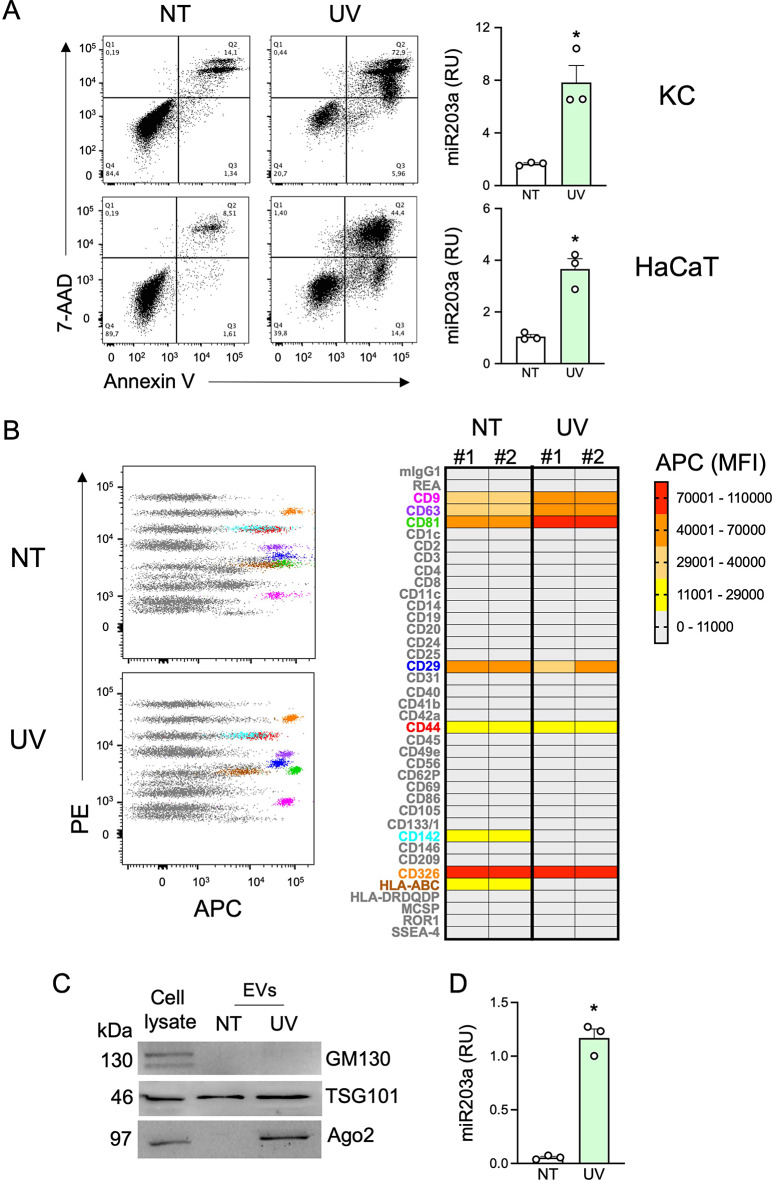
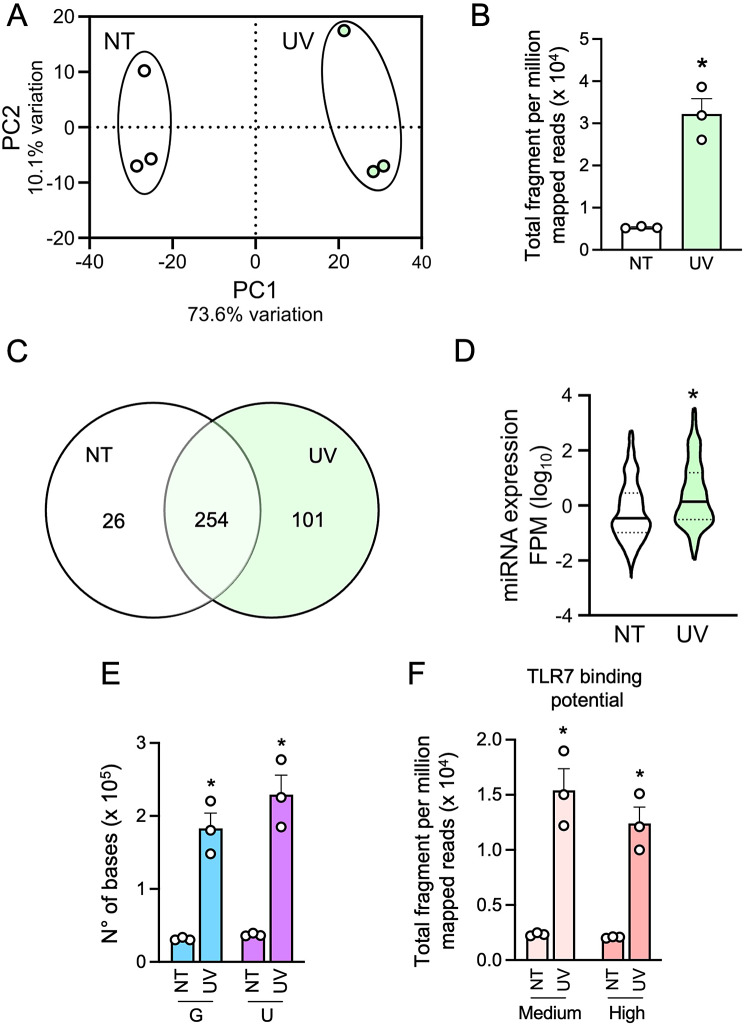
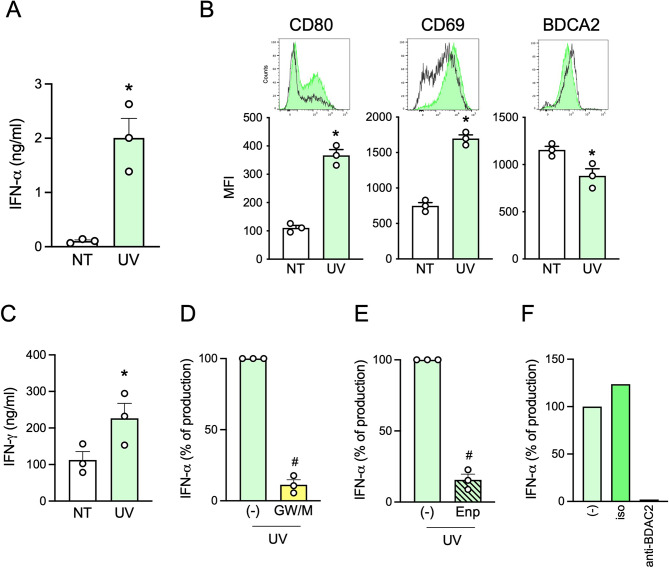
Methods: To mimic the onset of psoriasis, keratinocytes were treated with a cocktail of psoriatic cytokines or UV-irradiated. SmallRNA sequencing was performed on sEVs released by healthy and UV-treated keratinocytes. sEV-miRNAs were analyzed for nucleotide composition as well as for the presence of putative TLR7-binding triplets. Primary human pDCs where stimulated with sEVs +/- inhibitors of TLR7 (Enpatoran), of sEV release (GW4869 + manumycin) and of TLR7-mediated pDC activation (anti-BDCA-2 antibody). Secretion of type I IFNs and activation of CD8+T cells were used as readouts. qPCR on psoriatic and healthy skin biopsies was conducted to identify induced miRNAs.

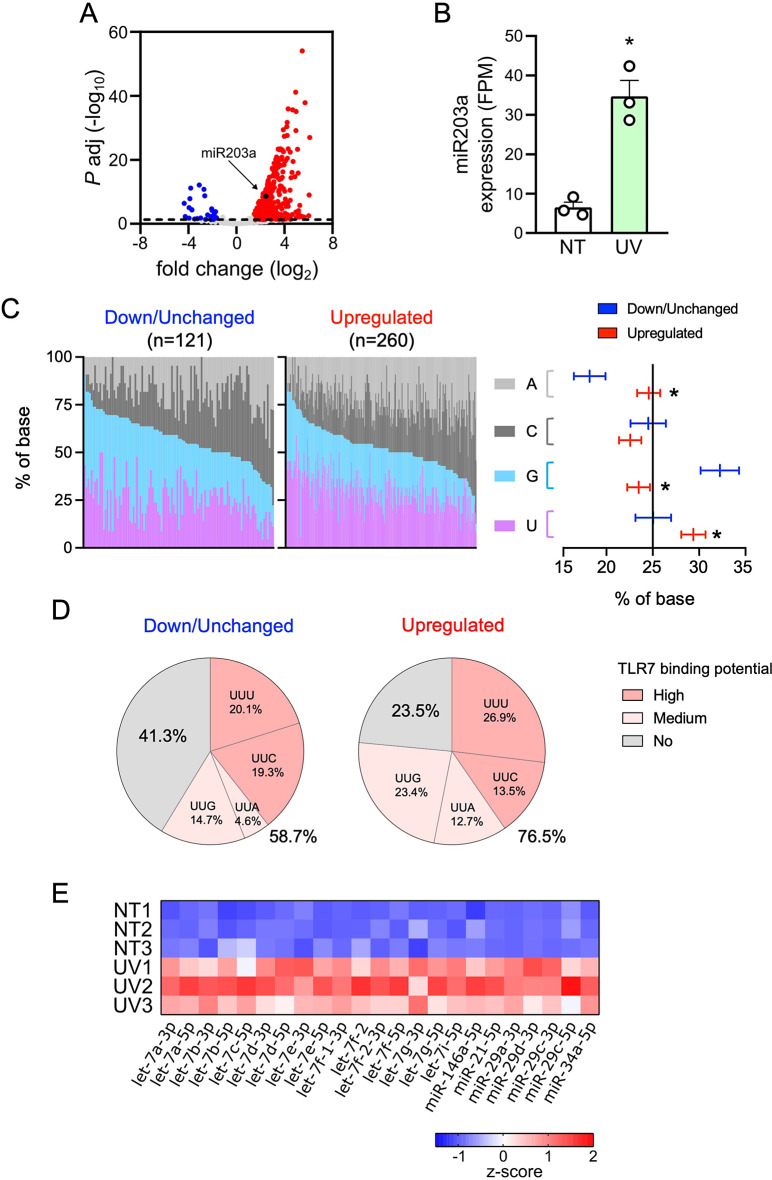
Results: sEV-miRNAs released by damaged keratinocytes revealed a significantly higher content of TLR7-activating sequences than healthy cells. As expected, differential expression analysis confirmed the presence of miRNAs upregulated in psoriatic skin, including miR203a. More importantly, 76.5% of induced miRNAs possessed TLR7-binding features and among these we could detect several previously demonstrated TLR7 ligands. In accordance with this in silico analysis, sEVs from damaged keratinocytes recapitulated key events of psoriatic pathogenesis by triggering pDCs to release type I interferon and activate cytotoxic CD8+T cells in a TLR7- and sEV-dependent manner.

Discussion: Our results demonstrate that miR203a is just one paradigmatic TLR7-activating miRNA among the hundreds released by UV-irradiated keratinocytes, which altogether trigger pDC activation in psoriatic conditions. This represents the first evidence that cell damage shifts the miRNA content of sEVs towards a TLR7-activating cargo capable to propagate inflammation and immunity, offering strong support to the physiological role of systemic miRNA-based cell-to-cell communication.

Keywords: Exosomes; Extracellular vesicles; IFN-α; IFN-γ; IL-6; Plasmacytoid dendritic cells (pDCs); Psoriasis; TNF-α; Toll-like receptor 7 (TLR7); hsa-miR203a-3p.


Conflict of interest statement

The authors declare no competing interests.

Figures

Fig. 1
Fig. 1
miR203a is upregulated in psoriatic patients and released by inflamed keratinocytes. (A) Sequence of synthetic hsa-miR203a-3p. G and U are highlighted in light blue and purple respectively while the TLR7 full binding motif “UUU” is underlined. (B) HEK293 cells stably transfected with a NF-kB reporter gene and human TLR7 or luciferase alone were stimulated with 10 µg/ml of miR203a or RNA40 for 24 h. NF-κB activation was evaluated in terms of luciferase activity (fold of induction) over unstimulated cells (NT). Data are expressed as mean ± SEM (n = 3); *P < 0.05 vs. “NT” by 1-way ANOVA with Dunnett’s post hoc test. (C) pDCs were pretreated or not with Enpatoran (Enp, 1 µM) for 1 h and then stimulated with miR203a for 24 h. IFN-α secretion was evaluated by ELISA (mean ± SEM, n = 3); *P < 0.05 vs. “NT” or #P < 0.05 vs. (-) by paired Student’s t test. (D) miR203a expression from paired non lesional (NL) and lesional (L) skin biopsies from 3 psoriatic patients was investigated by qPCR. Data are expressed as mean ± SEM of Relative Units (RU) compared to cel-miR39; *P < 0.05 vs. “NLS” by paired Student’s t test. (E) miR203a expression in the plasma of healthy donors (HD, n = 8) and psoriatic patients (PSO, n = 13) by qPCR; *P < 0.05 vs. “HD” by Mann-Whitney test. (F) Primary keratinocytes (KC) and HaCaT cells were stimulated with a mix of psoriatic cytokines (PC, each cytokine at 50 ng/ml) for 24 h and the expression of miR203a in the supernatant was assessed by qPCR (mean ± SEM, n = 3); *P < 0.05 vs. “NT” by paired Student’s t test. (G) pDCs were pretreated or not with Enpatoran for 1 h and then stimulated with conditioned media of KC or HaCaT (CM, 50% vol/vol). IFN-α production was evaluated by ELISA (mean ± SEM, n = 3); *P < 0.05 vs. “NT” or #P < 0.05 vs. (-) by paired Student’s t test
Fig. 2
Fig. 2
sEVs derived from conditioned media of UV-treated HaCaT cells are enriched in Ago2 protein. (A) KC and HaCaT cells were UV irradiated and cell death was investigated by flow cytometry (left panels). miR203a expression in cell-free supernatants was assessed by qPCR (right panels). Data are expressed as mean ± SEM of Relative Units (RU) compared to UniSp4 RNA; *P < 0.05 vs. “NT” by paired Student’s t test. (B) sEV surface proteins were analysed by multiplex bead-based flow cytometry. PE channel vs. APC-stained channel dot plots (B, left panels) display the signal of single bead types. The bead populations with the brightest staining are colored. (B, right panel) Heatmap of the Median Fluorescence Intensity (MFI) of the APC channel for all 39 bead populations after subtraction of background signal (medium alone) in 2 independent sEV preparations. Markers called present are highlighted with the same colors as in dot plots. (C) Western blot analysis was performed on HaCaT cell lysates (10 µg) or on equal volumes of NT-sEVs and UV-sEVs. One representative experiment out of 3 is shown. (D) miR203a expression in NT-sEVs or UV-sEVs was evaluated by qPCR. Data are expressed as mean ± SEM of Relative Units (RU) compared to UniSp4 RNA; *P < 0.05 vs. “NT” by paired Student’s t test
Fig. 3
Fig. 3
UV-sEVs contain more miRNAs as compared to NT-sEVs and display a higher TLR7-activating potential. (A) PCA scatterplot based on the variance stabilized counts of mature miRNAs identified in smallRNA-seq data of NT-sEVs (“NT”) and UV-sEVs (“UV”) (n = 3). (B) Total fragment per million mapped reads (FPM) in NT-sEVs and UV-sEVs. Data are expressed as mean ± SEM (n = 3); *P < 0.05 vs. “NT” by paired Student’s t test. (C) Venn diagram of number of miRNAs expressed in NT-sEVs and UV-sEVs as obtained from smallRNA-seq analysis. (D) Violin plot of the expression levels of miRNAs present either in NT-sEVs and UV-sEVs. For each miRNA the FPM value of 3 experiments was plotted. Data are shown as log10 (FPM). (E) G and U content was determined for each miRNA in NT-sEVs and UV-sEVs and adjusted for its expression (FPM). Data are expressed as mean ± SEM (n = 3); *P < 0.05 vs. “NT” by paired Student’s t test. (F) miRNAs were characterized as “high TLR7 binding” if containing at least one UUU/UUC triplet or “medium TLR7 binding” if containing at least one UUA/UUG triplet (medium binding potential) and represented with their respective levels of expression (FPM). Data are expressed as mean ± SEM (n = 3); *P < 0.05 vs. “NT” by paired Student’s t test
Fig. 4
Fig. 4
Most miRNAs are upregulated in UV-sEVs and are enriched in TLR7-activating moieties. (A) Volcano plot of differentially expressed miRNAs in NT-sEVs and UV-sEVs. For each miRNA, the log2 (fold change, x-axis) and the -log10 (adjusted p-value, y-axis) are shown. Dashed line shows the 0.05 boundary for adjusted p-value. Red dots: upregulated miRNAs (log2(fold change) > 1.5, adjusted p-value < 0.05; blue dots: downregulated miRNAs (log2(fold change) < -1.5, adjusted p-value < 0.05; grey dots: not differentially expressed miRNAs. Black dot highlights miR203a (B) miR203a expression levels in NT-sEVs (“NT”) and UV-sEVs (“UV”) as obtained from smallRNA-seq data. miR203a expression is reported as FPM (mean ± SEM, n = 3); *P < 0.05 vs. “NT” according to the Wald test implemented in DESeq2. (C, left panel) Base composition (%, colors as indicated in figure) of each down/unchanged or upregulated UV-sEV miRNA is represented. miRNAs were ordered based on decreasing contents of G + U. (C, right panel) Confidence level of the percentage of the base composition of down/unchanged or upregulated miRNAs is represented. Base proportions were modelled using a multinomial regression. Post-hoc contrasts p-values were adjusted using Holm procedure; *P < 0.05 vs. “NT”. (D) Pie charts representing the significantly different mean proportions of TLR7-binding miRNAs in down/unchanged or upregulated UV-sEVs. The distribution of TLR7 high, medium and no binding sequences between down/unchanged and upregulated was compared sing a multinomial logistic regression model and tested using a likelihood ratio test (LRT, p = 0.00055). (E) Heatmap of the modulation of miRNAs previously demonstrated to activate TLRs in UV-sEVs as compared to NT-sEVs. Data are shown as z-score transformed FPM
Fig. 5
Fig. 5
The miRNA cargo of UV-sEVs activates pDCs via TLR7. (A-B) pDCs were stimulated for 24 h with an equal volume (approximately 1010 sEVs) of NT-sEVs (“NT”) or UV-sEVs (“UV”). IFN-α production was evaluated by ELISA (A) while pDC maturation was assessed by flow cytometry (B). (A-B) Data are expressed as mean ± SEM (n = 3); *P < 0.05 vs. “NT” by paired Student’s t test. (C) sEV-activated pDCs were cocultured for 6 days with allogenic CD8+ T cells and the secretion of IFN-γ was evaluated by ELISA in cell-free supernatants. Data are expressed as mean ± SEM (n = 3); *P < 0.05 vs. “NT” by paired Student’s t test. (D) pDCs were stimulated for 24 h with UV-sEVs produced in the presence or absence of 10 µM GW4869 (GW) and 1 µM manumycin A (M). (E) pDCs were stimulated with UV-sEVs in the presence or absence of Enpatoran (Enp, 1 µM) for 24 h. (D-E) IFN-α production was assessed by ELISA. Data are expressed as mean ± SEM (n = 3) of the percentage of IFN-α production; #P < 0.05 vs. (-) by paired Student’s t test. (F) pDCs were pretreated for 1 h with an anti-BDCA2 monoclonal antibody or an isotype control (both at 1 µg/ml) and then stimulated with UV-sEVs. The production of IFN-α was evaluated by ELISA and represented as percentage of IFN-α production. One representative donor out of 2 is shown

References

    1. Medzhitov R, Preston-Hurlburt P, Janeway CA. A human homologue of the Drosophila toll protein signals activation of adaptive immunity. Nature. 1997;388:394–7. - PubMed
    1. Yu L, Wang L, Chen S. Endogenous toll-like receptor ligands and their biological significance. J Cell Mol Med. 2010;14:2592–603. - PMC - PubMed
    1. Shimizu T. Structural insights into ligand recognition and regulation of nucleic acid-sensing toll-like receptors. Curr Opin Struct Biol. 2017;47:52–9. - PubMed
    1. Gorden KB, Gorski KS, Gibson SJ, Kedl RM, Kieper WC, Qiu X, Tomai MA, Alkan SS, Vasilakos JP. Synthetic TLR agonists reveal functional differences between human TLR7 and TLR8. J Immunol. 2005;174:1259–68. - PubMed
    1. Zhang Z, Ohto U, Shibata T, Krayukhina E, Taoka M, Yamauchi Y, Tanji H, Isobe T, Uchiyama S, Miyake K, Shimizu T. Structural analysis reveals that toll-like receptor 7 is a dual receptor for Guanosine and single-stranded RNA. Immunity. 2016;45:737–48. - PubMed

LinkOut - more resources