. 2024 Oct 31;14(21):3132.
doi: 10.3390/ani14213132.

Scientometric Analysis: An Emerging Tool in Veterinary and Animal Scientific Research

Affiliations

Scientometric Analysis: An Emerging Tool in Veterinary and Animal Scientific Research

Georgia A Vaitsi et al. Animals (Basel). .

Abstract

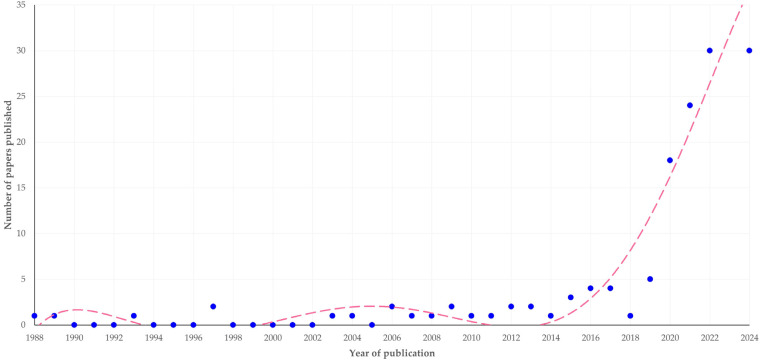
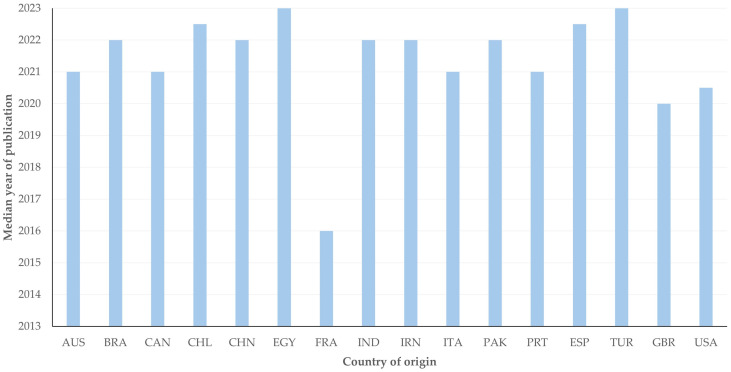
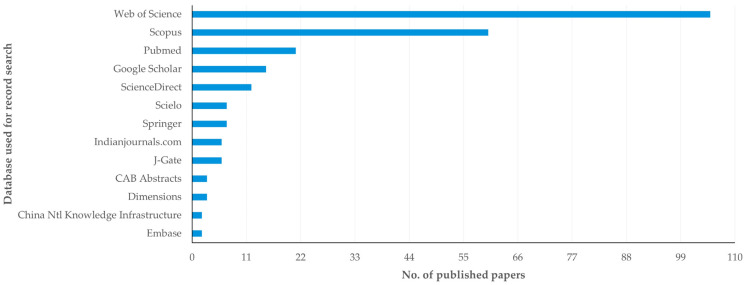
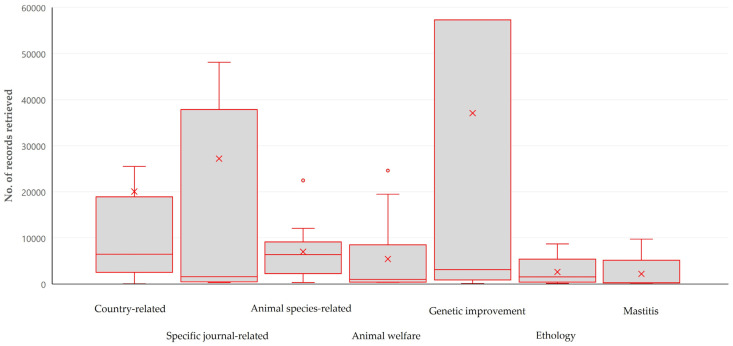
The present study is an evaluation of published papers in the field of scientometrics-bibliometrics in veterinary or animal studies. The objective was the quantitative evaluation of the scientific content and the bibliometric details of papers that had used scientometrics as a methodological approach to assess various topics within the broad field of veterinary or animal studies. For the search of published papers, the Web of Science database was used; the search string {ALL FIELDS = [scientometric* OR bibliometric*]} AND {ALL FIELDS = [veterinary OR animal*]} was employed. In all, 163 papers were evaluated individually. There was a progressive increase in the number of papers published annually (slope 0.314 ± 0.063) which originated from 58 countries, mostly from the United States of America (n = 24) and 306 organizations. The databases employed most frequently for record search were the Web of Science, Scopus and PubMed (in 105, 60 and 21 papers, respectively); the median timespan of the searches was 25 years (interquartile range (IQR): 31) and the median number of records was 1082.5 (IQR: 4708) (min.: 14, max.: 207,894). The papers were published in 106 journals (Animals (n = 21), Scientometrics (n = 8)), classified into 56 Web of Science categories ('veterinary sciences' (n = 26 journals)). Searches related to 88 different topics. There were 517 unique keywords in the papers, among which 'bibliometric(s)' (n = 45) occurred most often. The median number of co-authors per paper was 4 (IQR: 3) (min.: 1, max.: 17), with a total of 689 individual authors. Most papers (n = 110 (67.5%)) were published under open access. The median number of citations received per paper was 4 (IQR: 9) (max.: 68) and the h-index was 21. In multivariable analysis, the higher number of cited references in papers and the inclusion of specific animal species in the record search emerged as significant for the number of citations received per paper yearly.

Keywords: One Health; animal science; bibliometric; bibliometric analysis; health sciences; life sciences; meta-analysis; review; scientometric; veterinary science.


Conflict of interest statement

The authors declare no conflicts of interest.

Figures

Figure 1
Figure 1
The number of published papers on veterinary or animal studies scientometrics according to the year of publication (the dashed line is trendline).
Figure 2
Figure 2
The countries of the world from which published papers on veterinary or animal studies scientometrics originated (blue color palette in accord with the number of papers published per country).
Figure 3
Figure 3
The median year of publication of papers on veterinary or animal studies scientometrics from the 16 countries with most papers (≥5) (the country name abbreviations are set according to International Naming Convention ISO 3166 [6]).
Figure 4
Figure 4
The number of organizations in a country, from which published papers on veterinary or animal studies scientometrics originated, and the number of published papers from that country (the dashed line is trendline).
Figure 5
Figure 5
The databases used most frequently for record search in published papers on veterinary or animal studies scientometrics, with the number of published papers in which their use was reported (full details in Table S7).
Figure 6
Figure 6
The number of records obtained by the most frequently used databases reported in papers on veterinary or animal studies scientometrics (bars show interquartile range).
Figure 7
Figure 7
The number of published papers on veterinary or animal studies scientometrics, in accord with the country of origin and the journal of publication (abbreviations of country names according to International Naming Convention ISO 3166 [6]; abbreviations of journals from left to right: Animals, Frontiers in Veterinary Science, Pathogens, Poultry Science, Scientometrics, Veterinary Sciences).
Figure 8
Figure 8
Median year of publication of papers on veterinary or animal studies scientometrics, in accord with Web of Science categories with the most published papers therein (bars indicate interquartile range).
Figure 9
Figure 9
Box and whisker plot of the year of publication in papers on veterinary or animal studies scientometrics in accord with the topic of study and scientometric assessment (only most frequently assessed topics shown).
Figure 10
Figure 10
Box and whisker plot of the number of obtained records in papers on veterinary or animal studies scientometrics in accord with the topic of study and scientometric assessment (only most frequently assessed topics shown).
Figure 11
Figure 11
Word cloud of the most frequently occurring keywords in published papers on veterinary or animal studies scientometrics (full details in Table S21).
Figure 12
Figure 12
The number of authors per published paper in accord with the year of publication of the paper (the dashed line is trendline).
Figure 13
Figure 13
Frequency of published papers on veterinary or animal studies scientometrics, in accord with year of publication and accessibility of papers (red: subscription access, green: open access).
Figure 14
Figure 14
Box and whisker plot of the yearly citations per published paper on veterinary or animal studies scientometrics, in accord with accessibility of papers.
Figure 15
Figure 15
Violin plot of the yearly citations per published paper on veterinary or animal studies scientometrics, among the 16 countries with most relevant published papers (abbreviations of country names according to the International Naming Convention ISO 3166 [6]; pink violins: three countries with papers with lowest median citations yearly, blue-shaded violins: three countries with papers with highest median citations yearly).
Figure 16
Figure 16
Number of citations per paper yearly, in papers on veterinary or animal studies scientometrics, in accord with the inclusion of specific animal species in the searches.
Figure 17
Figure 17
Bi-plot of results of principal component analysis for the yearly citations received by the published papers on veterinary or animal studies scientometrics.

References

    1. Donthu N., Kumar S., Mukherjee D., Pandey N., Lim W.M. How to conduct a bibliometric analysis: An overview and guidelines. J. Bus. Res. 2021;133:285–296. doi: 10.1016/j.jbusres.2021.04.070. - DOI
    1. Verma S., Gustafsson A. Investigating the emerging COVID-19 research trends in the field of business and management: A bibliometric analysis approach. J. Bus. Res. 2020;118:253–261. doi: 10.1016/j.jbusres.2020.06.057. - DOI - PMC - PubMed
    1. Ellegaard O., Wallin J.A. The bibliometric analysis of scholarly production: How great is the impact? Scientometrics. 2015;105:1809–1831. doi: 10.1007/s11192-015-1645-z. - DOI - PMC - PubMed
    1. Donthu N., Kumar S., Pandey N., Lim W.M. Research constituents, intellectual structure, and collaboration patterns in journal of international marketing: An analytical retrospective. J. Int. Market. 2021;29:1–25. doi: 10.1177/1069031X211004234. - DOI
    1. Ramos-Rodrígue A.R., Ruíz-Navarro J. Changes in the intellectual structure of strategic management research: A bibliometric study of the Strategic Management Journal, 1980–2000. Strat. Manag. J. 2004;25:981–1004. doi: 10.1002/smj.397. - DOI

LinkOut - more resources