. 2024 Oct 23;25(21):11377.
doi: 10.3390/ijms252111377.

Molecular, Histological, and Functional Changes in Acta1-MCM;FLExDUX4/+ Mice

Affiliations

Molecular, Histological, and Functional Changes in Acta1-MCM;FLExDUX4/+ Mice

Solene Sohn et al. Int J Mol Sci. .

Abstract

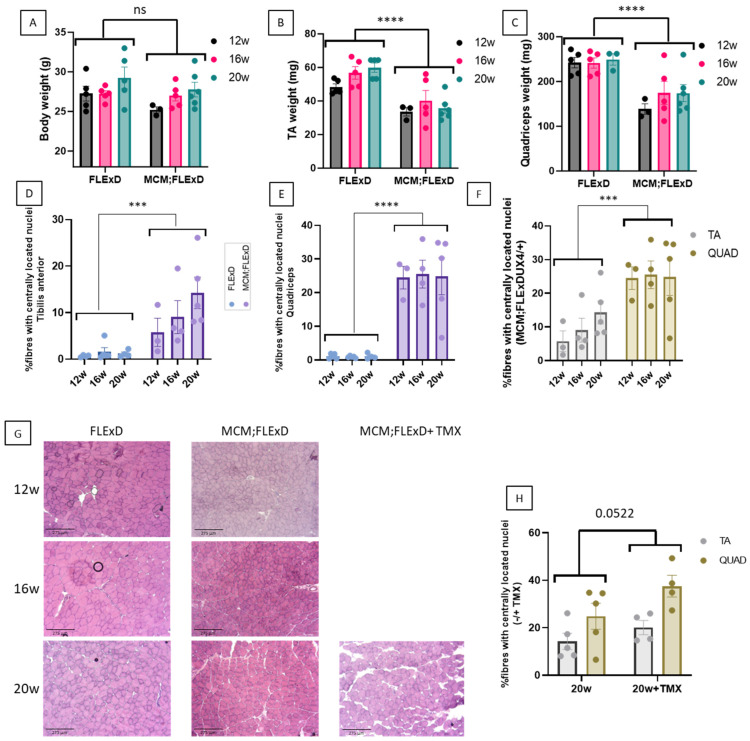
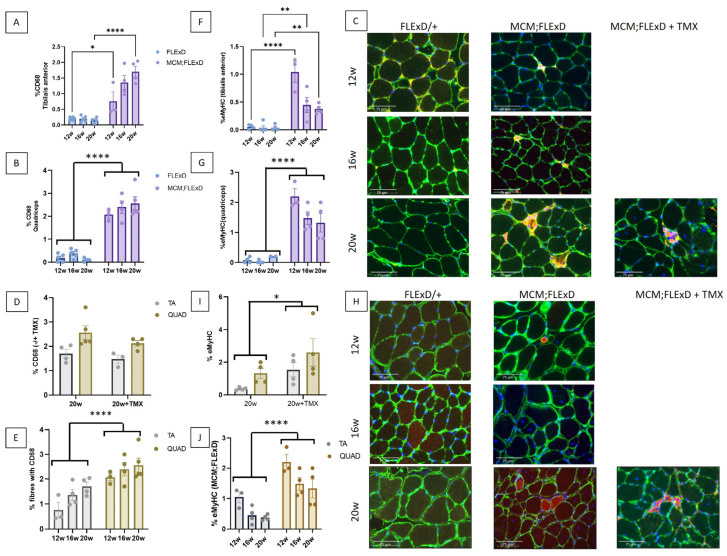
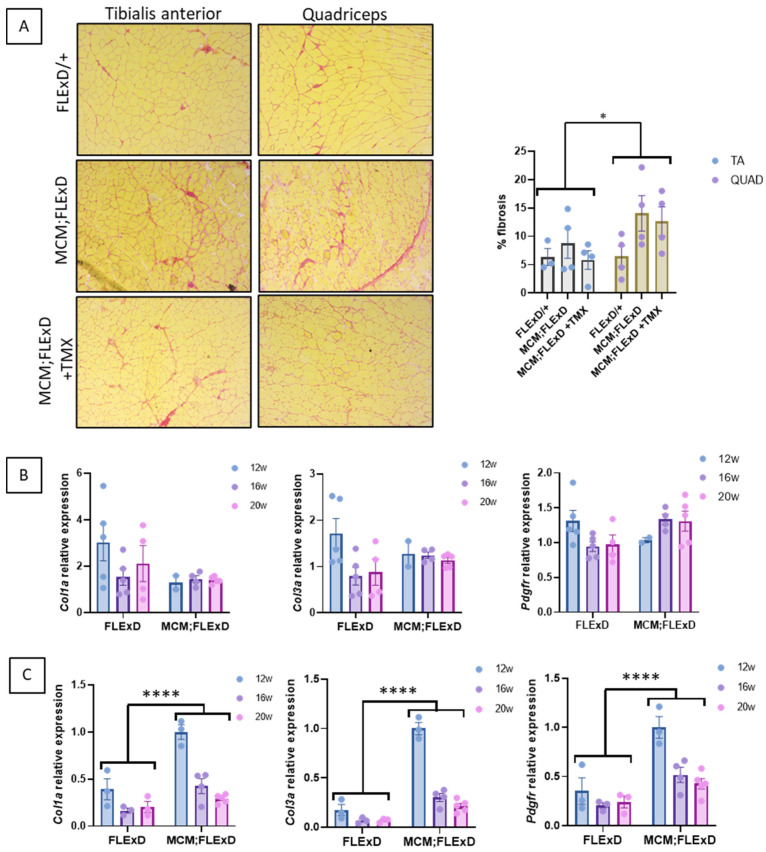
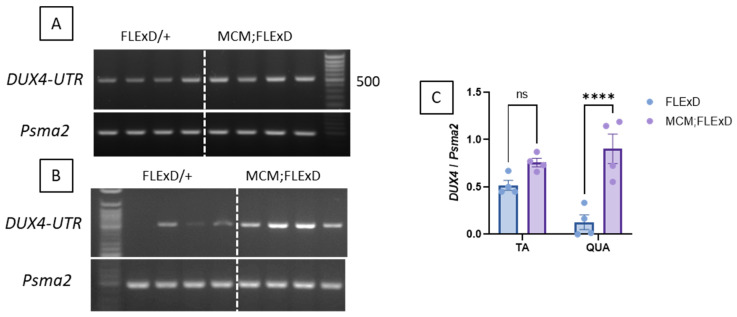
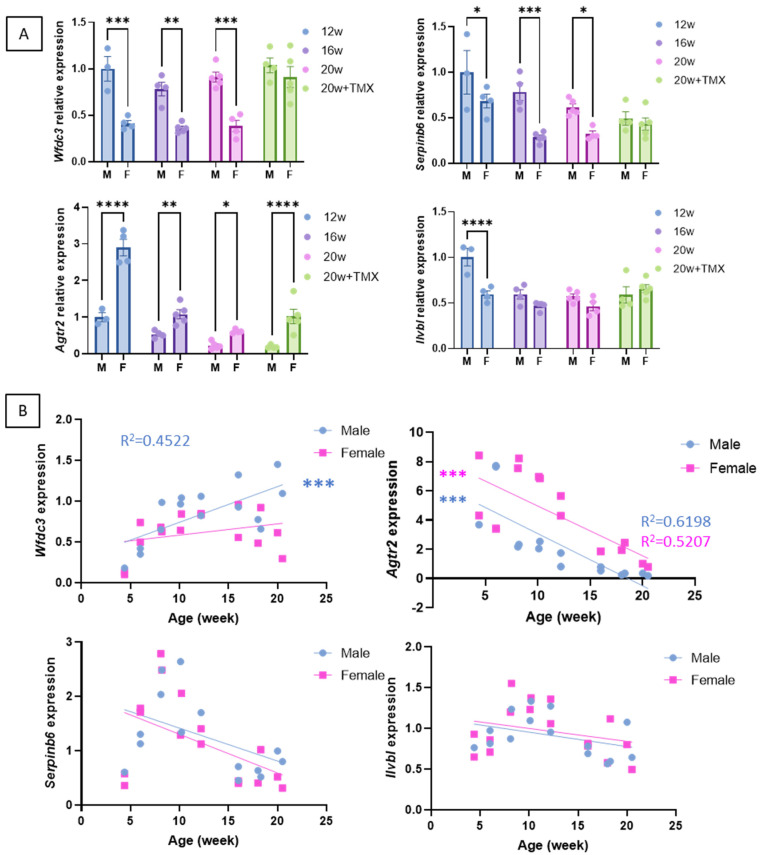
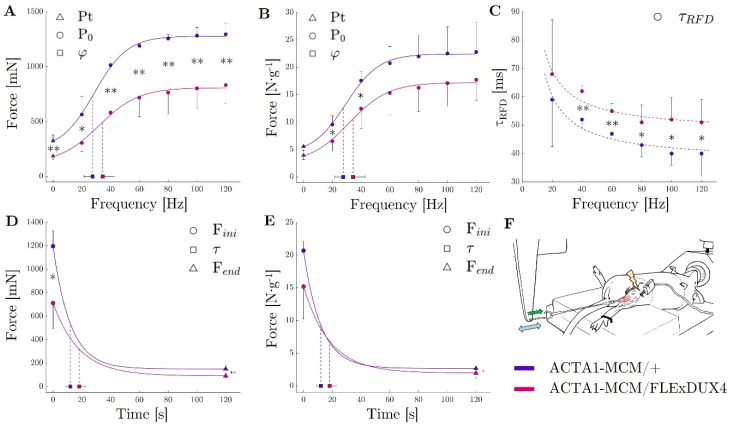
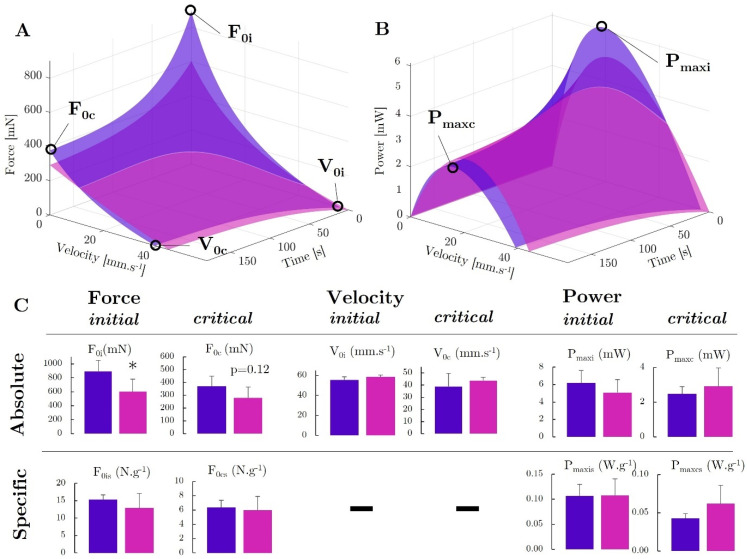
DUX4 is the major gene responsible for facioscapulohumeral dystrophy (FSHD). Several mouse models expressing DUX4 have been developed, the most commonly used by academic laboratories being ACTA1-MCM/FLExDUX4. In this study, molecular and histological modifications in the tibialis anterior and quadriceps muscles were investigated in this model at different time points. We investigated several changes that could be used as markers of therapeutic efficacy. Our results confirm the progressive muscular dystrophy previously described but also highlight biases associated with tamoxifen injections and the complexity of choosing the genes used to calculate a DUX4-pathway gene composite score. We also developed a comprehensive force test that better reflects the movements made in everyday life. This functional force-velocity-endurance model, which describes the force production capacities at all velocity and fatigue levels, was applied on 12-13-week-old animals without tamoxifen. Our data highlight that previously unsuspected muscle properties are also affected by the expression of DUX4, leading to a weaker muscle with a lower initial muscle force but with preserved power and endurance capacity. Importantly, this force-velocity-endurance approach can be used in humans for clinical evaluations.

Keywords: DUX4; FSHD; biomarker; force test; mouse model; muscle; myopathy; strength.


Conflict of interest statement

The authors declare no competing interests.

Figures

Figure 1
Figure 1
Acta1-MCM;FLExDUX4/+ animals present a slow dystrophic process. The total body weight (A), TA weight (B), QUAD weight (C), and the percentage of centrally located nuclei in the TA (D,F) and the QUAD (E,F) were measured at 12, 16, and 20 weeks in males. Transverse frozen sections were performed on the TA at different ages, and sections were stained with hematoxylin and eosin (G). In some animals, TMX (2.5 mg/kg weekly for 4 weeks) was injected (G,H). Error bars indicate the mean of SEM of 3–5 biological replicates. p-values were calculated using GraphPad Prism9, 2-way ANOVA. A post hoc test was not performed as no interaction between age and genotype was found. *** p < 0.001; **** p < 0.0001.
Figure 2
Figure 2
Acta1-MCM;FLExDUX4/+ present inflammation and regenerative fibres. The percentage of fibres positive for CD68 staining (AE) and the percentage of eMyHC-positive fibres (FJ) were measured in the TA (A,F) and the QUAD (B,G) at 12, 16, and 20 weeks in FLExDUX4/+ and ACTA1-MCM/+;FLExDUX4/+ (MCM;FLExD) males. In some animals, TMX (2.5 mg/kg weekly for 4 weeks) was injected (C,D,H,I). The number of fibres positive for CD68 staining or eMyHC was compared in the TA and QUAD muscles (E,J, respectively). Scale bar: 75 μm (C,H). Error bars indicate the mean of SEM of 3–5 biological replicates. p values were calculated using GraphPad Prism9 and 2-way ANOVA followed by Fisher’s LSD post hoc test. The statistical significance between 12-, 16-, and 20-week-old animals is presented only when there is an interaction between genotype and age (A,F). * p < 0.05; ** p < 0.01; **** p < 0.0001; TMX: tamoxifen.
Figure 3
Figure 3
Acta1-MCM;FLExDUX4/+ mice present fibrotic infiltration. Acta1-MCM;FLExDUX4/+ or FLExDUX4/+ males were treated or not with tamoxifen at the age of 16 weeks and killed at the age of 20 weeks. Picrosirius red was used to stain collagen on the TA (upper panel) and QUAD (lower panel) sections (A) in animals killed at the age of 20 weeks. The expression of several genes involved in fibrosis was investigated in the TA (B) and QUAD (C) in males aged 12, 16, or 20 weeks. Error bars indicate the mean of SEM of 3–5 biological replicates. p values were calculated using GraphPad Prism9 and 2-way ANOVA followed by Fisher’s LSD post hoc test. * p < 0.05; **** p < 0.0001; TMX: tamoxifen.
Figure 4
Figure 4
DUX4 is overexpressed in Acta1-MCM;FLExDUX4/+ mice. Representative RT-PCR analysis of DUX4 expression from either TA (A) or the QUAD (B) muscles from FLExDUX4/+ or Acta1-MCM;FLExDUX4/+ mice using the DUX4-UTR set allows the distinct amplification of the FL1- and FL2-DUX4 isoforms (product size: 368 bp and 504 bp for FL1 and FL2 respectively). Psma2 was used as a normaliser. PCR products were run on a 2% agarose gel. Band intensities were analysed using ImageJ software 1.51j8 (C). Error bars indicate the mean of the SEM of four different muscles. p values were calculated using Graphpad Prism9 and 2-way ANOVA followed by Fisher’s LSD post-test. **** p < 0.0001.
Figure 5
Figure 5
Expression of the genes downstream of DUX4 in the QUAD muscle of Acta1-MCM;FLExDUX4/+ males and females The expression levels Wfdc3, Agtr2, Serpinb6, and Ilvbl were compared at 12, 16, or 20 weeks and in the absence or presence of tamoxifen (A). Error bars indicate the mean of the SEM of 3–5 biological replicates. p-values were calculated using GraphPad Prism9 and 2-way ANOVA followed by Fisher’s LSD post hoc test. In (B), the Wfdc3, Agtr2, Serpinb6, and Ilvbl levels were followed from 4 to 20 weeks of age in Acta1-MCM;FLExDUX4/+ males or females. p values were calculated using GraphPad Prism9 after a simple linear regression analysis. A low p-value (<0.05) means that the slope will likely not equal zero. R2 is indicated on each graph p < 0.05. TMX: tamoxifen; M: male; F: female. * p < 0.05; ** p < 0.01; *** p < 0.001; **** p < 0.0001.
Figure 6
Figure 6
TA muscle force evaluation in ACTA1-MCM/+ (purple) and ACTA1-MCM/FLExDUX4 mice (pink). Peak Twitch (Pt; frequency = 0 Hz) and maximum tetanic force (P0) for stimulation from 20 to 120 Hz expressed in absolute force (mN; A) and relative to muscle mass (in N −1; B); τ RFD (time to reach 63% of the tetanic force) for stimulation from 20 to 120 Hz expressed in seconds (C); force decrease during the 2 min tetanic stimulation at 60 Hz represented by the initial force (Fini), the end-test force (Fend), and the time to reach 63% of the decrease (Tau, τ) expressed in absolute force (mN; D) and relative to muscle mass (E); experimental apparatus (F) (Green arrow represent the force apply by the muscle on the lever arm; Blue double-arrow represent the back and forth movement of the lever arm); p values were calculated using Graphpad Prism9: 2-way ANOVA followed by Fisher’s LSD post hoc test were performed. * p < 0.05; ** p < 0.01.
Figure 7
Figure 7
Force–velocity–endurance (FoVE) evaluation in ACTA1-MCM/+ (purple) and Acta1-MCM;FLExDUX4/+ mice (pink). The 3D graphical representation is presented for the relationship of force as a function of the contraction velocity and time (A) and power as a function of the contraction velocity and time (B). The main indices are represented graphically. F0: muscle maximal force in isometric condition (i.e., static, null velocity); V0: muscle maximum contraction velocity; Pmax: muscle maximal power production capacity. Indices i and c, represent, respectively, the initial condition in a fresh state, ending in extreme fatigue at the end of the test. Statistical comparison of FoVE indices expressed in absolute and specific terms, i.e., normalised to muscle mass (C). p values were calculated using GraphPad Prism9: 2-way ANOVA followed by Fisher’s LSD post hoc test were performed. * p < 0.05.

References

    1. Orphanet Prevalence and Incidence of Rare Diseases: Bibliographic Data. 2024. [(accessed on 15 October 2024)]. Available online: https://www.orpha.net/pdfs/orphacom/cahiers/docs/GB/Prevalence_of_rare_d....
    1. Mul K. Facioscapulohumeral Muscular Dystrophy. Continuum. 2022;28:1735–1751. doi: 10.1212/CON.0000000000001155. - DOI - PubMed
    1. Lemmers R.J., van der Vliet P.J., Klooster R., Sacconi S., Camano P., Dauwerse J.G., Snider L., Straasheijm K.R., van Ommen G.J., Padberg G.W., et al. A unifying genetic model for facioscapulohumeral muscular dystrophy. Science. 2010;329:1650–1653. doi: 10.1126/science.1189044. - DOI - PMC - PubMed
    1. Ferreboeuf M., Mariot V., Bessieres B., Vasiljevic A., Attie-Bitach T., Collardeau S., Morere J., Roche S., Magdinier F., Robin-Ducellier J., et al. DUX4 and DUX4 downstream target genes are expressed in fetal FSHD muscles. Hum. Mol. Genet. 2014;23:171–181. doi: 10.1093/hmg/ddt409. - DOI - PubMed
    1. Gabriels J., Beckers M.C., Ding H., De Vriese A., Plaisance S., van der Maarel S.M., Padberg G.W., Frants R.R., Hewitt J.E., Collen D., et al. Nucleotide sequence of the partially deleted D4Z4 locus in a patient with FSHD identifies a putative gene within each 3.3 kb element. Gene. 1999;236:25–32. doi: 10.1016/S0378-1119(99)00267-X. - DOI - PubMed

MeSH terms

LinkOut - more resources