. 2024 Oct 23;25(21):11399.
doi: 10.3390/ijms252111399.

Noradrenaline Protects Human Microglial Cells (HMC3) Against Apoptosis and DNA Damage Induced by LPS and Aβ1-42 Aggregates In Vitro

Affiliations

Noradrenaline Protects Human Microglial Cells (HMC3) Against Apoptosis and DNA Damage Induced by LPS and Aβ1-42 Aggregates In Vitro

Julia Barczuk et al. Int J Mol Sci. .

Abstract

Alzheimer's disease (AD) is the most prevalent neurodegenerative disorder, characterized by the accumulation of amyloid-beta (Aβ) plaques and neuroinflammation. This study investigates the protective effects of noradrenaline (NA) on human microglial cells exposed to lipopolysaccharides (LPS) and Aβ aggregates-major contributors to inflammation and cellular damage in AD. The reduced Aβ aggregation in the HMC3 human microglial cells co-treated with Aβ and NA was confirmed by thioflavin T (ThT) assay, fluorescent ThT staining, and immunocytochemistry (ICC). The significantly increased viability of HMC3 cells after 48 h of incubation with NA at 50 µM, 25 µM, and 10 µM, exposed to IC50 LPS and IC50 Aβ, was confirmed by XTT and LDH assays. Moreover, we found that NA treatment at 25 μM and 50 μM concentrations in HMC3 cells exposed to IC50 LPS or IC50 Aβ results in an increased proliferation of HMC3 cells, their return to normal morphology, decreased levels of DNA damage, reduced caspase-3 activity, decreased expression of pro-apoptotic DDIT3 and BAX, and increased expression of anti-apoptotic BCL-2 genes and proteins, leading to enhanced cell survival, when compared to that of the HMC3 cells treated only with IC50 LPS or IC50 Aβ. Furthermore, we showed that NA induces the degradation of both extracellular and intracellular Aβ deposits and downregulates hypoxia-inducible factor 1α (HIF-1α), which is linked to impaired Aβ clearance and AD progression. These findings indicate that NA holds promise as a therapeutic target to address microglial dysfunction and potentially slow the progression of AD. Its neuroprotective effects, particularly in reducing inflammation and regulating microglial activity, warrant further investigation into its broader role in mitigating neuroinflammation and preserving microglial function in AD.

Keywords: Alzheimer’s disease; Bax; Bcl-2; HIF-1α; LPS; amyloid beta; caspase-3; microglia; neuroinflammation; noradrenaline.


Conflict of interest statement

The authors declare no conflicts of interest.

Figures

Figure 1
Figure 1
The thioflavin T (ThT) assay for the presence of beta-amyloid aggregates. The kinetic curves show the concentration-dependent increase in fluorescence induced by aggregated Aβ.
Figure 2
Figure 2
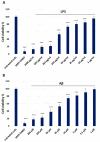
The cytotoxicity analysis of the lipopolysaccharide (1000 µg/mL–5 µg/mL) (A) and beta-amyloid (200 µM–1 µM) (B) in HMC3 cells assessed using the XTT Assay Kit. Cells were incubated with the indicated compounds for 48 h. The one-way ANOVA with Bonferroni post-hoc test was used in the statistical analysis. All the experiments were performed in triplicate, and the data are expressed as the mean ± SD, * p < 0.05, *** p < 0.001 vs. untreated cells.
Figure 3
Figure 3
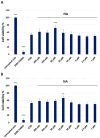
The cytotoxicity analysis of the noradrenaline (200 µM–1 µM) in HMC3 cells exposed to IC50 lipopolisacharide (µg/mL) (A) and IC50 amyloid beta (µM) (B), assessed using the XTT Assay Kit. Cells were incubated with the indicated compounds for 48 h. The one-way ANOVA with Bonferroni post-hoc test was used in the statistical analysis. All the experiments were performed in triplicate, and the data are expressed as the mean ± SD, ** p < 0.01, *** p < 0.001 vs. IC50.
Figure 4
Figure 4
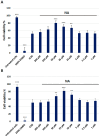
The cytotoxicity analysis of the noradrenaline (200 µM–1 µM) in HMC3 cells exposed to IC50 lipopolisacharide (µg/mL) (A) and IC50 amyloid beta (µM) (B), assessed using the Pierce LDH Cytotoxicity Assay Kit. Cells were incubated with the indicated compounds for 48 h. The one-way ANOVA with Bonferroni post-hoc test was used in the statistical analysis. All the experiments were performed in triplicate, and the data are expressed as the mean ± SD, ** p < 0.01, *** p < 0.001 vs. IC50.
Figure 5
Figure 5
Effect of noradrenaline on the morphology of HMC3 cells exposed to LPS or Aβ after 24 h incubation. The main differences between groups are marked with arrows. Morphology images were captured using an inverted phase-contrast microscope in Nis elements D software ver. 5.30, with a magnification 20×. Abbreviations: LPS—lipolisacharide; Aβ—amyloid beta; NA—noradrenaline.
Figure 6
Figure 6
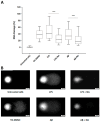
Evaluation of genotoxicity of the noradrenaline (µM) in HMC3 cells exposed to IC50 lipopolysaccharide (µg/mL) and IC50 amyloid beta (µM) (A), assessed using the alkaline version of the comet assay. The representatives of each group of comet assay images were captured using an inverted fluorescent microscope in Lucia Comet Assay software ver. 7.60. (B), The Kruskal–Wallis test was applied for the statistical analysis. All the experiments were conducted in triplicate, and the data are expressed as the median and interquartile range. *** p < 0.001 for all groups. Abbreviations: LPS—lipolisacharide; Aβ—amyloid beta; NA—noradrenaline.
Figure 7
Figure 7
Fluorescence imaging of ThT-stained cells grown under different conditions: untreated HMC3 cells (control), HMC3 cells treated with amyloid β (Aβ), HMC3 cells treated with amyloid β and noradrenaline (Aβ + NA).
Figure 8
Figure 8
Immunocytochemical staining for amyloid β (Aβ) in cells grown under different condi-tions: untreated HMC3 cells, HMC3 cells treated with Aβ, HMC3 cells treated with amyloid β and noradrenaline (Aβ + NA). The main differences between groups are marked with arrows, with magnifications of 10× (upper row) and 20× (lower row). Cells were counterstained with hematoxylin. Representative images are shown.
Figure 9
Figure 9
Colorimetric assessment of the level of caspase-3 in HMC3 cells exposed to IC50 lipopolysaccharide (µg/mL) and IC50 amyloid beta (µM) only or in the presence of noradrenaline. The one-way ANOVA with Bonferroni post-hoc test was used in the statistical analysis. All the experiments were performed in triplicate, and the data are expressed as the mean ± SD. *** p < 0.001 for all groups. Abbreviations: LPS—lipopolysaccharide; Aβ—amyloid beta; NA—noradrenaline.
Figure 10
Figure 10
Measurement of oxygen consumption rate (OCR) (A) and extracellular acidification rate (ECAR) (B) in real-time by Seahorse ATP Rate assay in HMC3 cells exposed to IC50 lipopolysaccharide (µg/mL) and IC50 amyloid beta (µM) only or in the presence of noradrenaline. The one-way ANOVA with Bonferroni post-hoc test was used in the statistical analysis. All the experiments were performed in triplicate, and the data are expressed as mean ± SD. Abbreviations: LPS—lipopolysaccharide; Aβ—amyloid beta; NA—noradrenaline.
Figure 11
Figure 11
The mRNA expression levels of DDIT3 (A), BAX (B), and BCL2 (C) genes in HMC3 cells exposed to IC50 lipopolisacharide (µg/mL) and IC50 amyloid beta (µM) only or in the presence of noradrenaline. ACTB was used as a reference gene. The one-way ANOVA with Bonferroni post-hoc test was applied for the statistical analysis. All the experiments were performed in triplicate, and the data are expressed as the mean ± SD. *** p < 0.001 for all groups. Abbreviations: LPS—lipolisacharide; Aβ—amyloid beta; NA—noradrenaline.
Figure 12
Figure 12
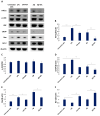
Western blot analysis (A) of the expression level of the proteins HIF-1α (B), p-JNK (C), CHOP (D), Bax (E), and Bcl-2 (F) in HMC3 cells exposed to IC50 lipopolysaccharide (µg/mL) and IC50 amyloid beta (µM) only or in presence of noradrenaline. β-actin was applied as a loading control. The one-way ANOVA with Bonferroni post-hoc test was used in the statistical analysis. All the experiments were conducted in triplicate, and the data are expressed as the mean ± SD. * p < 0.05, ** p < 0.01, *** p < 0.001 for all groups. Abbreviations: LPS—lipopolysaccharide; Aβ—amyloid beta; NA—noradrenaline.

References

    1. 2021 Alzheimer’s Disease Facts and Figures. Alzheimers Dement. 2021;17:327–406. doi: 10.1002/alz.12328. - DOI - PubMed
    1. Ma Y., Brettschneider J., Collingwood J.F. A Systematic Review and Meta-Analysis of Cerebrospinal Fluid Amyloid and Tau Levels Identifies Mild Cognitive Impairment Patients Progressing to Alzheimer’s Disease. Biomedicines. 2022;10:1713. doi: 10.3390/biomedicines10071713. - DOI - PMC - PubMed
    1. Giorgi F.S., Saccaro L.F., Galgani A., Busceti C.L., Biagioni F., Frati A., Fornai F. The Role of Locus Coeruleus in Neuroinflammation Occurring in Alzheimer’s Disease. Brain Res. Bull. 2019;153:47–58. doi: 10.1016/j.brainresbull.2019.08.007. - DOI - PubMed
    1. Canter R.G., Penney J., Tsai L.-H. The Road to Restoring Neural Circuits for the Treatment of Alzheimer’s Disease. Nature. 2016;539:187–196. doi: 10.1038/nature20412. - DOI - PubMed
    1. Prinz M., Priller J. Microglia and Brain Macrophages in the Molecular Age: From Origin to Neuropsychiatric Disease. Nat. Rev. Neurosci. 2014;15:300–312. doi: 10.1038/nrn3722. - DOI - PubMed

MeSH terms

LinkOut - more resources