. 2024 Oct 27;25(21):11534.
doi: 10.3390/ijms252111534.

Gestational Diabetes-like Fuels Impair Mitochondrial Function and Long-Chain Fatty Acid Uptake in Human Trophoblasts

Affiliations

Gestational Diabetes-like Fuels Impair Mitochondrial Function and Long-Chain Fatty Acid Uptake in Human Trophoblasts

Kyle M Siemers et al. Int J Mol Sci. .

Abstract

In the parent, gestational diabetes mellitus (GDM) causes both hyperglycemia and hyperlipidemia. Despite excess lipid availability, infants exposed to GDM are at risk for essential long-chain polyunsaturated fatty acid (LCPUFA) deficiency. Isotope studies have confirmed less LCPUFA transfer from the parent to the fetus, but how diabetic fuels impact placental fatty acid (FA) uptake and lipid droplet partitioning is not well-understood. We evaluated the effects of high glucose conditions, high lipid conditions, and their combination on trophoblast growth, viability, mitochondrial bioenergetics, BODIPY-labeled fatty acid (FA) uptake, and lipid droplet dynamics. The addition of four carbons or one double bond to FA acyl chains dramatically affected the uptake in both BeWo and primary isolated cytotrophoblasts (CTBs). The uptake was further impacted by media exposure. The combination-exposed trophoblasts had more mitochondrial protein (p = 0.01), but impaired maximal and spare respiratory capacities (p < 0.001 and p < 0.0001), as well as lower viability (p = 0.004), due to apoptosis. The combination-exposed trophoblasts had unimpaired uptake of BODIPY C12 but had significantly less whole-cell and lipid droplet uptake of BODIPY C16, with an altered lipid droplet count, area, and subcellular localization, whereas these differences were not seen with individual high glucose or lipid exposure. These findings bring us closer to understanding how GDM perturbs active FA transport to increase the risk of adverse outcomes from placental and neonatal lipid accumulation alongside LCPUFA deficiency.

Keywords: fatty acids; gestational diabetes mellitus; lipid droplets; mitochondria; trophoblast.


Conflict of interest statement

The authors declare no conflicts of interest.

Figures

Figure 1
Figure 1
BeWo growth and viability in high glucose, high lipid, and combined conditions. BeWo cells were cultured in control, high glucose, high lipid, and combination media for 72 h and then uniformly plated to 24-well plates and cultured for 96 h in respective media. Daily cell counts were used to estimate growth over time (A) and calculate doubling time and fold change (B) from 24 h to 96 h. An apoptosis assay using flow cytometry was used to quantify APC-Annexin V (APC-A)-and PE-propidium iodide (PE-A)-tagged cells (C) to identify the percent of viable and apoptotic BeWo following 96 h of media exposure (D). n = 3/group; * p < 0.05, ** p < 0.01 by one-way ANOVA with Tukey’s multiple comparison test.
Figure 2
Figure 2
Mitochondrial protein abundance in high glucose-, high lipid-, and combination-exposed BeWo. Representative western blot (A), relative abundance (B,C), and ratio (D) of mitochondrial proteins TOM20 and VDAC in BeWo lysate. Densitometry was normalized to the average of controls on each well’s respective blot (n = 6/exposure group). * p < 0.05, ** p < 0.01 by one-way ANOVA with Tukey’s multiple comparison test. See full, unedited blots in Figure S1.
Figure 3
Figure 3
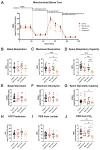
Cellular bioenergetics of control, high glucose-, high lipid-, and combination-exposed BeWo. Average oxygen consumption rate (OCR), which estimates cellular respiration, is shown as a trace across a mitochondrial stress test (A) and comparisons of average basal respiration (B), maximum respiration (C), and spare respiratory capacity (D) by group in BeWo cultured in control, high glucose, high lipid, and combination media. Average extracellular acidification (ECAR) estimates are shown for basal glycolysis (E), maximal glycolysis (F), and spare glycolytic capacity (G) by group. OCR and ECAR were used to calculate ATP production (H) and proton efflux rate (PER) leading to lactate production (anaerobic glycolysis) (I) and CO2 (aerobic glycolysis) (J). Values are mean ± SEM (A), and individual values from experimental replicates (BG) and calculated values (HJ) are shown with the line representing the mean. n = 12–24/group. * p < 0.05, ** p < 0.01, *** p < 0.001, **** p < 0.0001 by one-way ANOVA with Tukey’s multiple comparison test.
Figure 4
Figure 4
Fatty acid (FA) uptake by carbon length and saturation. Representative images of BeWo with whole-cell regions of interest (ROIs) were taken by confocal live-cell imaging at 5, 20, 60, 120, and 180 min after adding BODIPY C12 (red), BODIPY C16 (green), and monounsaturated BODIPY C12 (MU C12, red) to media (A). BODIPY 505/515 neutral lipid counterstain was used to validate that lipid uptake occurred in BODIPY MU C12 experiments. The average relative fluorescent intensities were plotted over time to assess variation in kinetics (B). n = 3 biological replicates/group with 41–55 cells/group/time point imaged and analyzed. Values are mean ± SEM.
Figure 5
Figure 5
Whole-cell fatty acid uptake in controls and high glucose-, high lipid-, and combination-exposed BeWo over time. Each media group’s whole-cell uptake of BODIPY C12 (A), BODIPY C16 (B), and BODIPY MU C12 (C) are shown over 180 min, and group comparisons demonstrate time- and FA-specific differences between exposure groups (D). p values and arrow noting direction of change for statistical significance compared to control uptake across time points are shown (D). n = 3/exposure group with 41–55 cells/group/time point analyzed. Values are mean ± SEM. Significant differences from control p < 0.05 by one-way ANOVA with Tukey’s multiple comparison test.
Figure 6
Figure 6
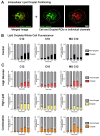
Effects of high glucose, high lipid, and combination exposure on the proportion of FA species in BeWo lipid droplets over time. Droplets were identified using the green channel fluorescence, BODIPY 505/515 (shown in A) or BODIPY C16 depending on the experimental design. Droplets were segmented using ImageJ particle analysis, as represented by BODIPY 505/515 (green) and BODIPY MU C12 (red) in BeWo imaged at 20 min (A). The proportion of droplet to whole-cell intensity was calculated, where 1 is the total fluorescence in the cell. This estimate of lipid droplet partitioning of individual FAs (BODIPY C12, C16, and MU C12) is illustrated over time in controls (B) and high glucose-, high lipid-, and combination-exposed BeWo (C). n = 3/exposure group with 41–55 cells/group/time point analyzed. Values are mean ± SEM. Significant differences (p < 0.05) from the control group at each time point by one-way ANOVA with Tukey’s multiple comparison test are indicated with the white asterisk (*) within the column.
Figure 7
Figure 7
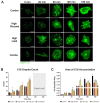
Representative images of BODIPY C16 lipid droplets in BeWo highlight the variations in amount and area occupied by lipid droplets (A). Average lipid droplet counts (B) and relative areas of BODIPY C16 accumulation per cell area (C) are represented by bar graphs per group, over time. n = 3/exposure group with 41–55 cells/group/time point. Values are mean ± SEM. Significant differences from control: * p < 0.05 by one-way ANOVA with Tukey’s multiple comparison test.
Figure 8
Figure 8
BODIPY C16-containing lipid dynamics over time. Strategy for determining localization of lipid droplets based on their distance from the center of the cell relative to the average cell radius (A) and BODIPY C16 droplet distance (B,C). Representative images of BODIPY C16 droplet distribution at 20 min in control, high glucose, high lipid, and combination media groups (D). n = 3/exposure with 41–55 cells/group/time point. Values are mean ± SEM. * p < 0.05 by one-way ANOVA with Tukey’s multiple comparisons test.
Figure 9
Figure 9
Fatty acid uptake in primary human trophoblasts. Representative images and relative fluorescence for each BODIPY FA take up in primary isolated cytotrophoblasts 12 h after isolation (A) and 96 h after isolation, whereby they have formed a syncytium (B). n = 7 patients, 10 cells measured per time point per patient. Values are mean ± SEM.

References

    1. Plows J.F., Stanley J.L., Baker P.N., Reynolds C.M., Vickers M.H. The Pathophysiology of Gestational Diabetes Mellitus. Int. J. Mol. Sci. 2018;19:3342. doi: 10.3390/ijms19113342. - DOI - PMC - PubMed
    1. Akinyemi O.A., Weldeslase T.A., Odusanya E., Akueme N.T., Omokhodion O.V., Fasokun M.E., Makanjuola D., Fakorede M., Ogundipe T. Profiles and Outcomes of Women with Gestational Diabetes Mellitus in the United States. Cureus. 2023;15:e41360. doi: 10.7759/cureus.41360. - DOI - PMC - PubMed
    1. Gregory E.C.W., Ely D.M. Trends and Characteristics in Gestational Diabetes: United States, 2016–2020. Natl. Vital Stat. Rep. 2022;71:1–15. - PubMed
    1. Centers for Disease Control and Prevention About Gestational Diabetes. [(accessed on 27 June 2024)]; Available online: https://www.cdc.gov/diabetes/about/gestational-diabetes.html.
    1. Langer O., Yogev Y., Most O., Xenakis E.M. Gestational diabetes: The consequences of not treating. Am. J. Obstet. Gynecol. 2005;192:989–997. doi: 10.1016/j.ajog.2004.11.039. - DOI - PubMed

LinkOut - more resources