. 2024 Oct 27;25(21):11550.
doi: 10.3390/ijms252111550.

Pan-Genome-Wide Investigation and Co-Expression Network Analysis of HSP20 Gene Family in Maize

Affiliations

Pan-Genome-Wide Investigation and Co-Expression Network Analysis of HSP20 Gene Family in Maize

Hengyu Yan et al. Int J Mol Sci. .

Abstract

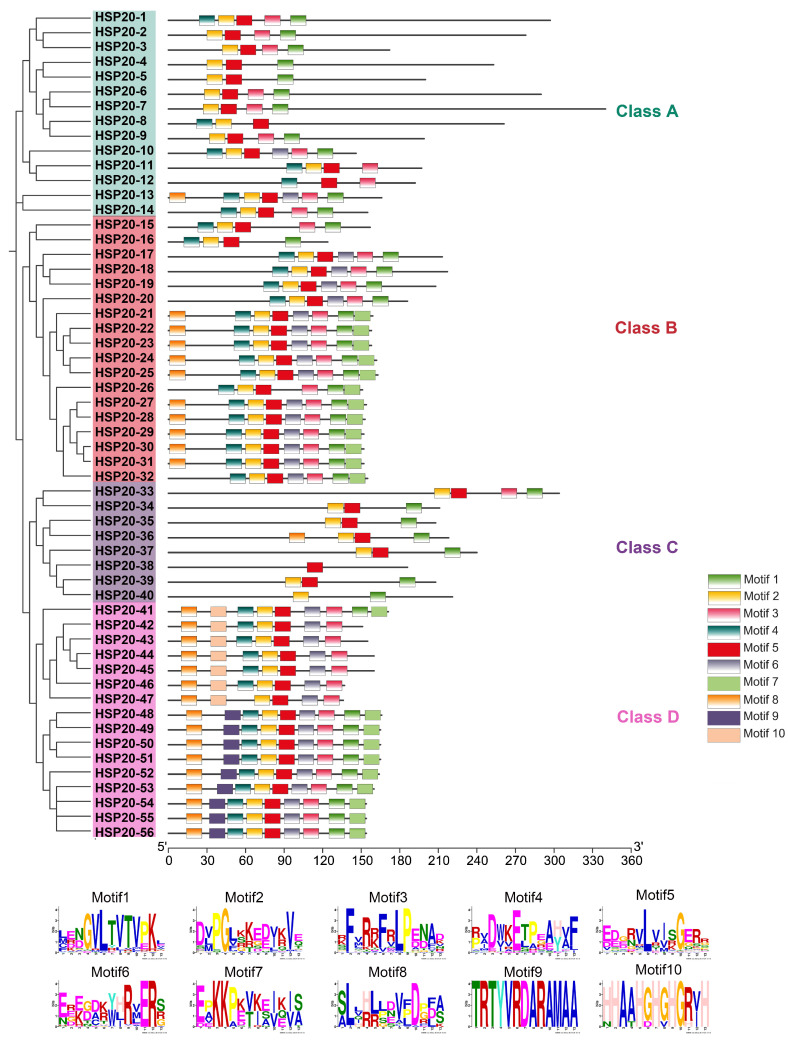
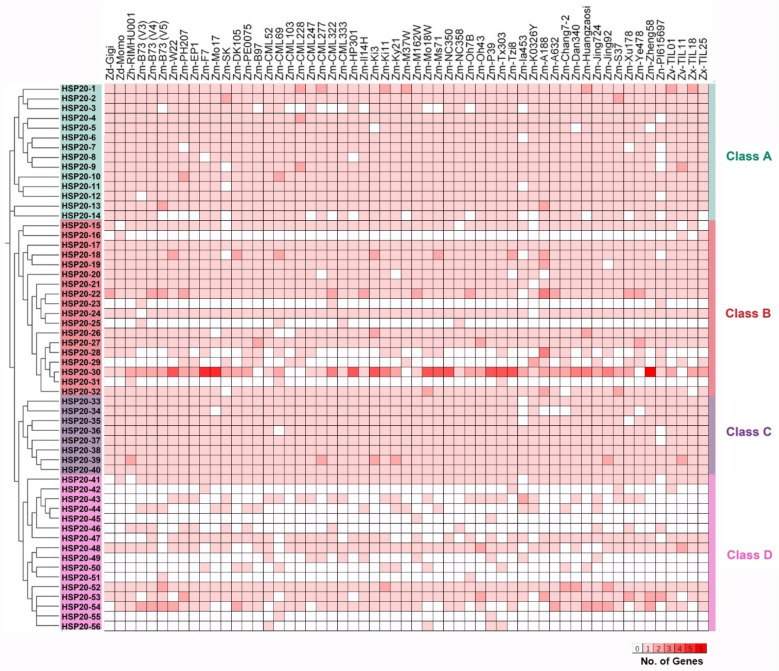
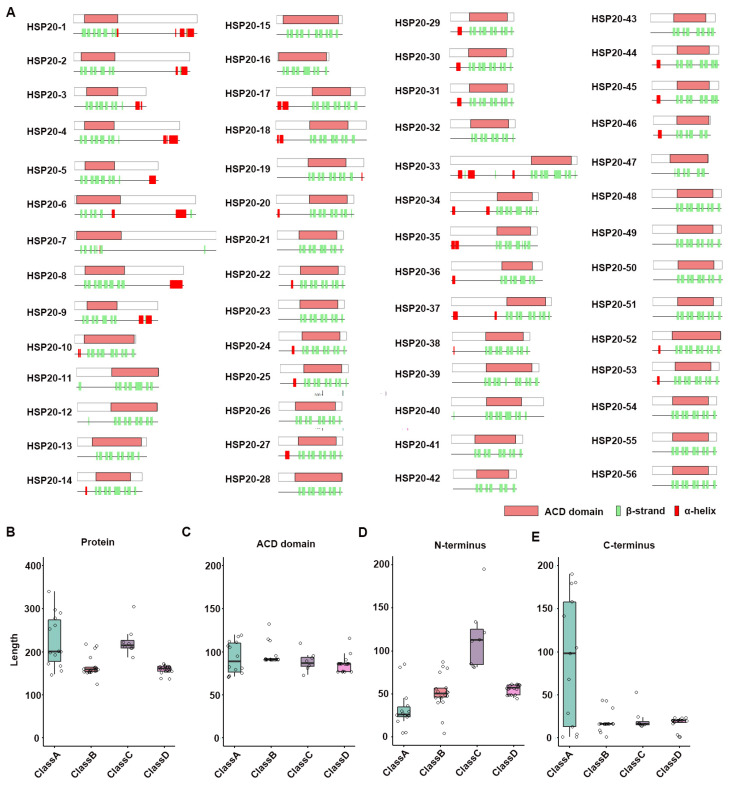
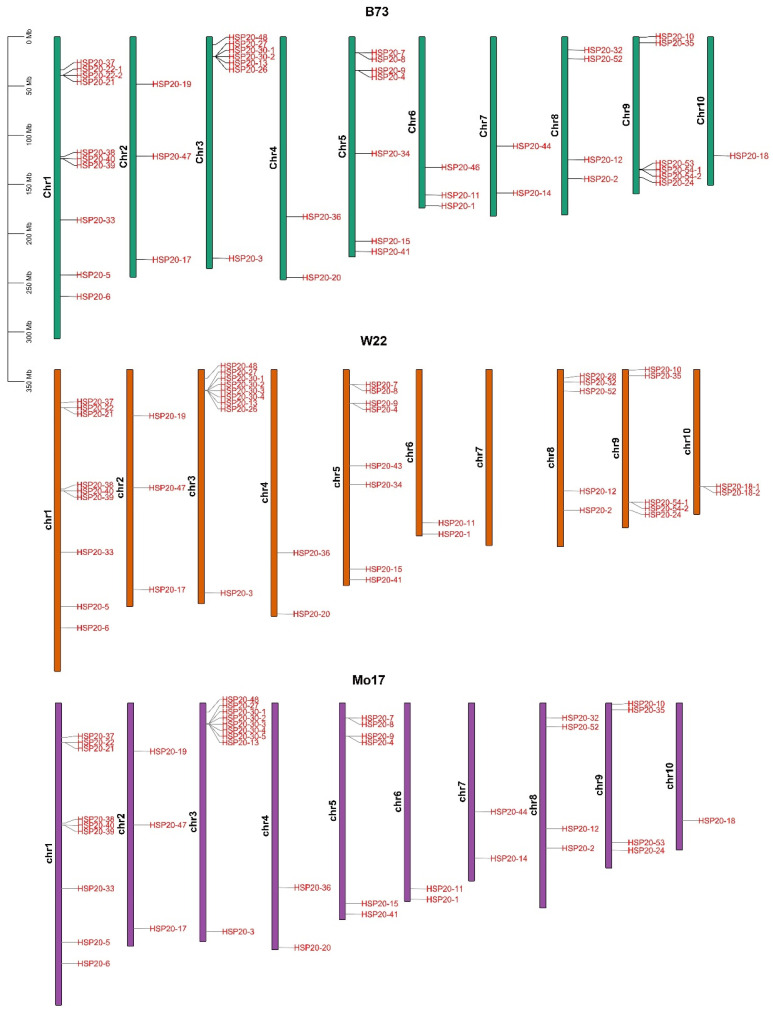
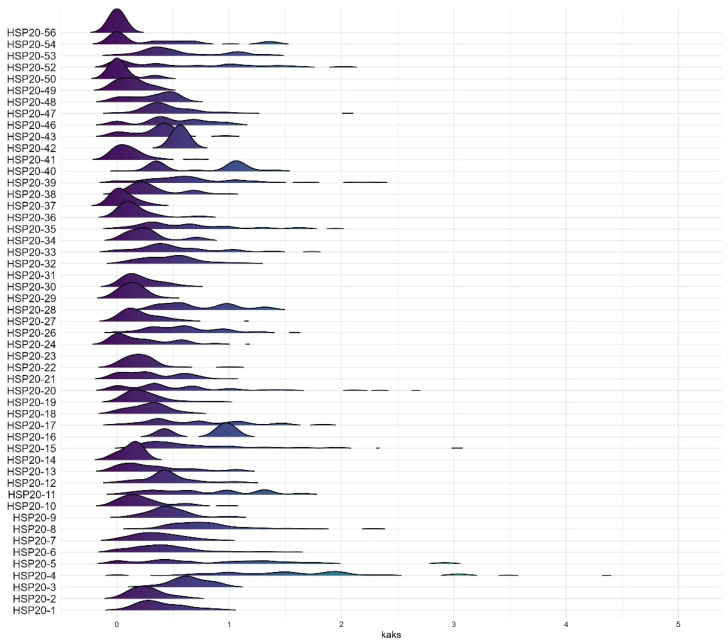
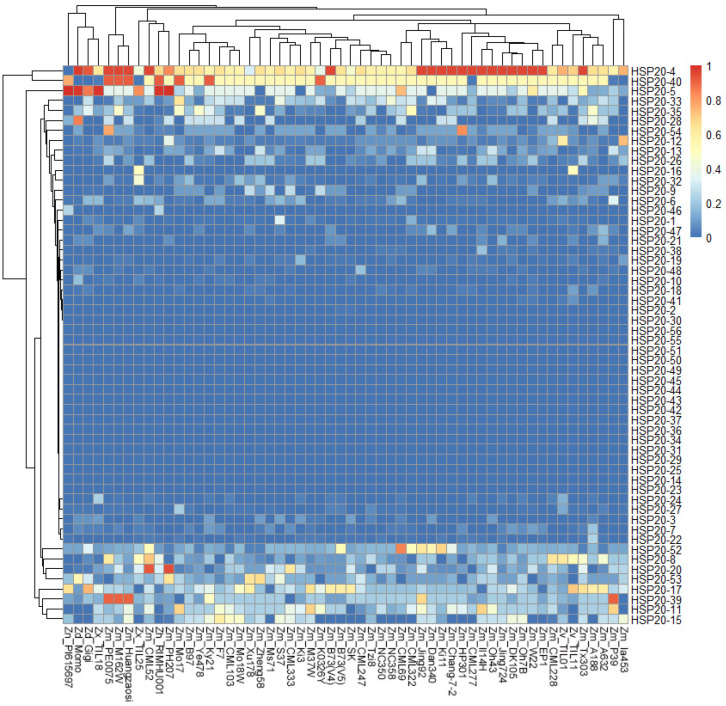
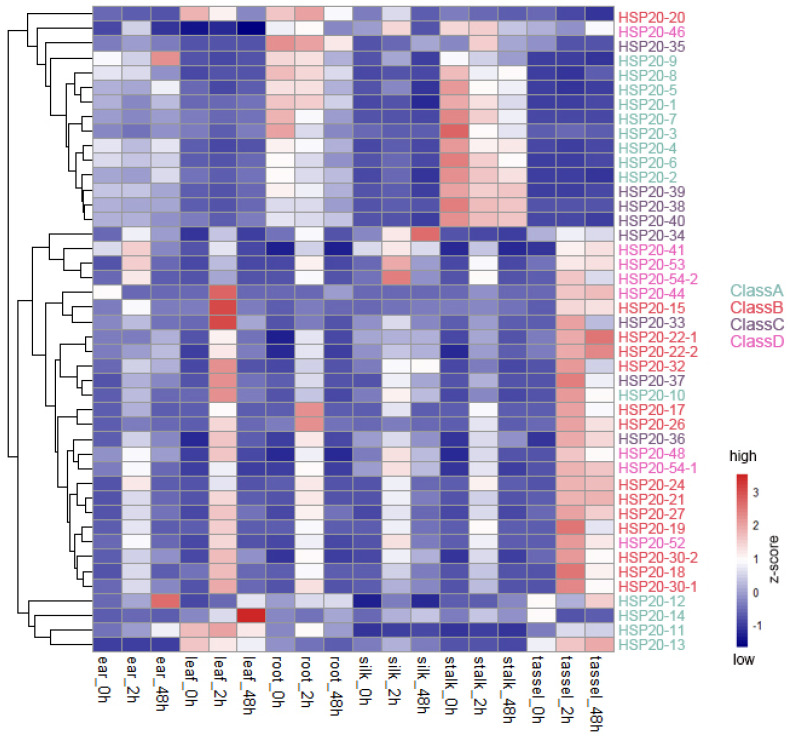
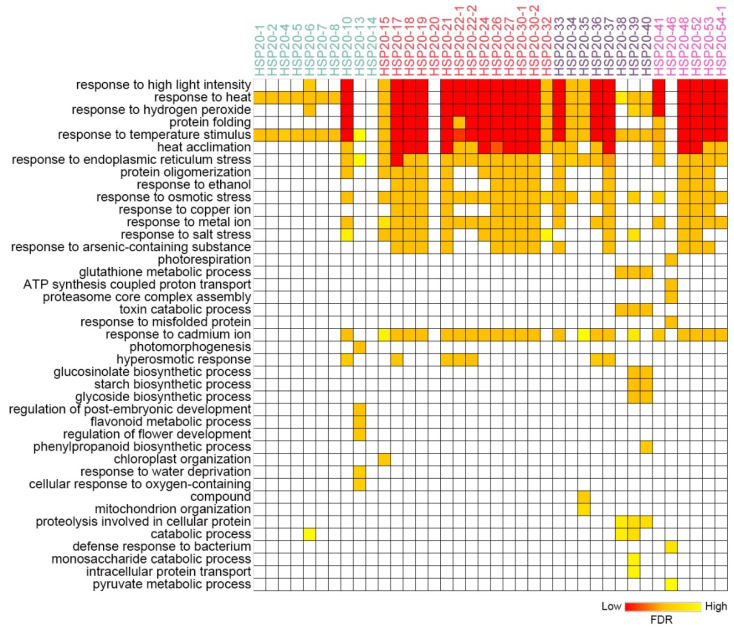
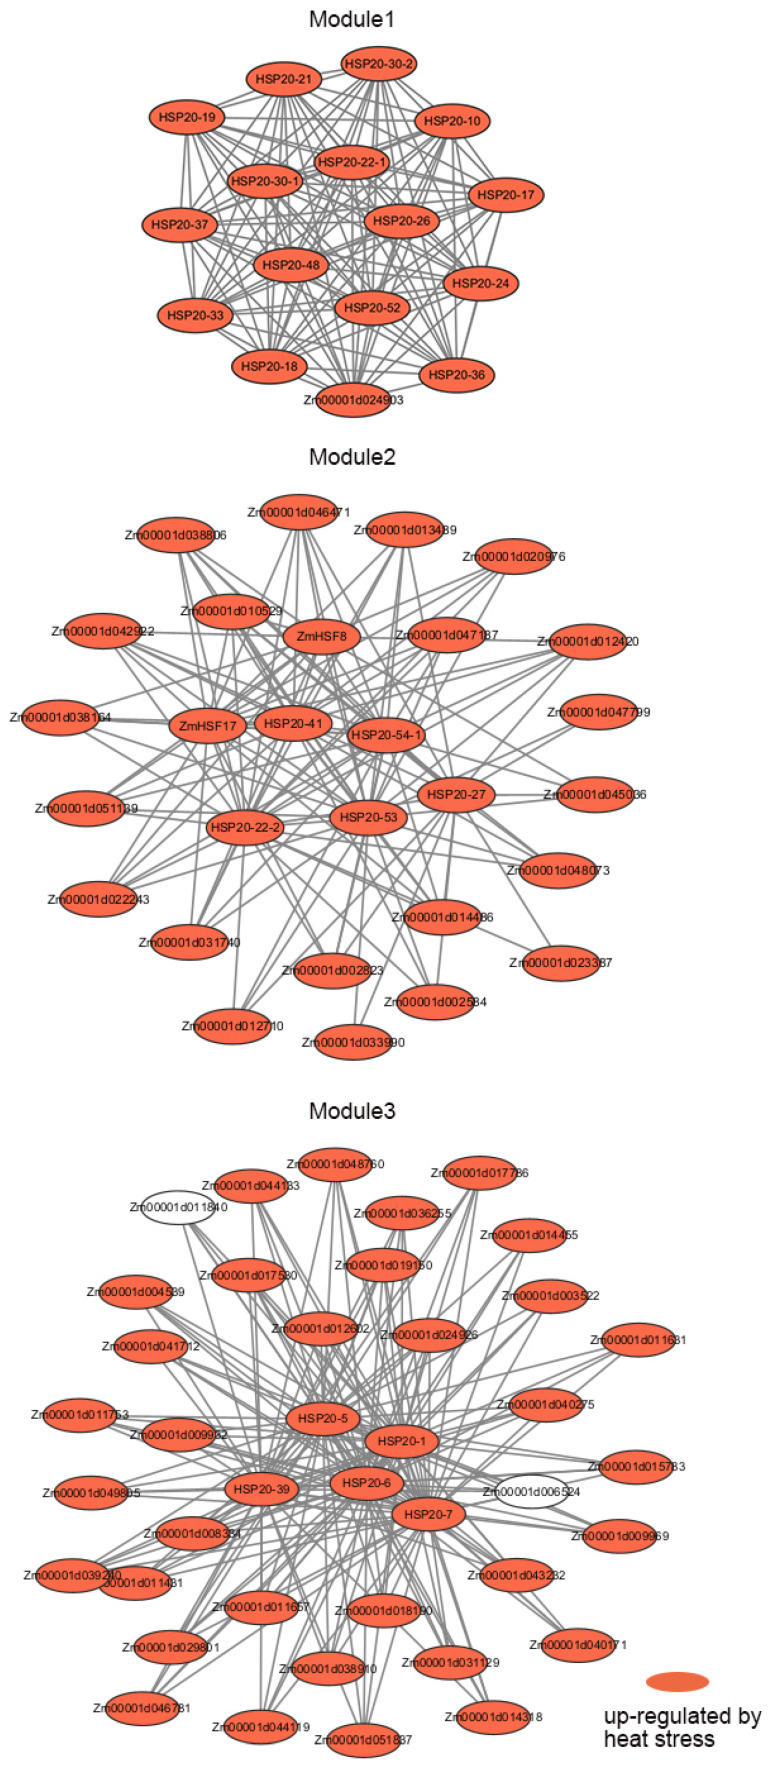
Heat shock protein 20 (HSP20) is a diverse and functionally important protein family that plays a crucial role in plants' tolerance to various abiotic stresses. In this study, we systematically analyzed the structural and functional characteristics of the HSP20 gene family within the Zea pan-genome. By identifying 56 HSP20 pan-genes, we revealed the variation in the number of these genes across different maize inbreds or relatives. Among those 56 genes, only 31 are present in more than 52 inbreds or relatives. Further phylogenetic analysis classified these genes into four major groups (Class A, B, C, D) and explored their diversity in subcellular localization, physicochemical properties, and the terminal structures of those HSP20s. Through collinearity analysis and Ka/Ks ratio calculations, we found that most HSP20 genes underwent purifying selection during maize domestication, although a few genes showed signs of positive selection pressure. Additionally, expression analysis showed that several HSP20 genes were significantly upregulated under high temperatures, particularly in tassels and leaves. Co-expression network analysis revealed that HSP20 genes were significantly enriched in GO terms related to environmental stress responses, suggesting that HSP20 genes not only play key roles in heat stress but may also be involved in regulating various other biological processes, such as secondary metabolism and developmental processes. These findings expand our understanding of the functions of the maize HSP20 family and provide new insights for further research into maize's response mechanisms to environmental stresses.

Keywords: HSP20; Zea pan-genome; co-expression; gene family; heat stress.


Conflict of interest statement

The authors declare no conflicts of interest.

Figures

Figure 1
Figure 1
Phylogenetic analysis and conserved motif distribution of HSP20 genes in the Zea pan-genome. The left panel shows a phylogenetic tree constructed based on the full-length protein sequences of the HSP20 genes, which are categorized into four main clades: Class A (green), Class B (red), Class C (purple), and Class D (pink). The right panel displays the distribution of 10 conserved motifs, identified using the MEME tool, across these proteins. Each motif is represented by a differently colored box, with the motif numbers (Motif 1 to Motif 10) indicated. The bottom section includes the sequence logos for each of these motifs, illustrating their conserved amino acid patterns.
Figure 2
Figure 2
Absence and presence of HSP20 genes across 55 maize inbred varieties. The vertical axis lists the HSP20 genes, categorized into Class A, Class B, Class C, and Class D, each indicated by a different background color. The horizontal axis represents the names of the 55 maize inbred lines. The heatmap color intensity indicates the number of specific HSP20 genes identified in each maize inbred line or its relatives. In certain inbred lines, a single pan-gene may correspond to multiple genes. Darker red shades represent a higher count of corresponding genes in that particular line.
Figure 3
Figure 3
Comparative analysis of secondary structures and ACD domains in HSP20 proteins. (A) Diagram illustrating the alignment of secondary structures and ACD domains across various HSP20 proteins. Each gene is represented by two sections: the upper section indicates the relative position of the ACD domain within the protein, while the lower section shows the relative positions of β-strands and α-helices within the protein’s secondary structure. (BE) Box plots displaying the distribution of lengths among different classes of HSP20 proteins: (B) Total protein length, (C) ACD domain length, (D) N-terminus length, and (E) C-terminus length.
Figure 4
Figure 4
Distribution of HSP20 genes on the chromosomes of maize inbred lines B73, W22, and Mo17. The figure illustrates the chromosomal localization of HSP20 gene family members in three maize inbred lines. Chromosomes of different inbred lines are represented by different colors: B73 in green, W22 in orange, and Mo17 in purple. The red-labeled genes indicate the specific chromosomal positions of each HSP20 gene.
Figure 5
Figure 5
Distribution of Ka/Ks ratios of the HSP20 gene family across different maize inbred lines in the pan-genome. This figure shows the distribution of Ka/Ks ratios for various HSP20 genes across different maize inbred lines. The y-axis lists the HSP20 genes, while the x-axis represents the Ka/Ks ratio values. The color gradient in the density plot, ranging from purple to yellow, indicates the magnitude of the Ka/Ks values, with darker colors representing lower ratios and lighter colors representing higher ratios. The height of the peaks indicates the frequency of occurrence of that Ka/Ks value.
Figure 6
Figure 6
Heatmap of the frequency of occurrence of different maize varieties at each HSP20 gene with Ka/Ks ratio > 1. The heatmap shows the frequency distribution of Ka/Ks values greater than 1 associated with specific HSP20 genes in each maize variety. The rows represent different HSP20 genes, while the columns represent different maize varieties. The color scale from blue to red indicates the frequency, with blue representing lower frequencies and red representing higher frequencies. The clustering of rows and columns reflects patterns of similarity in the occurrence of specific maize varieties across the HSP20 genes.
Figure 7
Figure 7
Expression of the Maize HSP20 Genes After Heat Stress Treatment. The heatmap illustrates the expression profiles of the HSP20 gene family in different maize (B73) tissues under heat stress treatment. The horizontal axis represents various tissues and time points, including leaves, roots, ears, silks, stalks, and tassels at 0 h, 2 h, and 48 h after heat stress treatment. The vertical axis lists the different HSP20 genes. The color gradient from blue to red indicates the Z-score of gene expression, ranging from low (blue) to high (red) expression levels.
Figure 8
Figure 8
Comparative GO Enrichment Analysis for Co-expressed Genes of Maize HSP20 Genes. This heatmap presents the GO enrichment analysis results of maize HSP20 gene family co-expressed genes. The x-axis represents individual HSP20 genes, with font colors indicating different categories. The y-axis lists the enriched GO terms related to various biological processes. The color gradient within the heatmap reflects the degree of enrichment, with deeper red colors indicating lower FDR values, signifying a higher level of enrichment for the corresponding GO terms.
Figure 9
Figure 9
Co-expression modules of maize HSP20 and HSF genes. This figure shows the co-expression modules derived from maize HSP20 and HSF co-expression network. Each node represents a gene, and the connections between nodes indicate co-expression relationships. The red nodes represent genes that are up-regulated under heat stress conditions.

Similar articles

Cited by

References

    1. Suzuki N. Fine Tuning of ROS, Redox and Energy Regulatory Systems Associated with the Functions of Chloroplasts and Mitochondria in Plants under Heat Stress. Int. J. Mol. Sci. 2023;24:1356. doi: 10.3390/ijms24021356. - DOI - PMC - PubMed
    1. Zhang L.-L., Zhu Q.-Y., Sun J.-L., Yao Z.-W., Qing T., Ma H., Liu J.-X. XBAT31 Regulates Reproductive Thermotolerance through Controlling the Accumulation of HSFB2a/B2b under Heat Stress Conditions. Cell Rep. 2024;43:114349. doi: 10.1016/j.celrep.2024.114349. - DOI - PubMed
    1. Park C.-J., Seo Y.-S. Heat Shock Proteins: A Review of the Molecular Chaperones for Plant Immunity. Plant Pathol. J. 2015;31:323–333. doi: 10.5423/PPJ.RW.08.2015.0150. - DOI - PMC - PubMed
    1. Guo M., Liu J.-H., Ma X., Luo D.-X., Gong Z.-H., Lu M.-H. The Plant Heat Stress Transcription Factors (HSFs): Structure, Regulation, and Function in Response to Abiotic Stresses. Front. Plant Sci. 2016;7:114. doi: 10.3389/fpls.2016.00114. - DOI - PMC - PubMed
    1. Kotak S., Port M., Ganguli A., Bicker F., Von Koskull-Döring P. Characterization of C-Terminal Domains of Arabidopsis Heat Stress Transcription Factors (Hsfs) and Identification of a New Signature Combination of Plant Class A Hsfs with AHA and NES Motifs Essential for Activator Function and Intracellular Localization. Plant J. 2004;39:98–112. doi: 10.1111/j.1365-313X.2004.02111.x. - DOI - PubMed

LinkOut - more resources