. 2024 Oct 29;25(21):11614.
doi: 10.3390/ijms252111614.

SARS-CoV-2 Displays a Suboptimal Codon Usage Bias for Efficient Translation in Human Cells Diverted by Hijacking the tRNA Epitranscriptome

Affiliations

SARS-CoV-2 Displays a Suboptimal Codon Usage Bias for Efficient Translation in Human Cells Diverted by Hijacking the tRNA Epitranscriptome

Patrick Eldin et al. Int J Mol Sci. .

Abstract

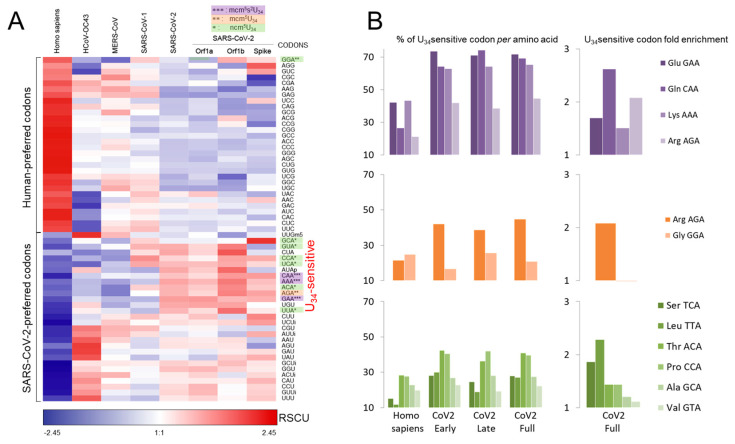
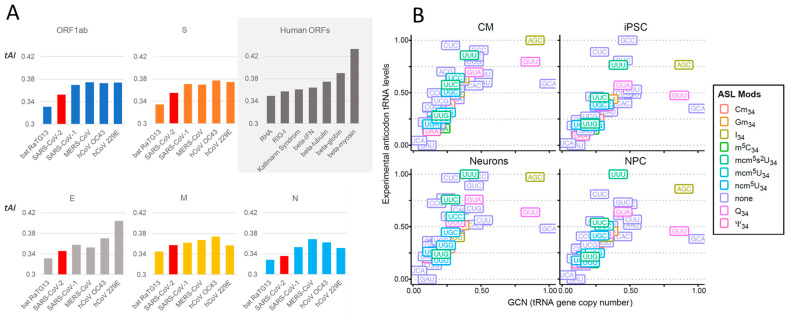
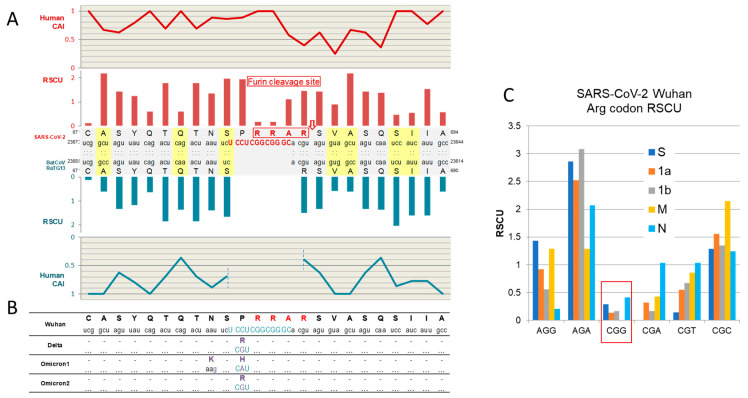
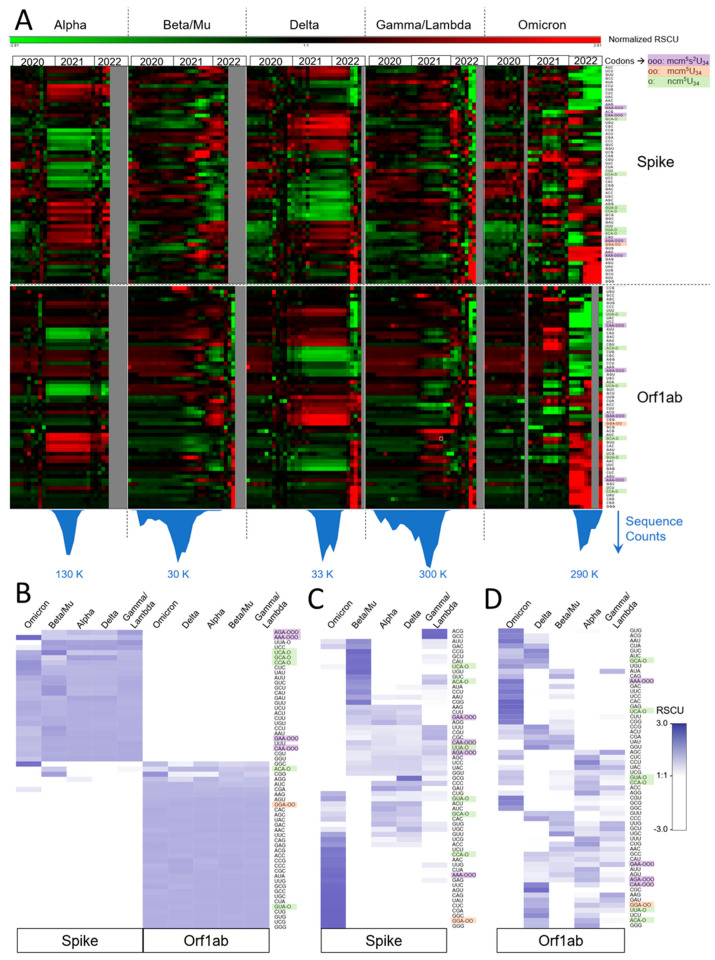
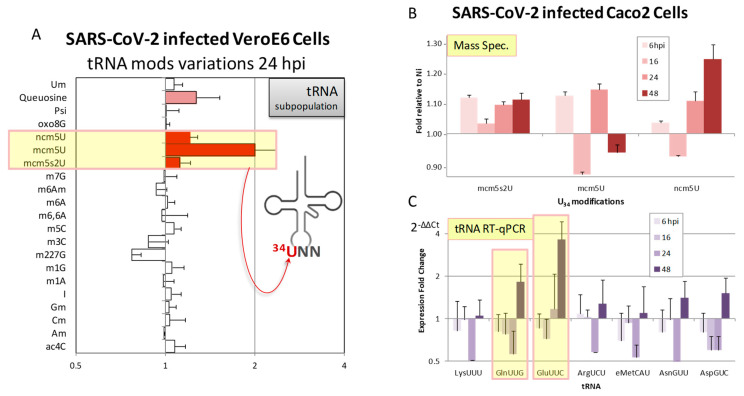
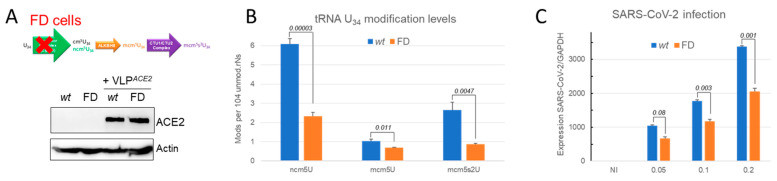
Codon bias analysis of SARS-CoV-2 reveals suboptimal adaptation for translation in human cells it infects. The detailed examination of the codons preferentially used by SARS-CoV-2 shows a strong preference for LysAAA, GlnCAA, GluGAA, and ArgAGA, which are infrequently used in human genes. In the absence of an adapted tRNA pool, efficient decoding of these codons requires a 5-methoxycarbonylmethyl-2-thiouridine (mcm5s2) modification at the U34 wobble position of the corresponding tRNAs (tLysUUU; tGlnUUG; tGluUUC; tArgUCU). The optimal translation of SARS-CoV-2 open reading frames (ORFs) may therefore require several adjustments to the host's translation machinery, enabling the highly biased viral genome to achieve a more favorable "Ready-to-Translate" state in human cells. Experimental approaches based on LC-MS/MS quantification of tRNA modifications and on alteration of enzymatic tRNA modification pathways provide strong evidence to support the hypothesis that SARS-CoV-2 induces U34 tRNA modifications and relies on these modifications for its lifecycle. The conclusions emphasize the need for future studies on the evolution of SARS-CoV-2 codon bias and its ability to alter the host tRNA pool through the manipulation of RNA modifications.

Keywords: SARS-CoV-2; codon usage; epitranscriptome; tRNA; translation.


Conflict of interest statement

The authors declare no conflicts of interest.

Figures

Scheme 1
Scheme 1
Visual representation of the sequential steps undertaken to develop and substantiate our hypothesis through experimentation. The left side details the supporting literature and original in silico analysis, which collectively led to the formulation of our central hypothesis. On the right side, this hypothesis was supported by existing arguments and further validated through our experimental approach [22,23,24,25,26,27,28,29,30,31,32,47,48,49,50,51,52,53,54,55,56,57,58,59,60,61,62,63,64,65,66,67,68,69,70,71,72,73].
Figure 1
Figure 1
The wobble hypothesis and tRNA U34 modifications. (A) Standard genetic code, tRNA anticodons, and their base modifications found in Homo sapiens. U34 modifications are in purple (mcm5s2U), orange (mcm5U), or green (ncm5U). Non-U34 modifications on the anticodon bases are in light blue, including Inosine (I), pseudouridine (Ψ), 2′-O-methylguanosine (Gm), 2′-O-methylcytosine (Cm), and Queuosine (Q). (B) Position of the multiple modifications on tRNA skeleton. (C) U34-modified tRNAs and enzyme complexes involved in U34 tRNA modifications. tRNAArgUCU can be found with either mcm5 or mcm5s2.
Figure 2
Figure 2
(A) Genome organization of SARS-CoV-2 and corresponding Codon Adaptation Index (CAI) with human genome. The numbers of proteins for Non-structural, Structural and Accessory proteins are indicated in parenthesis. (B) SARS-CoV-2 CAI (ORF-size weighted average) with respect to various species.
Figure 3
Figure 3
(A) Nc plots of SARS-CoV-2 Wuhan’s isolate individual gene segments (right) along with Flavivirus genomes (PF13, Asian genotype from French Polynesia (2013), MR766 original African genotype from Uganda (1955)) (left), and differentially expressed human genes (DHX9 (or RHA), DDX58 (RIG-I), KAL (Kallmann syndrome protein), IFN-beta (beta-interferon), Tubulin (beta-tubulin), Myosin (Myosin Heavy Chain), and Globin (beta-globin)) (center). The dotted line represents the expected Nc values if the codon bias is affected by GC3s only. The black dot represents the position of the SARS-CoV-2 total coding genome. (B) Nc plot of Orf1a and Spike gene segments from seven coronaviruses. (C) Neutrality plot analysis corresponding to virus sequences used in B. GC12 frequencies were plotted against GC3 frequencies. The y-axis (GC12) refers to the average GC frequency at the first and second codon positions. The x-axis (GC3) refers to the GC frequency at the third codon position. The slope value indicates the mutational pressure percentage.
Figure 4
Figure 4
(A) Hierarchical cluster analysis of RSCU for human coronavirus (HCoV-OC43, MERS-CoV, SARS-CoV-1, and SARS-CoV-2) and SARS-CoV-2 (Wuhan reference genome) longest ORFs (encoding non-structural genes (Orf1a an Orf1b) and structural gene Spike). Average linkage WPGMA (weighted pair group method with averaging) was used as the agglomeration method. U34-sensitive codons are color-coded. (B) Usage of U34-sensitive codons in human host and SARS-CoV-2 genome. Data are expressed in % of U34-sensitive codons for each amino acid analyzed, for either early SARS-CoV-2 genes (i.e., non-structural genes), late SARS-CoV-2 genes (i.e., structural genes), or the full viral genome. Fold enrichment of each U34-sensitive codon was deduced using human U34-sensitive codon frequencies per amino acid as reference.
Figure 5
Figure 5
tRNA Adapatation Index (tAI) of Coronavirus. (A) Calculations performed with stAIcalc software version 1.0 July 2016 (http://tau-tai.azurewebsites.net, accessed on 11 July 2023) using human tRNA gene copy number retrieved from the genomic tRNA database (http://gtrnadb.ucsc.edu, accessed on 22 June 2022), for non-structural (ORF1ab) or structural (S, E, M, N) ORFs of coronaviruses infecting bat (RaTG13) and human (hCoV 229E, hCoV OC43, SARS-CoV-1, MERS-CoV, and SARS-CoV-2). For comparison, tAI of human ORFs encoding highly abundant proteins (Protein Abundance Database (https://pax-db.org, accessed on 27 August 2023)) were calculated. Histogram of SARS-CoV-2 appears shaded in red. (B) Correlation between normalized human tRNA gene copy number (GCN) and normalized experimental anticodon tRNA expression level in human primary cells derived from iPSC cells (CM, cardiomyocytes; NPC, neuronal progenitor cells), based on the data from Gao et al. (2024) [114]. Anticodons are color-coded with respect to tRNA modifications occurring at position 34.
Figure 6
Figure 6
Insertional furin cleavage site in SARS-CoV-2’s Spike gene segment. (A) Sequence alignment between Wuhan SARS-CoV-2 isolate and bat RaTG13 sequences along with their respective RSCUs and human-related CAI profiles. The vertical red arrow indicates the peptide bond cleaved by furin. Codons highlighted in yellow represent codon variations between SARS-CoV-2 and RaTG13 without amino acid change. (B) Sequence variation of SARS-CoV-2 variants in the furin site vicinity (amino acids in red, nucleotides in blue). Only non-synonymous codons are indicated, with their respective modified codon. (C) RSCU of Arg codons found in the different ORFs of Wuhan SARS-CoV-2 primary isolate compared to the ArgRSCU of the highly expressed human beta-myosin ORF. RSCUs of the least used Arg codon CGG by SARS-CoV-2 are boxed in red.
Figure 7
Figure 7
(A). SARS-CoV-2 codon bias variation over time. RSCUs for Spike and Orf1ab were calculated from the various clade sequences extracted from the Fumagalli group’s paper [68] and analyzed over time for each clade using cluster analysis (using Genesis software). Sequence count profiles are shown beneath each clade time scale to trace each clade expansion. (B). Comparison of RSCUs at the expansion peak of each clade. Cluster analysis was established for both Spike and Orf1ab together (B) or individually (C,D). U34-sensitive codons are color-coded.
Figure 8
Figure 8
(A) Compiled variations in tRNA modifications in tRNA subpopulation of SARS-CoV-2-infected VeroE6 cells relative to mock control cells (fold variation relative to non-infected (NI) VeroE6 cells); U34 modifications are shaded in yellow and histogram of modifications occurring at position 34 are shaded red (ncm5, mcm5, mcm5s2) or pink (Queuosine). (B) Fold change variation in tRNA U34 modifications in SARS-CoV-2-infected human Caco2 cells relative to NI cells. (C) Fold change in tRNA levels in SARS-CoV-2-infected human Caco2 cells. Strong increases in tRNAGln and tRNAGlu expression are shaded in yellow. In all experiments, cells were infected at a MOI of 0.2.
Figure 9
Figure 9
(A) Primary human fibroblasts from a Familial Dysautonomia (FD) patient carrying ELP1 mutation (indicated by the red cross) were transduced by a lentivector expressing ACE2 receptor to allow SARS-CoV-2 entry. (B) tRNA U34 modification levels in wt or FD human primary fibroblasts determined by mass spectrometry analysis performed on tRNA subpopulation expressed as the number of modifications per 104 unmodified ribonucleosides (rNs). (C) wt and FD cells previously transduced ACE2-expressing lentivector (VLPACE2, controlled in A) were infected with increasing MOI of SARS-CoV-2 (0.05 to 0.2). SARS-CoV-2 infection levels were quantified by RT-qPCR with GAPDH mRNA used as an internal control for normalization. Each experiment was performed in triplicate.

Similar articles

Cited by

References

    1. Hershberg R., Petrov D.A. General Rules for Optimal Codon Choice. PLoS Genet. 2009;5:e1000556. doi: 10.1371/journal.pgen.1000556. - DOI - PMC - PubMed
    1. Grantham R., Gautier C., Gouy M., Mercier R., Pavé A. Codon catalog usage and the genome hypothesis. Nucleic Acids Res. 1980;8:r49–r62. doi: 10.1093/nar/8.1.197-c. - DOI - PMC - PubMed
    1. Deng Y., de Lima Hedayioglu F., Kalfon J., Chu D., von der Haar T. Hidden patterns of codon usage bias across kingdoms. J. R Soc. Interface. 2020;17:20190819. doi: 10.1098/rsif.2019.0819. - DOI - PMC - PubMed
    1. Parvathy S.T., Udayasuriyan V., Bhadana V. Codon usage bias. Mol. Biol. Rep. 2022;49:539–565. doi: 10.1007/s11033-021-06749-4. - DOI - PMC - PubMed
    1. Chaney J.L., Clark P.L. Roles for Synonymous Codon Usage in Protein Biogenesis. Annu. Rev. Biophys. 2015;44:143–166. doi: 10.1146/annurev-biophys-060414-034333. - DOI - PubMed

LinkOut - more resources