. 2024 Oct 30;25(21):11635.
doi: 10.3390/ijms252111635.

Anti-Inflammatory and Antinociceptive Properties of the Quercetin-3-Oleate AV2, a Novel FFAR1 Partial Agonist

Affiliations

Anti-Inflammatory and Antinociceptive Properties of the Quercetin-3-Oleate AV2, a Novel FFAR1 Partial Agonist

Federica Pessina et al. Int J Mol Sci. .

Abstract

Free fatty acid receptor 1 (FFAR1) has emerged as the most targeted isoform of the free fatty acid receptors because of its involvement in the modulation of energy balance and its potential role in the control of inflammatory and pain conditions. Quercetin-3-oleate (AV2), recognized as a new FFAR1 partial agonist, was investigated for its ability to modulate inflammation and nociception. Human immortal neuroblastoma SH and the murine macrophagic RAW 264.7 cells were used to evaluate cell viability, the potential cytoprotective activity, and the anti-inflammatory properties of AV2 in vitro. Paw edema, caused by zymosan-A, and the formalin test were used to assess the in vivo anti-inflammatory and antinociceptive effects in CD-1 mice. In vitro, AV2 was devoid of cytotoxicity, significantly reduced ROS in both cell types, and protected RAW 264.7 cells from lipopolysaccharide damage by reducing tumor necrosis factor-α production. Interestingly, AV2 induced a transient elevation of intracellular calcium that was reduced in cells, pre-incubated with the FFAR1 antagonist DC260126. In vivo, AV2 reduced formalin-induced nociception and zymosan A-induced paw edema, and both effects were reversed by the FFAR1 antagonist GW1100. In conclusion, these data strongly support the AV2-mediated antioxidant, anti-inflammatory, and antinociceptive activity. AV2 represents a promising molecule for the clinical management of inflammatory-related pain conditions.

Keywords: FFAR1; inflammation; nociception; oxidative stress; quercetin-3-oleate (AV2).


Conflict of interest statement

The authors declare no conflicts of interest.

Figures

Figure 1
Figure 1
Chemical structure of FFAR1 agonists and antagonists.
Figure 2
Figure 2
Chemical structure of the quercetin-3-oleoyl derivative AV2.
Figure 3
Figure 3
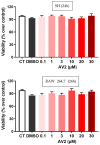
Cytotoxicity of AV2 (0.1 to 30 µM concentrations, in red scaling) after 24 h incubation in SH and RAW 264.7 cells. Cell viability was measured with fluorescein diacetate, and data were expressed as % over control, mean ± SEM (n = 5 repeated experiments). CT: control. No significant difference was observed (one-way ANOVA with Bonferroni post hoc test).
Figure 4
Figure 4
Cytoprotective activity of AV2 in vitro. AV2, at increasing concentrations (red scaling), reduced oxidative stress damage caused by H2O2 after 30 min of treatment in SH cells. Fluorescein diacetate assay was used to measure cell viability. CT: control, taken as 100%. ** p < 0.01, *** p < 0.001 vs. CT; ° p < 0.05, °° p <0.01, °°° p < 0.001 vs. DMSO+ H2O2; (one-way ANOVA p < 0.001; F = 71.96, with multiple comparisons).
Figure 5
Figure 5
Concentration of total F2-isoprostanes measured in SH cells after oxidative stress generated by H2O2 in the absence (DMSO) or presence of AV2 (1–10 µM). CT: control. *** p < 0.001 vs. CT; °° p < 0.01; °°° p < 0.001 vs. DMSO; (one-way ANOVA, p < 0.05, F = 12.7, with multiple comparisons).
Figure 6
Figure 6
Cytoprotective activity of AV2 in vitro. Intracellular ROS formation in RAW264.7 cells produced by GO (DMSO), taken as 100%. CT: control. **** p < 0.0001 vs. CT; ° p < 0.05, °°° p < 0.001; °°°° p < 0.0001 vs. DMSO + GO; (one-way ANOVA p< 0.05; F = 4.12, with multiple comparisons).
Figure 7
Figure 7
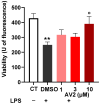
Effects of AV2 on LPS-induced damage in RAW264.7 cells. Cells were treated with LPS (1 μg/mL) in the absence (DMSO) or presence of AV2 at the indicated concentration for 24 h. Each bar represents the mean ± SEM calculated from three independent experiments. The significance was determined by one-way ANOVA (p < 0.0001, F = 7.36) with multiple comparisons. ** p < 0.01 vs. CT; ° p < 0.05 vs. DMSO + LPS. LPS: lipopolysaccharide. CT: control.
Figure 8
Figure 8
Effects of AV2 on LPS-induced TNF-α production in RAW264.7 cells. RAW264.7 cells were treated with LPS (1 µg/mL) in the absence (DMSO) (taken as 100%) or presence of AV2 for 24 h. TNF-α in the cultured supernatant was measured by ELISA. Each bar represents the mean ± standard deviation calculated from three independent experiments. The significance was determined by one-way ANOVA (F = 161.4; p < 0.0001), followed by multiple comparisons. * p < 0.05, ** p < 0.01 vs. CT; ° p < 0.05; °°° p < 0.001 vs. DMSO + LPS. CT, control; LPS, lipopolysaccharide; TNF-α, tumor necrosis factor-α.
Figure 9
Figure 9
AV2 induces Ca2+ increase in SH cells. Intracellular Ca2+ was monitored over time in cells loaded with the Ca2+ indicator Fura-2 and stimulated withAV2 (10 µM) in a medium containing 1 mM CaCl2. The cells were stimulated with AV2 alone (A) or after 15 min pre-incubation with the FFAR1 antagonist DC260126 (B) or in Ca2+-free conditions (C). Each color represents a single cell response. In (D), the data of each bar represent the AUC of the mean ± SEM, calculated from three independent experiments. ** p < 0.01 vs. AV2 + Ca2+.
Figure 10
Figure 10
AV2, GW1100, and AV2 + GW1100 effects on paw edema induced by zymosan A. AV2 was administered at the dose of 100 μg/mouse, whereas GW1100 was administered at the dose of 10 μg/mouse 15 min before zymosan A; in the antagonism experiments, GW1100 was administered together with AV2, 15 min before zymosan A. Data were analyzed using one-way ANOVA, followed by Tukey’s multiple-comparisons test. F3,24 = 11.06, p < 0.0001; ** p < 0.01 vs. control (CT)-treated animals; ° p < 0.05 vs. AV2. (CT = DMSO/saline 1:5 v/v), n = 7.
Figure 11
Figure 11
GW9580, GW1100, AV2, and AV2 + GW1100 effects in the formalin test after s.c. administration. GW9580 and AV2 were administered at the dose of 100 μg/mouse, whereas GW1100 was administered at the dose of 10 μg/mouse 15 min before formalin; in the antagonism experiments, GW1100 was simultaneously administered with AV2, 15 min before formalin. Data were analyzed using one-way ANOVA, followed by Tukey’s multiple-comparisons test. Early phase: F4,30 = 8.316, p < 0.0001. Late phase: F4,30 = 15.41, p < 0.0001; * p < 0.05 and **** p < 0.0001 vs. control (CT)-treated animals; § p < 0.05 and §§§§ p < 0.0001 vs. GW9508; °°°° p < 0.0001 vs. AV2. (CT= DMSO/saline 1:5 v/v), n = 7.
Figure 12
Figure 12
GW9508, GW1100, AV2, GW9508 + GW1100, and AV2 + GW1100 effects on the formalin test after i.c.v. administration. All compounds were administered i.c.v. at the dose of 1 μg/mouse 15 min before formalin. In the antagonism experiments, GW1100 was simultaneously administered with GW9508 or AV2. Data were analyzed using one-way ANOVA, followed by Tukey’s multiple-comparisons test. Early phase: F5,36= 5.428, p < 0.001. Late phase: F5,36= 9.101, p < 0.0001; ** p < 0.01 and **** p < 0.0001 vs. control (CT)-treated animals; §§§ p < 0.001 vs. GW9508; °°° p < 0.001 vs. AV2. (CT= DMSO/saline 1:5 v/v), n = 7.

References

    1. Mahri S.A., Malik S.S., Ibrahim M.A., Haji E., Dairi G., Mohammad S. Free Fatty Acid Receptors (FFARs) in Adipose: Physiological Role and Therapeutic Outlook. Cells. 2022;11:750. doi: 10.3390/cells11040750. - DOI - PMC - PubMed
    1. Alvarez-Curto E., Milligan G. Metabolism meets immunity: The role of free fatty acid receptors in the immune system. Biochem. Pharmacol. 2016;114:3–13. doi: 10.1016/j.bcp.2016.03.017. - DOI - PubMed
    1. Hirasawa A., Hara T., Katsuma S., Adachi T., Tsujimoto G. Free Fatty Acid Receptors and Drug Discovery. Biol. Pharm. Bull. 2008;31:1847–1851. doi: 10.1248/bpb.31.1847. - DOI - PubMed
    1. Hara T., Kimura I., Inoue D., Ichimura A., Hirasawa A. Free Fatty Acid Receptors and Their Role in Regulation of Energy Metabolism. Rev. Physiol. Biochem. Pharmacol. 2013;164:77–116. - PubMed
    1. Li Z., Xu X., Huang W., Qian H. Free Fatty Acid Receptor 1 (FFAR1) as an Emerging Therapeutic Target for Type 2 Diabetes Mellitus: Recent Progress and Prevailing Challenges. Med. Res. Rev. 2018;38:381–425. doi: 10.1002/med.21441. - DOI - PubMed

LinkOut - more resources