. 2024 Oct 30;25(21):11689.
doi: 10.3390/ijms252111689.

Amino Acid Compound 2 (AAC2) Treatment Counteracts Insulin-Induced Synaptic Gene Expression and Seizure-Related Mortality in a Mouse Model of Alzheimer's Disease

Affiliations

Amino Acid Compound 2 (AAC2) Treatment Counteracts Insulin-Induced Synaptic Gene Expression and Seizure-Related Mortality in a Mouse Model of Alzheimer's Disease

Zhijie Deng et al. Int J Mol Sci. .

Abstract

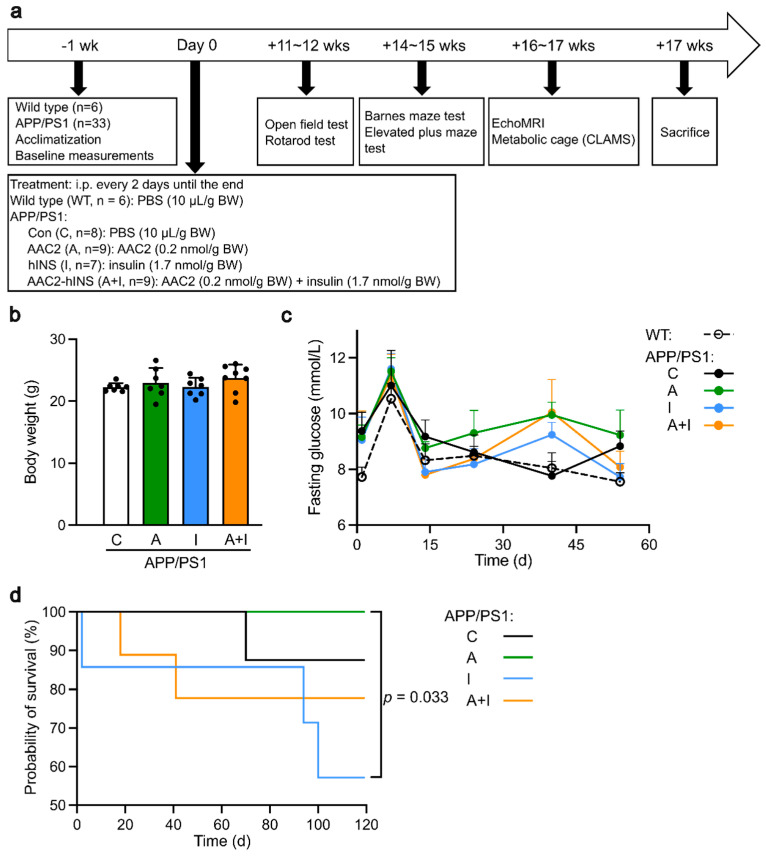
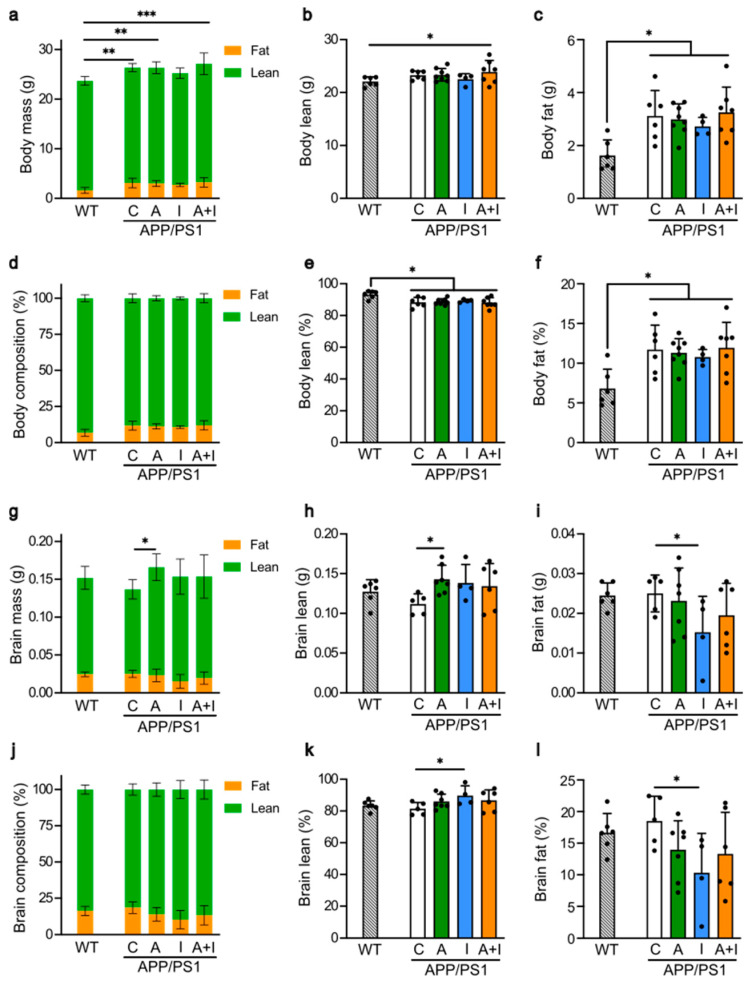
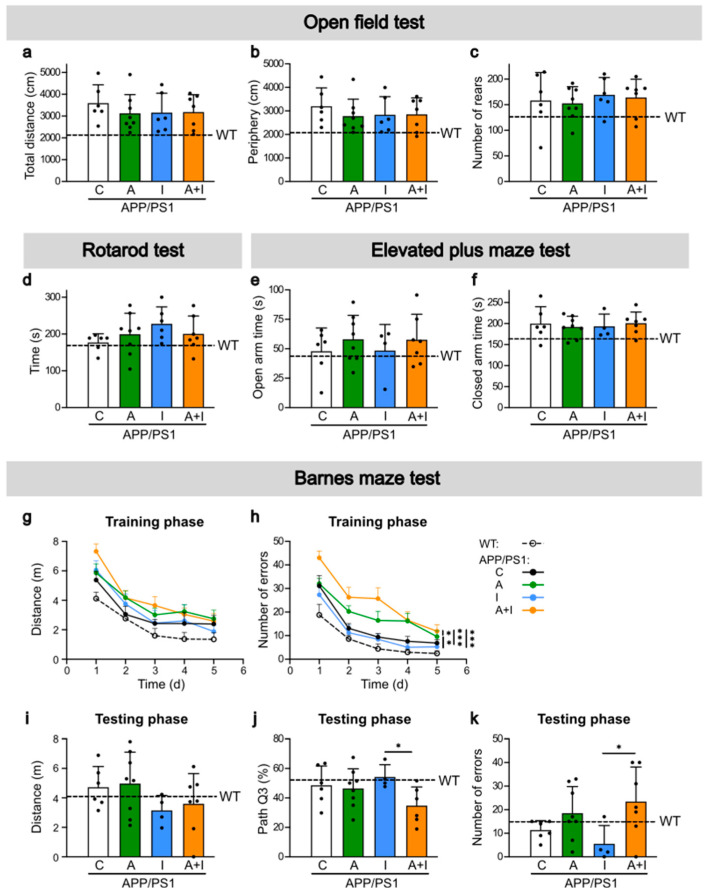
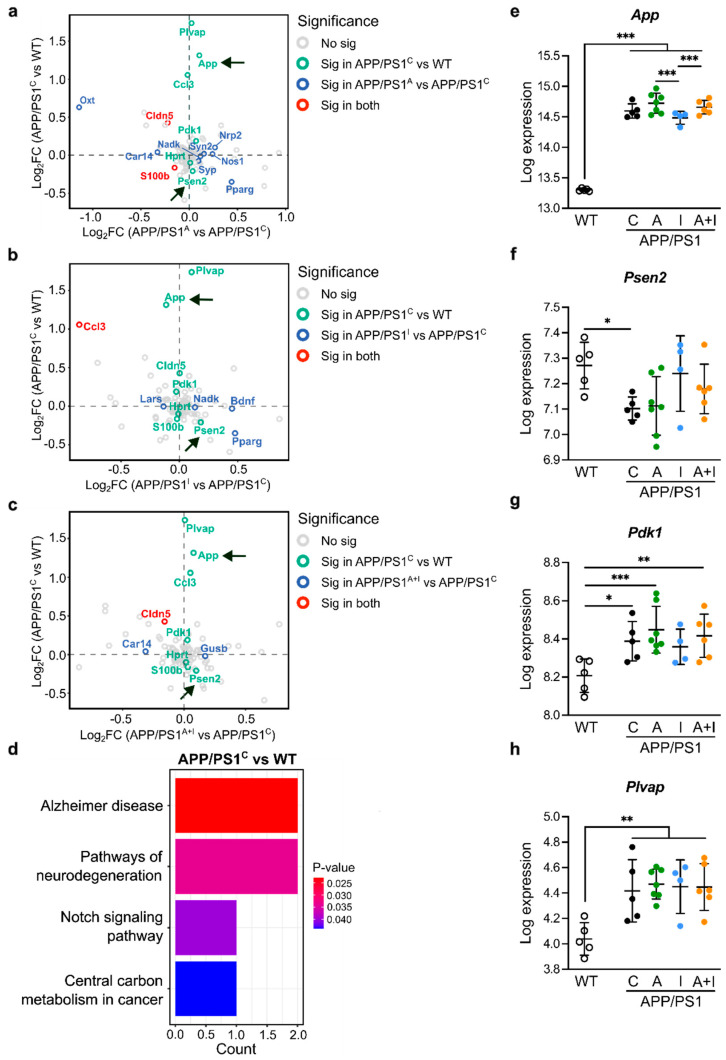
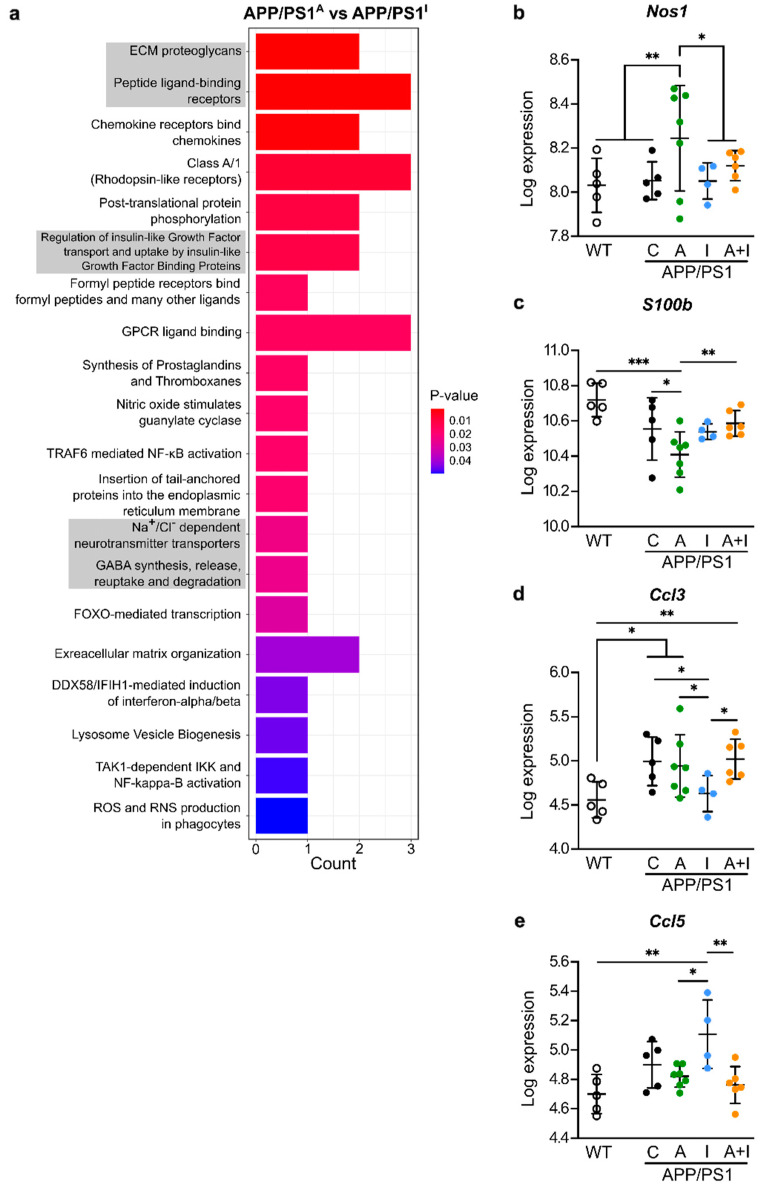
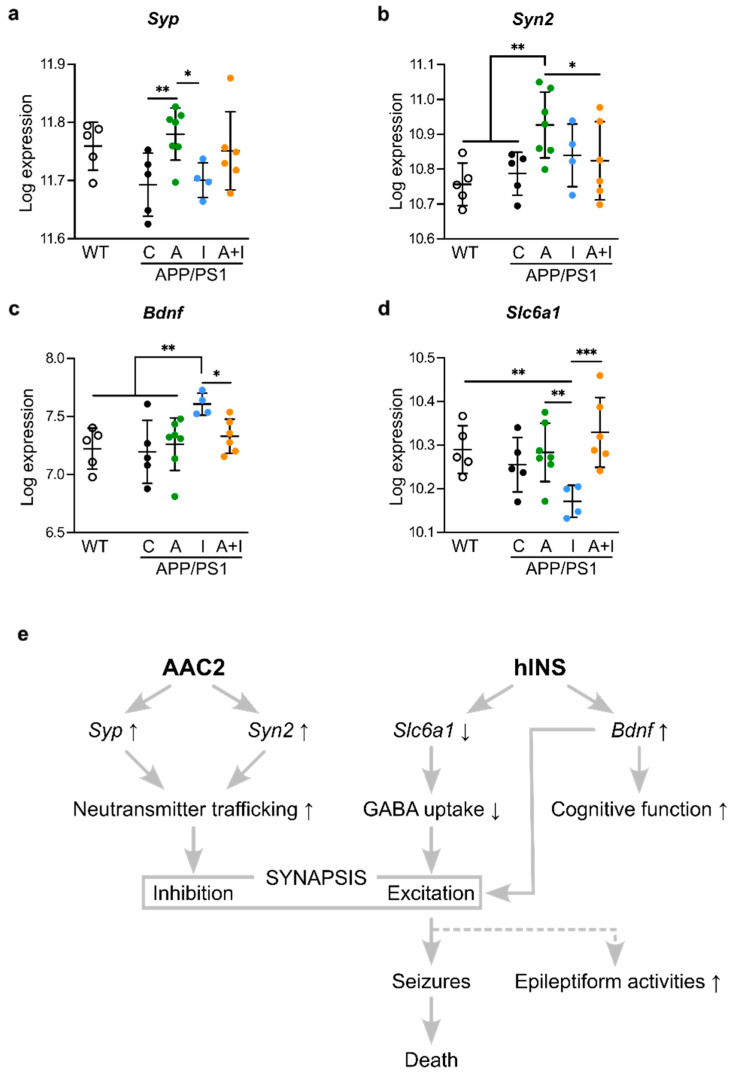
Diabetes is a major risk factor for Alzheimer's disease (AD). Amino acid compound 2 (AAC2) improves glycemic and cognitive functions in diabetic mouse models through mechanisms distinct from insulin. Our goal was to compare the effects of AAC2, insulin, and their nanofiber-forming combination on early asymptomatic AD pathogenesis in APP/PS1 mice. Insulin, but not AAC2 or the combination treatment (administered intraperitoneally every 48 h for 120 days), increased seizure-related mortality, altered the brain fat-to-lean mass ratio, and improved specific cognitive functions in APP/PS1 mice. NanoString and pathway analysis of cerebral gene expression revealed dysregulated synaptic mechanisms, with upregulation of Bdnf and downregulation of Slc1a6 in insulin-treated mice, correlating with insulin-induced seizures. In contrast, AAC2 promoted the expression of Syn2 and Syp synaptic genes, preserved brain composition, and improved survival. The combination of AAC2 and insulin counteracted free insulin's effects. None of the treatments influenced canonical amyloidogenic pathways. This study highlights AAC2's potential in regulating synaptic gene expression in AD and insulin-induced contexts related to seizure activity.

Keywords: Alzheimer’s disease; cognitive; dementia; diabetes; dipeptides; epilepsy; insulin; nanofibers; nanomaterials; seizures; synapses.


Conflict of interest statement

The authors declare no conflicts of interest.

Figures

Figure 1
Figure 1
Experimental design and differential survival among WT mice and APP/PS1 control group (C) and groups treated with AAC2 (A), hINS (I), or AAC2–hINS (A+I) for 17 weeks. (a) Schematic diagram of treatment protocol of WT and APP/PS1 mice subjected to intraperitoneal injection of AAC2, hINS, or AAC2–hINS combination. Treatments were administered every 2 days until the end of the experiment. Premature death of mice was recorded. (b) Similar body weight of APP/PS1 mice from all groups prior to the treatment. Not significant (N.s.), ANOVA (c) Kinetics of fasting glucose concentrations in blood (mmol/L) in WT mice (dashed line, n = 7) and APP/PS1 mice treated with PBS (C, n = 7), AAC2 (A, n = 8), hINS (I, n = 6), and AAC2–hINS (A+I, n = 8) was measured for 54 days following treatment. N.s. ANOVA (d) Kaplan–Meier survival curve of APP/PS1 mice treated with PBS, AAC2, hINS, and AAC2–hINS throughout the whole experiment. p = 0.033 for comparison between AAC2 and hINS treatment via log-rank survival analysis.
Figure 2
Figure 2
Similar effects of treatment with AAC2 (A, n = 5), hINS (I, n = 4), and their combination (A+I, n = 5) compared to control APP/PS1 mice treated with PBS (C, n = 4) on the metabolic status parameters and activity measured in metabolic cages during 24 h. (ac) Kinetics of the energy expenditure (kcal/h) during 22 h (a), light cycle (b), and dark cycle (c). N.s., generalized linear model (GLM) [34] (df) Kinetics of the respiratory exchange rate (RER) during the same experiment during 22 h (d), light cycle (e), and dark cycle (f). Dashed line, the critical RER threshold at which carbohydrates begin to contribute to energy provision [35]. Asterisk, * p < 0.05, GLM. (gj) The activity (XYZ) of APP/PS1 mice in same experiment during 22 h (g), light cycle (h), dark cycle (i), and a comparison of activity increase from a light to a dark period (j). Double asterisks, ** p < 0.001, paired t test.
Figure 3
Figure 3
Treatment with AAC2 and INS altered brain mass and composition, respectively, without affecting body composition. Differences in body composition were measured in living WT (n = 6) and APP/PS1 mice (C, n = 6; A, n = 8; I, n = 4; A+I, n = 7) by EchoMRI: (ac) The total body mass (a), body lean mass (b), and body fat mass (c) in of WT and APP/PS1 mice. Asterisks, comparison between WT and APP/PS1 mice: * p < 0.05, ** p < 0.01, *** p < 0.001. ANOVA (df) Body composition (d), lean (e), and fat (f) composition percentage were calculated taking into account mass of each animal. Asterisk, comparison between control and treated groups, * p < 0.05. ANOVA (gi) Differences in brain composition were measured in frozen brains from same mouse groups by EchoMRI. The total brain mass (g), brain lean mass (h), and brain fat mass (i) of WT and APP/PS1 mice. Asterisk, * p < 0.05. ANOVA (jl) The brain composition (% compared to mass of each animal) (j), brain lean (k), and brain fat compositions (%) (l) of WT and APP/PS1 mice. Asterisk, * p < 0.05. ANOVA.
Figure 4
Figure 4
All APP/PS1 and WT mice exhibited similar cognitive characteristics, but learning outcomes differed between free and AAC2-bound INS-treated APP/PS1 mice. (ac) Open field test was performed with WT (n = 6) and APP/PS1 mice after 11 weeks of treatment (C, n = 6; A, n = 8; I, n = 6; A+I, n = 7). Total distance (a), amount of activity spent in the periphery of the arena (b), and number of rears (c) were measured. N.s., ANOVA (d) Rotarod test was conducted in same animals after 12 weeks of treatment. N.s., ANOVA (e,f) elevated plus-maze (EPM) test was conducted on WT (n = 6) and APP/PS1 mice after 15 weeks of treatment (C, n = 6; A, n = 8; I, n = 4; A+I, n = 7). The amount of time the mice spent in the open (e) and closed arms (f) was measured, N.s., ANOVA. (gk) Barnes maze test was conducted on WT (n = 6) and APP/PS1 mice after 14 weeks of treatment (C, n = 6; A, n = 8; I, n = 4; A+I, n = 7). During the training phase (Day 1–5), the total distance travelled by mice (g) and the number of errors, which were visits made to holes other than the one that leads to the goal box (h), were measured. The probe trial was for 90 s. Asterisks represent comparison between INS and other treatment groups, AAC2 vs. A+I, and C vs. A+I ** p < 0.01, and *** p < 0.001, repeated ANOVA. During the testing phase, the total distance (i), the proportion of distance travelled within Q3 area containing the escaping hole (j), and the number of errors (k) were measured. Asterisks represent comparison between free INS and bound with AAC2/INS nanofibers, * p < 0.05, ANOVA.
Figure 5
Figure 5
Treatment with AAC2, hINS, and their combination did not influence the expression of canonical AD genes in the brains. (ac) Scatter plot compared differently expressed genes (DEGs) between APP/PS1 control and WT (arrows, canonic genes, such as App and Psen2) on Y axes with DEGs between treatment and control groups in APP/PS1 mice on X axes: (a) AAC2 treatment vs. control; (b) hINS treatment vs. control, (c) AAC2–hINS treatment vs. control. (d) KEGG pathway over-representation analysis of the DEGs between APP/PS1 control and WT mice. (eh) The expression of cerebral App (e), Psen2 (f), Pdk1 (g), and Plvap (h) in WT (n = 5) and APP/PS1 mice C, n = 5; A, n = 7; I, n = 4; A+I, n = 6). Differential analysis was performed using DESeq2 R package mainly based on the GLM and empirical Bayes shrinkage, * p < 0.05, ** p < 0.01, *** p < 0.001.
Figure 6
Figure 6
AAC2 and hINS regulate different neuroinflammatory pathways in APP/PS1 mice. (a) Reactome pathway over-representation analysis of the DEGs between WT and AAC2- and hINS-treated APP/PS1 mice. (be) The expression of cerebral Nos1 (b), S100b (c), Ccl3 (d), and Ccl5 (e) in WT (n = 5) and APP/PS1 mice (C, n = 5; A, n = 7; I, n = 4; A+I, n = 6). Differential analysis was performed using DESeq2 R package mainly based on GLM and empirical Bayes shrinkage * p < 0.05, 0.001 ≤ ** p < 0.01, *** p < 0.001.
Figure 7
Figure 7
Different responses of APP/PS1 mice to AAC2 and hINS result from the possible disbalance of GABAergic synaptic excitation and inhibition (ad) The expression of cerebral Syp (a) Syn2 (b), as well as implicated in excitation Bdnf (c), Slc6a1 (d) in WT (n = 5) and APP/PS1 mice (C, n = 5; A, n = 7; I, n = 4; A+I, n = 6). Differential analysis was performed using DESeq2 R package mainly based on the GLM and empirical Bayes shrinkage, * p < 0.05, ** p < 0.01, *** p < 0.001. (e) Hypothesized mechanism for discrepant effects of AAC2 and INS treatment in APP/PS1 mice.

Similar articles

References

    1. Swinburn B.A., Sacks G., Hall K.D., McPherson K., Finegood D.T., Moodie M.L., Gortmaker S.L. The global obesity pandemic: Shaped by global drivers and local environments. Lancet. 2011;378:804–814. doi: 10.1016/S0140-6736(11)60813-1. - DOI - PubMed
    1. NCD Risk Factor Collaboration (NCD-RisC) Worldwide trends in diabetes since 1980: A pooled analysis of 751 population-based studies with 4.4 million participants. Lancet. 2016;387:1513–1530. doi: 10.1016/S0140-6736(16)00618-8. - DOI - PMC - PubMed
    1. GBD 2019 Dementia Forecasting Collaborators Estimation of the global prevalence of dementia in 2019 and forecasted prevalence in 2050: An analysis for the Global Burden of Disease Study 2019. Lancet Public Health. 2022;7:e105–e125. doi: 10.1016/S2468-2667(21)00249-8. - DOI - PMC - PubMed
    1. Knopman D.S., Amieva H., Petersen R.C., Chetelat G., Holtzman D.M., Hyman B.T., Nixon R.A., Jones D.T. Alzheimer disease. Nat. Rev. Dis. Primers. 2021;7:33. doi: 10.1038/s41572-021-00269-y. - DOI - PMC - PubMed
    1. Janson J., Laedtke T., Parisi J.E., O’Brien P., Petersen R.C., Butler P.C. Increased risk of type 2 diabetes in Alzheimer disease. Diabetes. 2004;53:474–481. doi: 10.2337/diabetes.53.2.474. - DOI - PubMed

LinkOut - more resources