. 2024 Nov 1;25(21):11759.
doi: 10.3390/ijms252111759.

T Regulatory Cell Subsets Do Not Restore for One Year After Acute COVID-19

Affiliations

T Regulatory Cell Subsets Do Not Restore for One Year After Acute COVID-19

Arthur Aquino et al. Int J Mol Sci. .

Abstract

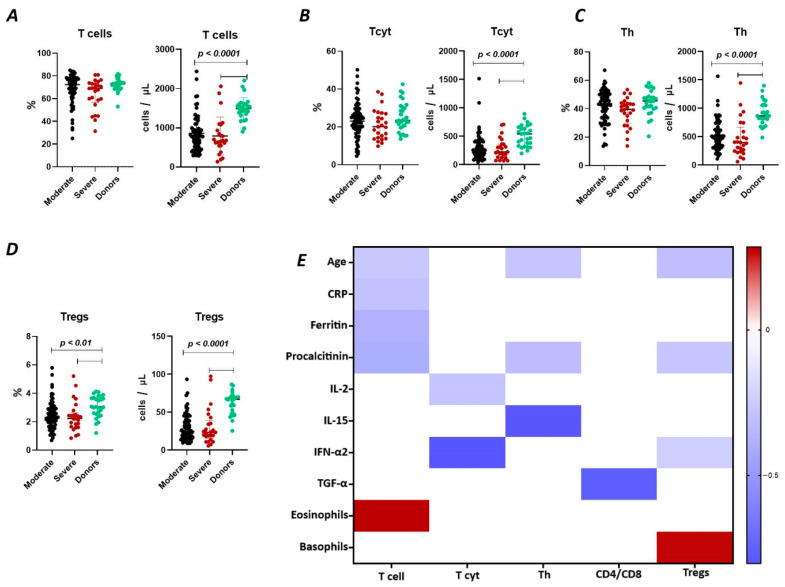
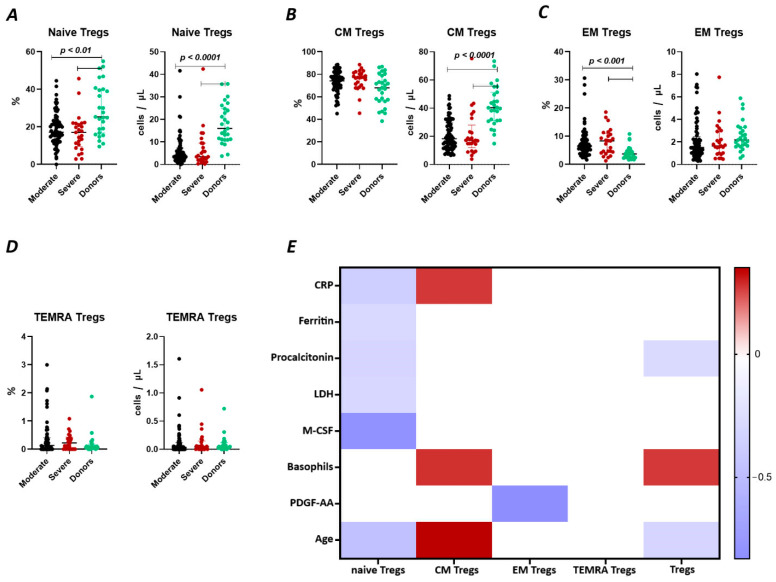
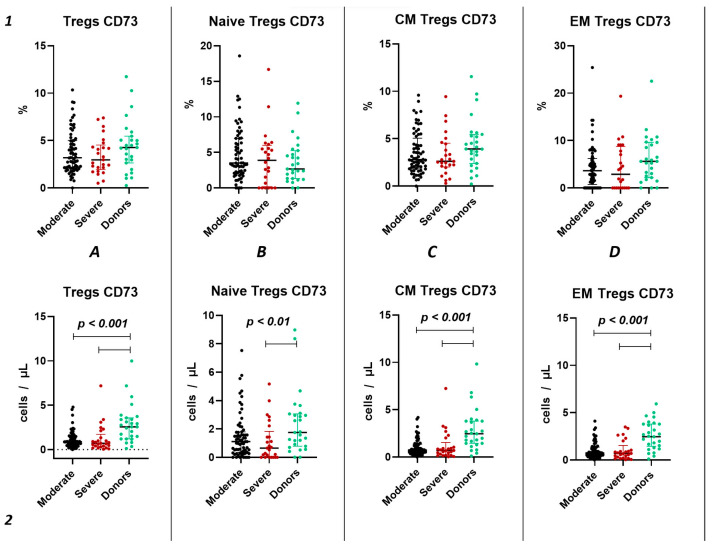
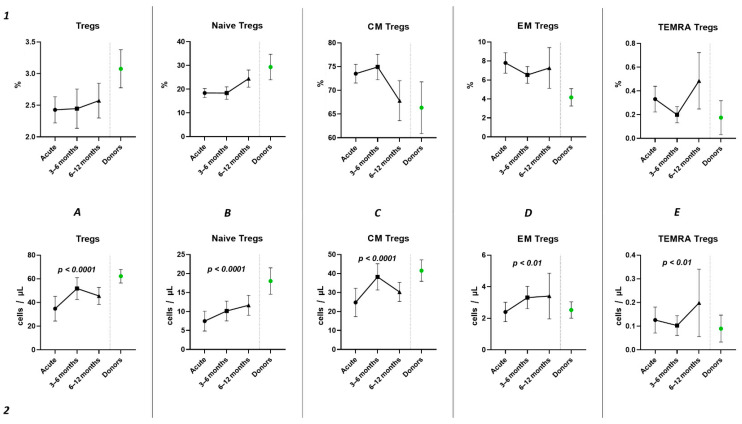
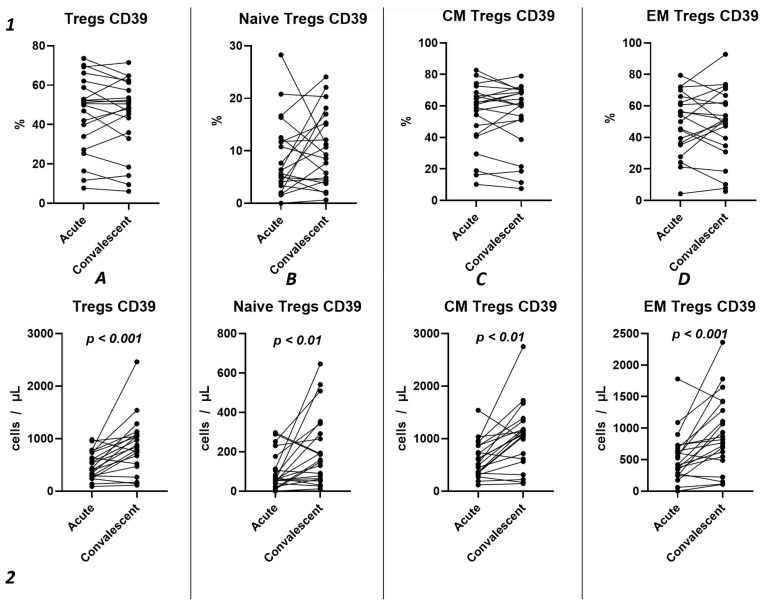
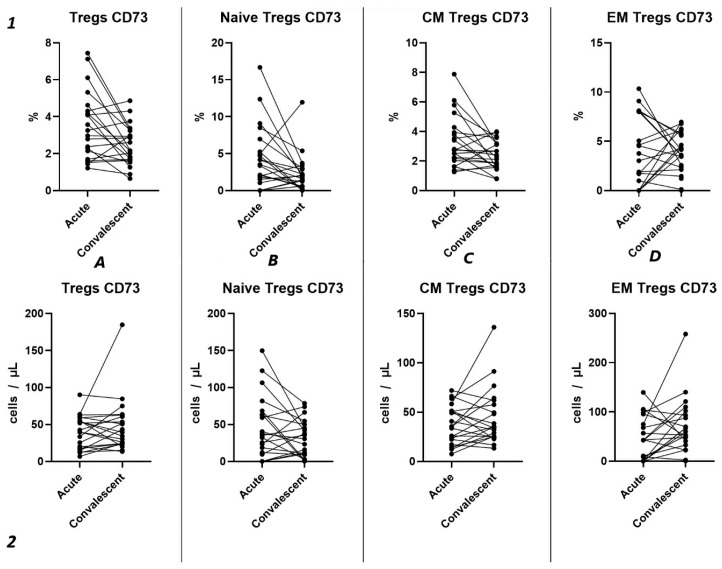
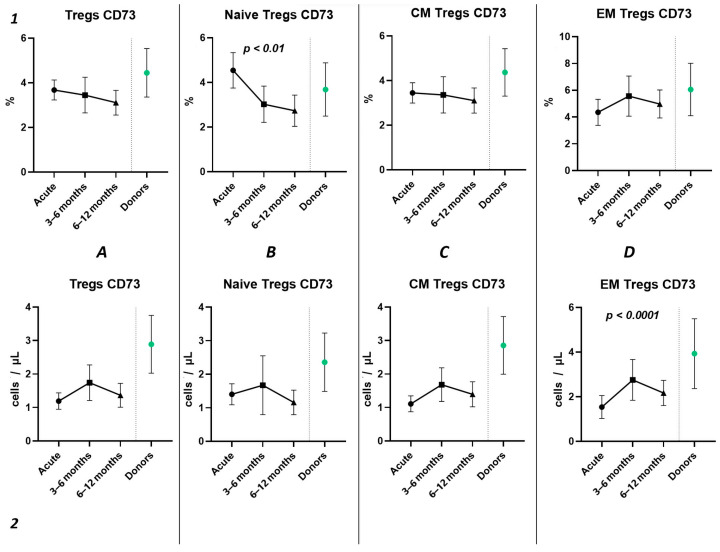
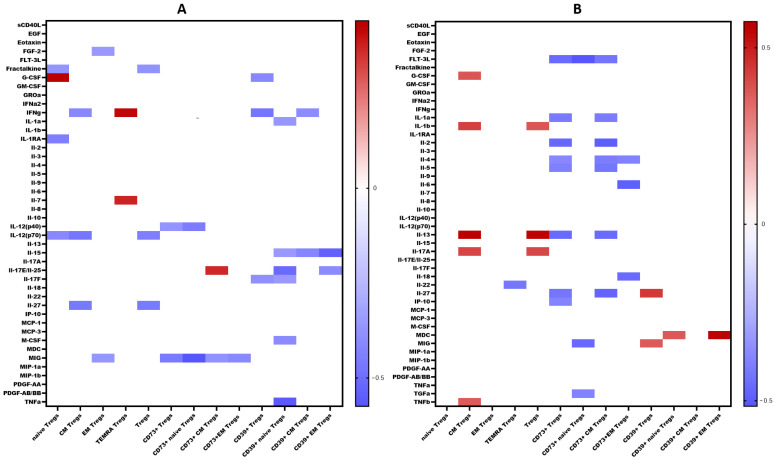
COVID-19, caused by SARS-CoV-2, triggers a complex immune response, with T regulatory cells (Tregs) playing a crucial role in maintaining immune homeostasis and preventing excessive inflammation. The current study investigates the function of T regulatory cells during COVID-19 infection and the subsequent recovery period, emphasizing their impact on immune regulation and inflammation control. We conducted a comprehensive analysis of Treg subpopulations in peripheral blood samples from COVID-19 patients at different stages: acute infection, early convalescence, and long-term recovery. Flow cytometry was employed to quantify Tregs including "naïve", central memory (CM), effector memory (EM), and terminally differentiated CD45RA+ effector cells (TEMRA). Additionally, the functional state of the Tregs was assessed by the expression of purinergic signaling molecules (CD39, CD73). Cytokine profiles were assessed through multiplex analysis. Our findings indicate a significant decrease in the number of Tregs during the acute phase of COVID-19, which correlates with heightened inflammatory markers and increased disease severity. Specifically, we found a decrease in the relative numbers of "naïve" and an increase in EM Tregs, as well as a decrease in the absolute numbers of "naïve" and CM Tregs. During the early convalescent period, the absolute counts of all Treg populations tended to increase, accompanied by a reduction in pro-inflammatory cytokines. Despite this, one year after recovery, the decreased subpopulations of regulatory T cells had not yet reached the levels observed in healthy donors. Finally, we observed the re-establishment of CD39 expression in all Treg subsets; however, there was no change in CD73 expression among Tregs. Understanding these immunological changes across different T regulatory subsets and adenosine signaling pathways offers important insights into the disease's pathogenesis and provides a broader view of immune system dynamics during recovery.

Keywords: COVID-19; T regulatory cells; convalescent period; multicolor flow cytometry; purinergic signaling.


Conflict of interest statement

The authors declare no conflicts of interest.

Figures

Figure 1
Figure 1
T cell subpopulations in acute COVID-19 and in healthy donors. (A). Relative count and absolute number of T cells. (B). Relative count and absolute number of cytotoxic T cells (CD3+CD8+). (C). Relative count and absolute number of T helper cells (CD3+CD4+). (D). Relative count and absolute number of T regulatory cells (CD3+CD4+CD25bright). (E). Heat map of correlations between T cell subsects and some conventional clinical and laboratory markers in patients with COVID-19.
Figure 2
Figure 2
T Regulatory cell subsets in acute COVID-19 and in healthy donors. (A). Relative count and absolute number of naïve regulatory T cells (Naïve Tregs). (B). Relative count and absolute number of central memory regulatory T cells (CM Tregs). (C). Relative count and absolute number of effector memory regulatory T cells (EM Tregs). (D). Relative count and absolute number of terminally differentiated CD45RA+ effector regulatory T cells (TEMRA Tregs). (E). Heat map of correlations between regulatory T cell subsects and some conventional clinical and laboratory markers in patients with COVID-19.
Figure 3
Figure 3
CD39 expression on T regulatory cell subpopulations in acute COVID-19. Upper row (1)—relative counts; bottom row (2)—absolute number. (A). CD39+ regulatory T cells. (B). CD39+ naïve regulatory T cells (Naïve Tregs). (C). CD39+ central memory regulatory T cells (CM Tregs). (D). CD39+ effector memory regulatory T cells (EM Tregs).
Figure 4
Figure 4
CD73 expression on T regulatory cell subpopulations in acute COVID-19. Upper row (1)—relative counts; bottom row (2)—absolute number. (A). CD73+ regulatory T cells. (B). CD73+ naïve regulatory T cells (Naïve Tregs). (C). CD73+ central memory regulatory T cells (CM Tregs). (D). CD73+ effector memory regulatory T cells (EM Tregs).
Figure 5
Figure 5
Dynamic changes in Tregs subsets. Upper row (1)—relative counts; bottom row (2)—absolute number. (A). Total T regulatory T cells (Tregs). (B). Naïve Tregs. (C). Central memory (CM) Tregs. (D). Effector memory (EM) Tregs. (E). Terminally differentiated CD45RA+ effector cells (TEMRA) Tregs.
Figure 6
Figure 6
Three-point dynamic assessment of relative and absolute number of Treg subsets. Upper row (1)—relative counts; bottom row (2)—absolute number. (A). Total T regulatory T cells (Tregs). (B). Naïve Tregs. (C). Central memory (CM) Tregs. (D). Effector memory (EM) Tregs. (E). Terminally differentiated CD45RA+ effector cells (TEMRA) Tregs. Results presented as mean with 95% CI.
Figure 7
Figure 7
Dynamics of CD39+ T regulatory cell subpopulations. Upper row (1)—relative counts; bottom row (2)—absolute number. (A). Total T regulatory T cells (Tregs). (B). Naïve Tregs. (C). Central memory (CM) Tregs. (D). Effector memory (EM) Tregs.
Figure 8
Figure 8
The three-point dynamic assessment of relative and absolute numbers of CD39+ Tregs and their subpopulations. Upper row (1)—relative counts; bottom row (2)—absolute number. (A). Total T regulatory T cells (Tregs). (B). Naïve Tregs. (C). Central memory (CM) Tregs. (D). Effector memory (EM) Tregs. Results presented as mean with 95% CI.
Figure 9
Figure 9
Dynamics of CD73+ T regulatory cell subpopulations. Upper row (1)—relative counts; bottom row (2)—absolute number. (A). Total T regulatory T cells (Tregs). (B). Naïve Tregs. (C). Central memory (CM) Tregs. (D). Effector memory (EM) Tregs.
Figure 10
Figure 10
The three-point dynamic assessment of relative and absolute numbers of CD73+ Tregs and their subpopulations. Upper row (1)—relative counts; bottom row (2)—absolute number. (A). Total T regulatory T cells (Tregs). (B). Naïve Tregs. (C). Central memory (CM) Tregs. (D). Effector memory (EM) Tregs. Results presented as mean with 95% CI.
Figure 11
Figure 11
Heat map of correlations between cytokine levels and relative count of Treg subsets in convalescents after COVID-19 (A). At 3–6 months. (B). At 6–12 months. Color scale bar shows a range of correlation coefficients (r). The red color represents a high positive correlation, decreasing to the blue color bar, which represents a negative correlation. Heat map shows only significant correlation coefficients (p < 0.05).
Figure 12
Figure 12
Consistent gating strategy for regulatory T-cells phenotyping. (A). Initial gating of time of stable flow. (B). Identification of lymphocytes, based on CD45 expression. (C). Exclusion of cell aggregates. (D). Identification of lymphocytes, based on their morphology. (E). Gating T-cells, expressing CD3. (F). Gating of helper and cytotoxic T-cells, based on their expression of CD4 and CD8, respectively. (G). Identification of regulatory T-cells with CD3+CD4+CD25bright phenotype.
Figure 13
Figure 13
Gating strategy for regulatory T-cells subsets phenotyping. (AC). Gating of naïve, central memory (CM), effector memory (EM), and T effector memory re-expressing CD45RA (TEMRA), based on their expression of CD45RA and CD62L, in helper (Th), cytotoxic (Tcyt) and regulatory T-cells (Tregs), respectively. (DF). Expression of CD73 and CD39 on helper, cytotoxic, and regulatory T-cells, respectively.

Similar articles

References

    1. Sharma A., Tiwari S., Deb M.K., Marty J.L. Severe acute respiratory syndrome coronavirus-2 (SARS-CoV-2): A global pandemic and treatment strategies. Int. J. Antimicrob. Agents. 2020;56:106054. doi: 10.1016/j.ijantimicag.2020.106054. - DOI - PMC - PubMed
    1. Hojyo S., Uchida M., Tanaka K., Hasebe R., Tanaka Y., Murakami M., Hirano T. How COVID-19 induces cytokine storm with high mortality. Inflamm. Regen. 2020;40:37. doi: 10.1186/s41232-020-00146-3. - DOI - PMC - PubMed
    1. Nazerian Y., Ghasemi M., Yassaghi Y., Nazerian A., Hashemi S.M. Role of SARS-CoV-2-induced cytokine storm in multi-organ failure: Molecular pathways and potential therapeutic options. Int. Immunopharmacol. 2022;113:109428. doi: 10.1016/j.intimp.2022.109428. - DOI - PMC - PubMed
    1. Davitt E., Davitt C., Mazer M.B., Areti S.S., Hotchkiss R.S., Remy K.E. COVID-19 disease and immune dysregulation. Best Pract. Res. Clin. Haematol. 2022;35:101401. doi: 10.1016/j.beha.2022.101401. - DOI - PMC - PubMed
    1. Liechti T., Iftikhar Y., Mangino M., Beddall M., Goss C.W., O’Halloran J.A., Mudd P.A., Roederer M. Immune phenotypes that are associated with subsequent COVID-19 severity inferred from post-recovery samples. Nat. Commun. 2022;13:7255. doi: 10.1038/s41467-022-34638-2. - DOI - PMC - PubMed