Case Reports
. 2024 Nov 3;25(21):11815.
doi: 10.3390/ijms252111815.

Functional Evaluation of a Novel Homozygous ADCY3 Variant Causing Childhood Obesity

Affiliations
Case Reports

Functional Evaluation of a Novel Homozygous ADCY3 Variant Causing Childhood Obesity

Idris Mohammed et al. Int J Mol Sci. .

Abstract

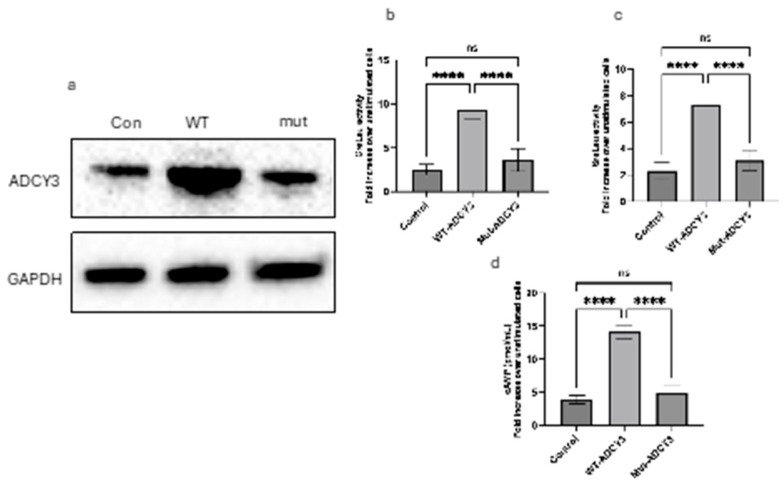
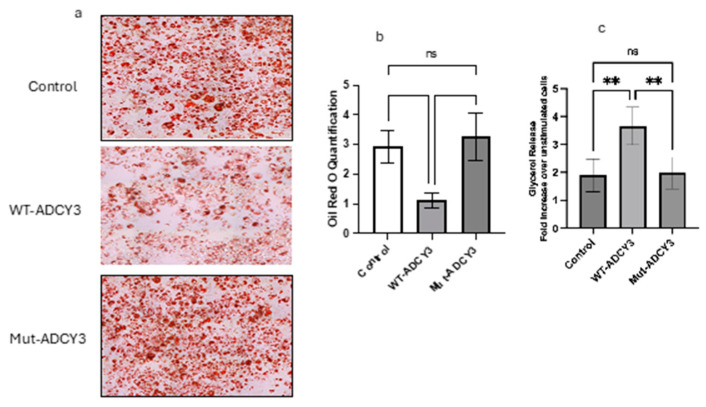
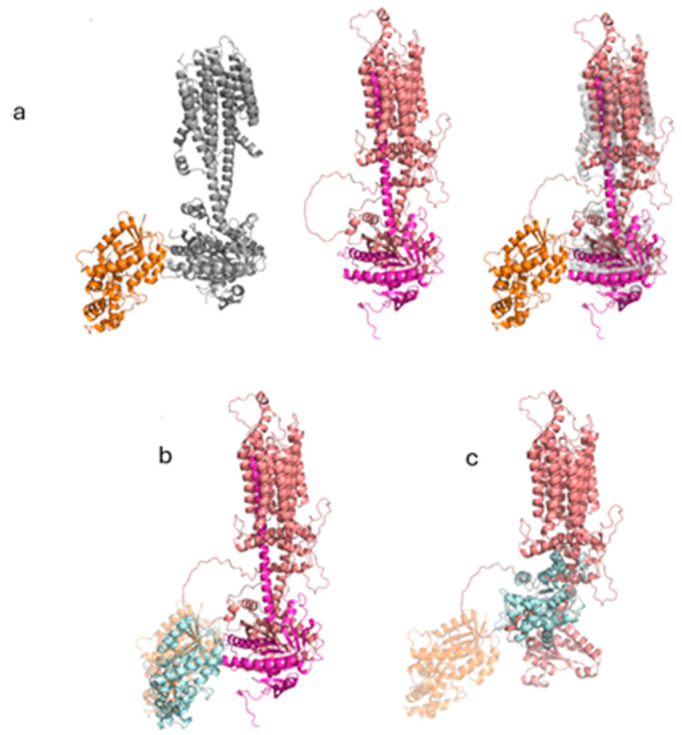
Adenylate cyclase 3 (ADCY3) is a transmembrane protein predominantly expressed in the primary cilia of neurons. It plays a vital role in converting ATP to cAMP, a secondary messenger that regulates various downstream signaling pathways such as carbohydrates and lipids metabolism. Homozygous loss-of-function variants in the ADCY3 gene lead to severe early-onset obesity and insulin resistance whereas gain-of-function variants protect against obesity. To describe a novel pathogenic ADCY3 variant implicated in early-onset obesity and functionally characterize this variant via in vitro and in silico validation, we identified a novel homozygous nonsense variant c.2520C>G, p.Thr840X in the ADCY3 gene using gene panel sequencing in a four-year-old girl. She was born to first-cousin consanguineous parents. The patient presented with severe obesity, and exhibited hepatomegaly and insulin resistance, with other biochemical and hormonal tests being normal. In vitro and in silico functional analyses showed downregulation and impaired activation of the ADCY3 protein. Our findings contribute to existing research that supports the role of ADCY3 in the genetic pathogenesis of early-onset obesity. In vitro and in silico functional characterization of the novel p.Thr840X variant showed impaired enzymatic activity leading to receptor loss of function, consistent with the patient's phenotype. Genetic testing is essential in severe early-onset obesity and early diagnosis could benefit patients with personalized treatment strategies.

Keywords: ADCY3; adenylate cyclase-3; childhood obesity; monogenic obesity.


Conflict of interest statement

The authors declare no conflict of interest.

Figures

Figure 1
Figure 1
Impact of wild-type and mutant ADCY3 on protein expression, signaling pathways, and cAMP production in 3T3-L1 cells. (a) Western blot showing ADCY3 protein levels in 3T3-L1 cells transfected with wild-type (WT) or mutant ADCY3. GAPDH was used as a loading control. (b) CRE-luciferase activity in 3T3-L1 cells expressing WT or mutant ADCY3. Cells were treated with forskolin, resulting in a 2.5-fold increase in CRE-luciferase activity in WT ADCY3-expressing cells compared to unstimulated controls, while mutant ADCY3 showed significantly reduced activity (Control: 2.5 ± 0.61; WT-ADCY3: 9.33 ± 1.11; Mut-ADCY3: 3.62 ± 1.27; n = 3). (c) SRE-luciferase activity in 3T3-L1 cells expressing WT or mutant ADCY3. Forskolin treatment led to a nearly 3-fold increase in SRE-luciferase activity in WT ADCY3-expressing cells, whereas mutant ADCY3 showed markedly lower activity (Control: 2.32 ± 0.65; WT-ADCY3: 7.28 ± 1.13; Mut-ADCY3: 3.1 ± 0.76, n = 3). (d) Intracellular cAMP levels in 3T3-L1 cells expressing WT or mutant ADCY3 following forskolin treatment. WT ADCY3 significantly increased cAMP levels, while mutant ADCY3 exhibited only a modest increase (Control: 3.89 ± 0.63; WT-ADCY3: 14.10 ± 1.01; Mut-ADCY3: 4.84 ± 1.22, n = 3). Error bars represent the standard deviation (SD) from three independent experiments. **** p < 0.0001. Note: ns: not significant.
Figure 2
Figure 2
Lipid accumulation and lipolysis in 3T3-L1 cells expressing wild-type and mutant ADCY3. (a) Oil Red O staining of differentiated 3T3-L1 cells. Control cells (top panel) transfected with an empty vector showed moderate lipid accumulation. Cells expressing wild-type (WT) ADCY3 (middle panel) displayed reduced lipid accumulation, with fewer and smaller lipid droplets. Cells expressing mutant ADCY3 (bottom panel) exhibited increased lipid accumulation, with larger and more densely packed lipid droplets. (b) Quantification of lipid accumulation from Oil Red O staining. WT ADCY3-expressing cells had significantly lower lipid content compared to control and mutant ADCY3-expressing cells (Control: 2.92 ± 0.55; WT-ADCY3: 1.130 ± 0.25; Mut-ADCY3: 3.27 ± 0.80; n = 3). (c) Lipolysis assay showing glycerol release in forskolin-stimulated 3T3-L1 cells. WT ADCY3-expressing cells exhibited a higher glycerol release compared to mutant ADCY3-expressing cells, indicating enhanced lipolytic activity (Control: 1.9 ± 0.59; WT-ADCY3: 3.66 ± 0.67; Mut-ADCY3: 1.98 ± 0.56; n = 3). Error bars represent the standard deviation from three independent experiments. ** p < 0.01. Note: ns: not significant.
Figure 3
Figure 3
The truncated segment of ADCY3 is required for its activation by the stimulatory G-protein subunit. (a) Left panel: Cartoon representation of ADCY9 (gray) bound to the activated G-protein subunit (orange). Middle panel: Cartoon representation of WT ADCY3 (salmon) highlighting the truncated segment (magenta). Right panel: Cartoon representation of the aligned ADCY3 (salmon) and ADCY9 (transparent gray) bound to the stimulatory G-protein unit (orange) and highlighting the truncated segment in ADCY3 (magenta). (b) Cartoon representation of the highest-score docked stimulatory G-protein subunit (cyan) with the intracellular domain of the WT ADCY3. ADCY3 is colored in salmon, and the truncated region in magenta. The original stimulatory G-protein subunit pose is represented in a transparent orange color. (c) Cartoon representation of the highest-score docked stimulatory G-protein subunit (cyan) with the intracellular domain of the truncated ADCY3 (salmon). The original stimulatory G-protein subunit pose is represented in a transparent orange color.

References

    1. Farooqi I.S., O’Rahilly S. Monogenic Obesity in Humans. Annu. Rev. Med. 2005;56:443–458. doi: 10.1146/annurev.med.56.062904.144924. - DOI - PubMed
    1. Stergiakouli E., Gaillard R., Tavaré J.M., Balthasar N., Loos R.J., Taal H.R., Evans D.M., Rivadeneira F., Pourcain B.S., Uitterlinden A.G., et al. Genome-wide association study of height-adjusted BMI in childhood identifies functional variant in ADCY3. Obesity. 2014;22:2252–2259. doi: 10.1002/oby.20840. - DOI - PMC - PubMed
    1. Bishop G.A., Berbari N.F., Lewis J., Mykytyn K. Type III adenylyl cyclase localizes to primary cilia throughout the adult mouse brain. J. Comp. Neurol. 2007;505:562–571. doi: 10.1002/cne.21510. - DOI - PubMed
    1. Cao H., Chen X., Yang Y., RStorm D. Disruption of Type 3 Adenylyl Cyclase Expression in the Hypothalamus Leads to Obesity. Integr. Obes. Diabetes. 2016;2:225–228. doi: 10.15761/IOD.1000149. - DOI - PMC - PubMed
    1. Saeed S., Bonnefond A., Tamanini F., Mirza M.U., Manzoor J., Janjua Q.M., Din S.M., Gaitan J., Milochau A., Durand E., et al. Loss-of-function mutations in ADCY3 cause monogenic severe obesity. Nat. Genet. 2018;50:175–179. doi: 10.1038/s41588-017-0023-6. - DOI - PubMed

Publication types

LinkOut - more resources