. 2024 Nov 4;25(21):11829.
doi: 10.3390/ijms252111829.

Nrf2 Deficiency Exacerbates the Decline in Swallowing and Respiratory Muscle Mass and Function in Mice with Aspiration Pneumonia

Affiliations

Nrf2 Deficiency Exacerbates the Decline in Swallowing and Respiratory Muscle Mass and Function in Mice with Aspiration Pneumonia

Hikaru Hashimoto et al. Int J Mol Sci. .

Abstract

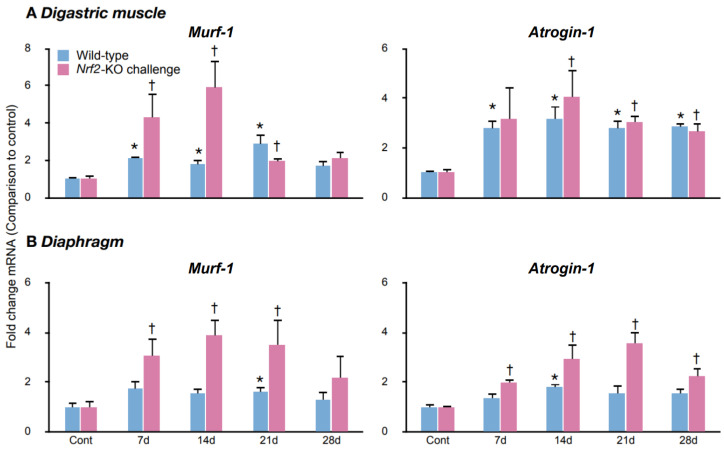
Aspiration pneumonia exacerbates swallowing and respiratory muscle atrophy. It induces respiratory muscle atrophy through three steps: proinflammatory cytokine production, caspase-3 and calpain, and then ubiquitin-proteasome activations. In addition, autophagy induces swallowing muscle atrophy. Nrf2 is the central detoxifying and antioxidant gene whose function in aspiration pneumonia is unclear. We explored the role of Nrf2 in aspiration pneumonia by examining swallowing and respiratory muscle mass and function using wild-type and Nrf2-knockout mice. Pepsin and lipopolysaccharide aspiration challenges caused aspiration pneumonia. The swallowing (digastric muscles) and respiratory (diaphragm) muscles were isolated. Quantitative RT-PCR and Western blotting were used to assess their proteolysis cascade. Pathological and videofluoroscopic examinations evaluated atrophy and swallowing function, respectively. Nrf2-knockouts showed exacerbated aspiration pneumonia compared with wild-types. Nrf2-knockouts exhibited more persistent and intense proinflammatory cytokine elevation than wild-types. In both mice, the challenge activated calpains and caspase-3 in the diaphragm but not in the digastric muscles. The digastric muscles showed extended autophagy activation in Nrf2-knockouts compared to wild-types. The diaphragms exhibited autophagy activation only in Nrf2-knockouts. Nrf2-knockouts showed worsened muscle atrophies and swallowing function compared with wild-types. Thus, activation of Nrf2 may alleviate inflammation, muscle atrophy, and function in aspiration pneumonia, a major health problem for the aging population, and may become a therapeutic target.

Keywords: Nrf2; aspiration pneumonia; muscle atrophy; respiratory muscles; swallowing muscles.


Conflict of interest statement

Author Peerada Ngamsnae is employed by the company MDPI. The remaining authors declare that the research was conducted in the absence of any commercial or financial relationships that could be construed as a potential conflict of interest.

Figures

Figure 1
Figure 1
(AG): The changes in body weight and lung pathology in challenged mice. (A): The body weight change during the 28-day aspiration challenge. * p < 0.05 vs. wild-types. (BG): The lung tissue sections that are representative of controls ((B): wild-types, (E): Nrf2-knockouts), and after 28 days of aspiration challenge ((C,D): wild-types, (F,G): Nrf2-knockouts) stained for hematoxylin and eosin. (HO): Confocal images of leucocytes infiltrating into the lungs in wild-type (HK) or Nrf2-knockout (LO) mice after a 28-day challenge (I,K,M,O) or in controls (H,J,L,N). A few S100A8-immunoreactive neutrophils (green) and F4/80-immunoreactive macrophages (red) infiltrated the controls (H,L). Many neutrophils and macrophages infiltrated the challenged lungs (I,M). We recognized a similar trend in the infiltrations of CD3e-immunoreactive T cells (green) and B220-immunoreactive B cells (red) (J,K,N,O). (PS): The area densities of infiltrated leukocytes were differentially quantified. Macrophages and B cells infiltrated more in Nrf2-knockouts than in wild-types in challenged groups (Q,S). Scale bars: (B,C,E,F): 500 µm in (B). (D,G): 200 µm in (D). (HO): 50 µm in (H). * p below 0.05 versus controls, † p below 0.05 versus challenged wild-types. Five mice per group; data are from 2 individual experiments.
Figure 2
Figure 2
The proinflammatory cytokine mRNA expression levels in the challenged muscles. (A,B): Q-RT-PCR determined Il-1β (left panels), Il-6 (center panels), and Mcp-1 (right panels) mRNA levels as proinflammatory mediators in the digastric muscles (A) and the diaphragms (B). Cont, control mice; 7 d, mice challenged for 7 days; 14 d, mice challenged for 14 days; 21 d, mice challenged for 21 days; 28 d, mice challenged for 28 days. Indicated levels are fold changes in comparison to the average values of control wild-types or Nrf2-knockouts, respectively; * p below 0.05 versus controls of wild-types. † p below 0.05 versus controls of Nrf2-knockouts. Five mice per group, representative of 2–3 individual trials.
Figure 3
Figure 3
The activations of the proteases in the challenged muscles. (A,B): Western blot analysis and quantification of bands immunoreactive with fodrin or p61. Caspase-3 cleavage products are at 120 kDa, and mostly calpain-mediated cleavage products are at 145–150 kDa and 62 kDa (p62) in the digastric muscles (A) and the diaphragms (B). Cont, control mice; 7 d, mice challenged for 7 days; 14 d, mice challenged for 14 days; 21 d, mice challenged for 21 days; 28 d, mice challenged for 28 days. Indicated levels are fold changes in comparison to the average values of control wild-types or Nrf2-knockouts, respectively; * p below 0.05 versus controls of wild-types. † p below 0.05 versus controls of Nrf2-knockouts. Three mice in each group; data are from 2–3 individual experiments.
Figure 4
Figure 4
The temporal profiles of Murf-1 and Atrogin-1 expression. (A,B): Q-RT-PCR evaluated the mRNA expression degrees of the E3 ubiquitin ligases, Murf-1 (left panels) and Atrogin-1 (right panels), which are muscle-specific, in the digastric muscles (A) and the diaphragms (B). Cont, control mice; 7 d, mice challenged for 7 days; 14 d, mice challenged for 14 days; 21 d, mice challenged for 21 days; 28 d, mice challenged for 28 days. Indicated levels are fold changes in comparison to the average values of control wild-types or Nrf2-knockouts, respectively; * p below 0.05 versus controls of wild-types. † p below 0.05 versus controls of Nrf2-knockouts. Five mice per group, representative of 2–3 individual trials.
Figure 5
Figure 5
Autophagy-associated gene activation in the challenged muscles. (A,B): Q-RT-PCR determined the mRNA levels of autophagy-involved genes, Lc3b (left panels), Bnip3 (center panels), and Gabarapl1 (right panels), in the digastric muscles (A) and the diaphragms (B). Cont, control mice; 7 d, mice challenged for 7 days; 14 d, mice challenged for 14 days; 21 d, mice challenged for 21 days; 28 d, mice challenged for 28 days. Indicated levels are fold changes in comparison to the average values of control wild-types or Nrf2-knockouts, respectively; * p below 0.05 versus controls of wild-types. † p below 0.05 versus controls of Nrf2-knockouts. Five mice per group, representative of 2–3 individual trials.
Figure 6
Figure 6
Muscle atrophy induced by the aspiration challenge in Nrf2-knockout mice. (A,B): The digastric muscles (A) and diaphragms (B) were isolated from wild-types and Nrf2-knockouts. The left panels show data from control mice, and the right panels show data from 28-day challenged mice. The graphs of frequency distributions of fiber sizes and the representative images of each group are shown. * p less than 0.05 vs. wild-types at the same fiber size. Five mice per group, representative of 2 individual trials. The scale bar in the left upper panel applies to all the images: 50 µm.
Figure 7
Figure 7
The swallowing muscle atrophy resulted in impaired swallowing function. (AC): The swallowing function was videofluoroscopically examined using the LabScope. The LabScope equips an X-ray source and an X-ray camera with an observation chamber (A). A mouse in the chamber drank an oral contrast agent in a bowl (B). The fluoroscopy shows the entire head and cranial side of the thorax of a mouse. The white arrow shows the contrast agent in the oropharynx, and the black arrow shows the contrast agent in the bowl (C). (DF): The speed from the vallecula to the 2nd cervical vertebra is shown as the bolus speed (D). The number of cycles from the mandible opening to closing in one second is shown as the mastication rate (E). The time length between 2 sequential successive swallows is shown as the inter-swallow interval (F). * p below 0.05 versus wild-types. † p below 0.05 versus Nrf2-knockout controls. Five mice per group.

References

    1. Lu F., Okazaki T., Okuyama J., Izumi S.I. Impacts of body positions on the geniohyoid muscle contraction and swallowing difficulty in healthy adults. Clin. Exp. Dent. Res. 2023;9:670–678. doi: 10.1002/cre2.760. - DOI - PMC - PubMed
    1. Ebihara T. Comprehensive Approaches to Aspiration Pneumonia and Dysphagia in the Elderly on the Disease Time-Axis. J. Clin. Med. 2022;11:5323. doi: 10.3390/jcm11185323. - DOI - PMC - PubMed
    1. Cruz-Jentoft A.J., Bahat G., Bauer J., Boirie Y., Bruyere O., Cederholm T., Cooper C., Landi F., Rolland Y., Sayer A.A., et al. Sarcopenia: Revised European consensus on definition and diagnosis. Age Ageing. 2019;48:601. doi: 10.1093/ageing/afz046. - DOI - PMC - PubMed
    1. Okazaki T., Ebihara S., Mori T., Izumi S., Ebihara T. Association between sarcopenia and pneumonia in older people. Geriatr. Gerontol. Int. 2020;20:7–13. doi: 10.1111/ggi.13839. - DOI - PubMed
    1. Fujishima I., Fujiu-Kurachi M., Arai H., Hyodo M., Kagaya H., Maeda K., Mori T., Nishioka S., Oshima F., Ogawa S., et al. Sarcopenia and dysphagia: Position paper by four professional organizations. Geriatr. Gerontol. Int. 2019;19:91–97. doi: 10.1111/ggi.13591. - DOI - PubMed

MeSH terms

LinkOut - more resources